www.wjpr.net Vol 4, Issue 09, 2015.
1108
FORMULATION AND
IN-VITRO
EVALUATION OF SOLID
DISPERSION OF β-CYCLODEXTRIN COMPLEX OF GLIMEPIRIDE
WITH POLOXAMER
Senthil Kumar Krishnan*, Pavan kumar, Dr.Mohammed Gulzar Ahmed Department of Pharmaceutics, Sri Adhichunchanagiri College of Pharmacy, B.G.Nagara,
Karnataka, Pin. Code: 571448, India.
ABSTRACT
The objective of the research project is to enhance of the solubility of
Glimepiride by using solid dispersion technique and the production of
GMP tablets showing prolonged effect. The polymers used were
β-Cyclodextrin (β-CD) and Poloxamer 188 (PLX-188) and solid
dispersions were prepared by physical mixture (PHY) and Solvent
evaporation (SE) method. Solid dispersions with different ratios 1:1,
1:3, 1:5 (using physical mixture and solvent evaporation method were
prepared). The prepared solid dispersions were characterized by
Physical appearance, FT-IR, % Drug content were evaluated. F1 to
F19 tablet formulations were prepared by dry granulation technique,
lactose monohydrate used as a filler, HPMC as a binder, ethyl alcohol
used as a granulating agent, ethyl cellulose used as a granules coating
polymer and each formulation GMP containing; a) GMP alone, b)
GMP : β-CD (1:1, 1:3,1:5) PHY and SE, c) GMP : PLX-188 (1:1, 1:3,1:5) PHY and SE and, d) GMP: β-CD: PLX-188 (1:1:1, 1:2:2,1:3:3) PHY and SE. The solvent evaporation method
showed more enhancement of GMP solubility than the Physical mixture. Finally, optimized
coated granules were evaluated for their micromeritic properties such as true density, tapped
density, Carr's index, and flow properties show satisfactory results. Tablet formulations were
evaluated for various pharmaceutical characteristics viz. hardness, % friability, weight
variation, drug content, in-vitro dissolution profiles. The dissolution results revealed that
formulations F12 showed 96.15%, F15 showed 94.93% and F18 showed 97.67% of drug
release at the end of 12 hrs. The drug release follows mixed order kinetics and the mechanism
was found to be diffusion and non-fickian release. Based on the results of in-vitro and
Volume 4, Issue 9, 1108-1122. Research Article ISSN 2277– 7105
Article Received on 30 June 2015,
Revised on 24 July 2015, Accepted on 18 Aug 2015
*Correspondence for
Author
Senthil Kumar Krishnan
Department of
Pharmaceutics, Sri
Adhichunchanagiri
College of Pharmacy,
B.G.Nagara, Karnataka,
Pin. Code: 571448, India.
www.wjpr.net Vol 4, Issue 09, 2015.
1109 kinetics studies it was concluded that F12, F15 and F18 formulations shows sustained release
action and solid dispersion technique by using β-CD and PLX-188 successfully used for
enhancing the solubility of Glimepiride.
KEYWORDS: Glimepiride, β-Cyclodextrin (β-CD), Poloxamer 188 (PLX-188), Solid dispersion, Sustained release tablets.
INTRODUCTION
Solid dispersions have attracted considerable interest as an efficient means of improving the
dissolution rate and hence the bioavailability of a range of hydrophobic drugs.[1] Solubility is
one of the important parameter to achieve desired concentration of drug in systemic
circulation for pharmacological response to be shown. Over the years, a variety of
solubilization techniques have been studied and widely used, and by many estimates up to 40
per cent of new chemical entities discovered by the pharmaceutical industry today are poorly
soluble or lipophilic compounds. The solubility issues complicating the delivery of these new
drugs also affect the delivery of many existing drugs. There are various techniques available
for enhancement of solubility. Solid dispersion is one of the most promising approaches for
solubility enhancement. The term solid dispersion refers to a group of solid products
consisting of at least two different components, generally a hydrophilic matrix and a
hydrophobic drug. The matrix can be either crystalline or amorphous.[2]
Glimepiride is the first, potent third generation oral hypoglycemic drug of sulfonyl urea class
and is used in management of type II diabetes. Chemically it is 3
ethyl-4-methyl-N-(4-(N-((1r,4r)-4 methyl cyclo hexyl carbamoyl sulfamoyl)phenethyl)-2-oxo-2,5-dihydro-1H
pyrrole-1-carboxamide.[3] Glimepiride suggested a number of potential benefits over other
sulfonyl ureas currently available including lower dosage, rapid onset, longer duration of
action and lower insulin c- peptide levels.[4] Glimepiride is practically insoluble in water; the
slow absorption rate of drug usually originates from either poor dissolution of drug from the
formulation or poor permeability of drug across GI membrane.[5]
MATERIALS AND METHODS Preparation of standard curve
100mg of glimepiride was accurately weighed and dissolved in 100ml of 0.1N NaOH (SS-I),
from this solution pipette out 10ml and added to another 100ml volumetric flask. The volume
www.wjpr.net Vol 4, Issue 09, 2015.
1110 aliquots of 0.2ml, 0.4ml, 0.6ml, 0.8ml, 1ml, 1.2ml, 1.4ml, 1.6ml, 1.8ml, 2ml were pipette into
10ml volumetric flasks and make up with 0.1N NaOH to get a concentration of 2, 4, 6, 8, 10,
12, 14, 16, 18 and 20 µg/ml respectively. The absorbance of each concentration was
measured at 228nm. The standard graph was drawn using the average values ten trails by
plotting absorbance versus concentration of glimepiride.
Composition of various solid dispersion of Glimepiride
Table 1: Composition of various solid dispersion of Glimepiride Drug to Carrier
Complex
Drug to Carrier ratio
Code for Complex Physical Mixture
GMP: β-CD 1:1 F1
GMP: β-CD 1:3 F2
GMP: β-CD 1:5 F3
GMP:PLX 188 1:1 F4
GMP:PLX 188 1:3 F5
GMP:PLX 188 1:5 F6
GMP: β-CD: PLX 188 1:1:1 F7
GMP: β-CD: PLX 188 1:2:2 F8
GMP: β-CD: PLX 188 1:3:3 F9
Solvent Evaporation
GMP: β-CD 1:1 F10
GMP: β-CD 1:3 F11
GMP: β-CD 1:5 F12
PLX 188 1:1 F13
PLX 188 1:3 F14
PLX 188 1:5 F15
GMP: β-CD: PLX 188 1:1:1 F16
GMP: β-CD PLX 188 1:2:2 F17
GMP: β-CD PLX 188 1:3:3 F18
Pure Drug F19
Phase solubility studies of pure drug
Phase solubility studies of pure drug (GMP) with different concentrations of β- cyclodextrins
(3-15 millimoles) and Poloxamer 188 were performed by the method described by Higuchi
and Connors. An excess of Glimepiride (200 mg) was added to 15ml of triple distilled water
containing various concentrations of carrier such as 0, 1, 3, 6, 9, 12, and 15 x 10-3moles/liter
taken in a series of 25ml stopped conical flask and the mixture was shaken for 72 hours at
room temperature on a rotary flask shaker. After 72 hrs of shaking to achieve equilibrium,
www.wjpr.net Vol 4, Issue 09, 2015.
1111 The filtered samples are diluted suitably and assayed for the drug GMP content by specific
UV method. Shaking is continued until the consecutive estimations are the same.
Preparation of Solid dispersion material[6] Physical mixture
A physical mixture was used for the preparation of solid dispersion. Three different drugs:
Carrier ratios (1:1, 1:3, 1:5) were used. F1 to F3 corresponds to preparations containing
β-Cyclodextrin, F4 to F6 correspond to preparations containing Poloxamer 188 and F7 to F9
correspond to preparation containing combination of β-Cyclodextrin and Poloxamer 188.
Accurately weighed quantity of drug and carrier mixed in a mortar for about 15min with
contant trituration. This mixture was then subsequently passed through mesh no. 40 and
stored in a dessicator for 48 h.
Solvent evaporation
The Solvent evaporation (SE) was used for the preparation of solid dispersion. Three
different drugs: Carrier ratios (1:1, 1:3, 1:5) were used. F10 to F12 corresponds to
preparations containing β-Cyclodextrin, F13 to F15 correspond to preparations containing
Poloxamer 188 and F16 to F18 correspond to preparation containing combination of
β-Cyclodextrin and Poloxamer 188. Glimepiride and carrier were triturated using a small
volume of ethyl alcohol to give a thick paste; Solvent was removed by evaporation under
reduced pressure. The dried mass was then pulverized, passed through mesh no. 80, stored in
a vacuum desiccator (48 h) packaging in an airtight container.
Evaluation of solid dispersion material Drug Content Estimation
50 mg of complex was accurately weighed and transferred to 50 ml of volumetric flask and
volume was made up to the mark with 0.1N NaoH. From this 1ml was taken in 10 ml
volumetric flask and the volume is adjusted up to the mark with same solution. The
absorbance of the solution was measured at 228 nm. The drug content of GMP was calculated
using calibration curve data.
Compatibility study using FT-IR
The IR spectrum of drug was recorded using Tensor 27, Bruker. The observations are shown
www.wjpr.net Vol 4, Issue 09, 2015.
1112 Formulation development of Glimepiride sustained release matrix tablets
Table 2: selected excipients for prototype formulation
Table 3: Selected excipients for preparation of coating solution
Table 4.1: Formulations containing various concentrations of excipients F1 to F9
Table 4.2: Formulations containing various concentrations of excipients F10 to F19
Sl.no Excipient Function
1 Lactose monohydrate Filler
2 Hydroxy propylmethyl
cellulose Binder
3 Ethyl alcohol Dry granulating agent
4 Talc Glidant
5 Magnesium stearate Lubricant
Sl. No Excipient Function
1 Ethyl Cellulose Coating polymer
2 Acetone Solvent
3 Isopropyl alcohol Solvent
Formulation code Drug+ carrier ratio(mg) Lactose monohydrate (mg) HPMC (mg) Ethyl Cellulose (6%) Magnesium stearate (mg) Talc (mg) Total weight of tablet(mg)
F1 4 128 5 9 2 2 150
F2 8 124 5 9 2 2 150
F3 12 120 5 9 2 2 150
F4 4 128 5 9 2 2 150
F5 8 124 5 9 2 2 150
F6 12 120 5 9 2 2 150
F7 6 126 5 9 2 2 150
F8 10 122 5 9 2 2 150
F9 14 118 5 9 2 2 150
Formulation code Drug+carrier ratio(mg) Lactose monohydrate(mg) HPMC (mg) Ethyl Cellulose (6%) Magnesium stearate (mg) Talc (mg) Total weight of tablet(mg)
F10 4 128 5 9 2 2 150
F11 8 124 5 9 2 2 150
F12 12 120 5 9 2 2 150
F13 4 128 5 9 2 2 150
F14 8 124 5 9 2 2 150
F15 12 120 5 9 2 2 150
F16 6 126 5 9 2 2 150
F17 10 122 5 9 2 2 150
F18 14 118 5 9 2 2 150
www.wjpr.net Vol 4, Issue 09, 2015.
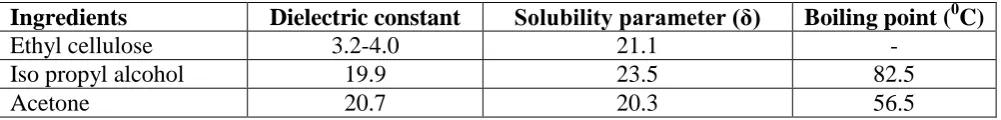
1113 Preparation of Ethyl cellulose Coating Solution[7,8]
2.5 gms of ethyl cellulose (ETHOCEL) was dissolved in acetone: isopropyl alcohol (65:35).
Polymer - solvent interactions are assumed to be at a maximum when the solubility parameter
of the polymer and solvent are equal. Solubility parameters calculated for the solvent
[image:6.595.67.568.209.269.2]combinations acetone: IPA.
Table no 5: Selected Physical Properties of EC and Solvents used in this Study
Ingredients Dielectric constant Solubility parameter (δ) Boiling point (0C)
Ethyl cellulose 3.2-4.0 21.1 -
Iso propyl alcohol 19.9 23.5 82.5
Acetone 20.7 20.3 56.5
Preparation of Sustained Release Matrix Granules
The granules are prepared by using dry granulation technique. Different batches of granules
(F1 to F19) were prepared according to the composition mentioned in Table. Accurately
weighed quantities of each component were mixed in a mortar. The powder mix was wetted
with ethyl alcohol. The granules obtained after passing through sieve (16 mesh size) were
then dried adequately at 45°C for 15–20 min. The dried granules were sifted manually
through 16 mesh screen. The matrix granules in particle size range of 14–20 mesh had been
selected. These batches of granules were put under physical characterization and drug release
study.
Coating of Sustained Release Matrix Granules
The granules F1 to F19 exhibited sustained release up to 12 hrs. Matrix granules (14-20 mesh
size) were coated stepwise in a conventional coating pan. Granules were spray coated with an
ethyl cellulose coating solution to form intermediate layer. This layer makes 3–6% weight
gain to the initial granules to prevent any incompatibility between drug and carrier.
Evaluation of Glimepiride matrix tablets
The matrix tablets prepared were evaluated for the following parameters:
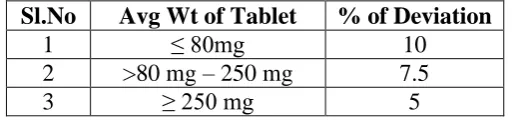
Weight Variation Test
To study weight variation, 20 tablets of each formulation were weighed using an electronic
www.wjpr.net Vol 4, Issue 09, 2015.
[image:7.595.170.429.110.170.2]1114 Table 6: IP standards of Uniformity of weight
Hardness and Friability
For each formulation, the hardness and friability of 6 tablets were determined using the
Monsanto hardness tester (Cadmach, Ahmedabad, India) and the Roche friabilator (Campbell
Electronics, Mumbai, India) respectively.
Drug Content
Ten tablets were weighed and average weight is calculated. All tablets were crushed and
powder. 50 mg of powder was accurately weighed and transferred to 50 ml of volumetric
flask and volume was made up to the mark with 0.1N NaOH. From this 1ml was taken in 10
ml volumetric flask and the volume is adjusted up to the mark with same solution. The
absorbance of the solution was measured at 228 nm. The drug content of GMP was calculated
using calibration curve data.
In-vitro dissolution studies
The in-vitro dissolution studies were performed using the USP-II (Paddle) dissolution
apparatus at 50 rpm in a 900ml of 0.1N NaoH as a dissolution medium. Medium is
maintained at 37±0.50C. At every 1 hour samples of 5ml were withdrawn from the
dissolution medium and replaced with fresh medium to maintain the volume constant and
maintain sink conditions. After filtration and appropriate dilution, the sample solution were
analyzed at 228nm by using double beam U.V-Visible spectrophotometer
(SHIMADZU-1700) and dissolution medium as blank. Experiments were performed in triplicates. The
amount of drug present in the samples was calculated with the help of calibration curve
constructed from standard.
Kinetic Analysis of In-Vitro release rates of Glimepiride matrix tablets
The results of in-vitro release profile obtained for all the formulations were plotted in modes
of data treatment as follows:-
Sl.No Avg Wt of Tablet % of Deviation
1 ≤ 80mg 10
2 >80 mg – 250 mg 7.5
www.wjpr.net Vol 4, Issue 09, 2015.
1115 1. Zero- order Kinetic model – Cumulative % drug released versus Time.
2. First- order Kinetic model – Log cumulative % drug remaining versus Time.
3. Higuchi’s model- Cumulative percent drug released versus square root of time.
4. Korsmeyer equation / Peppa’s model- Log cumulative percent drug released versus log
time.
Stability Studies[9]
The optimized formulation was subjected for two month stability study according to ICH
guidelines. The selected formulations were packed in aluminium foils, which were in wide
mouth bottles closed tightly. They were then stored at 25ºC / 60% RH, 30ºC / 65% RH, 40ºC
/ 75% RH for 2 months and evaluated for their permeation study.
RESULTS AND DISCUSSION
Calibration Curve of Glimepiride in 0.1N NaOH
The absorbance was measured in a UV spectrophotometer at 228 nm against 0.1N NaOH.
[image:8.595.137.498.404.572.2]The absorbance’s so obtained and graph was plotted and shown in the Figure no.1
Fig no 1: Calibration Curve of Glimepiride in 0.1 N NaOH Compatibility study using FT-IR
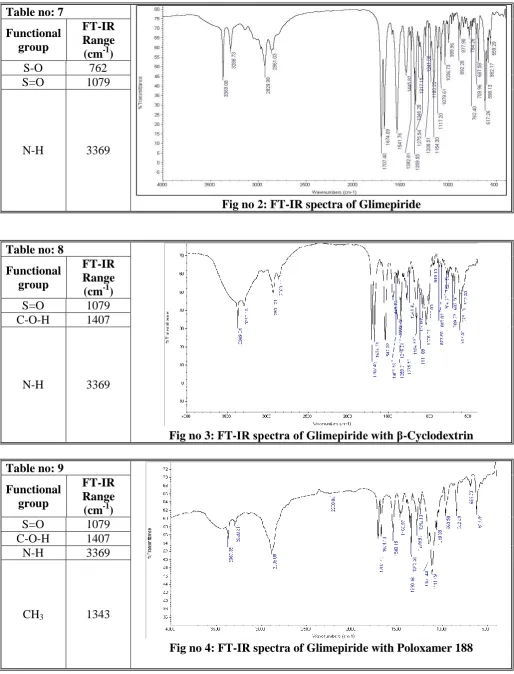
Samples were prepared in KBr disks by means of a hydrostatic press at 6-8 tons pressure.
Drug and polymers were identified and conformed from the peak values by performing
FT-IR studies.
FT-IR spectra of pure drug and with the excipients are identical and do not show any
www.wjpr.net Vol 4, Issue 09, 2015.
[image:9.595.41.556.80.754.2] [image:9.595.42.560.81.291.2]1116 Table no: 7
Fig no 2: FT-IR spectra of Glimepiride Functional
group
FT-IR Range (cm-1)
S-O 762
S=O 1079
N-H 3369
Table no: 8
Fig no 3: FT-IR spectra of Glimepiride with β-Cyclodextrin Functional
group
FT-IR Range (cm-1)
S=O 1079
C-O-H 1407
N-H 3369
Table no: 9
Fig no 4: FT-IR spectra of Glimepiride with Poloxamer 188 Functional
group
FT-IR Range (cm-1)
S=O 1079
C-O-H 1407
N-H 3369
www.wjpr.net Vol 4, Issue 09, 2015.
1117 Phase solubility Studies
Phase Solubility Studies of glimepiride : β-Cyclodextrin Complexes has shown that increase in the concentration of β-Cyclodextrin increases the solubility of glimepiride. Phase Solubility Studies of glimepiride : Poloxamer 188 Complexes has shown that
[image:10.595.43.557.49.250.2]increase in the concentration of Poloxamer 188 increases the solubility of glimepiride.
Table no 11: Phase Solubility Studies of glimepiride: β-Cyclodextrin complexes
Fig no 6: Effect of β-CD on Solubility of Glimepiride Table no: 10
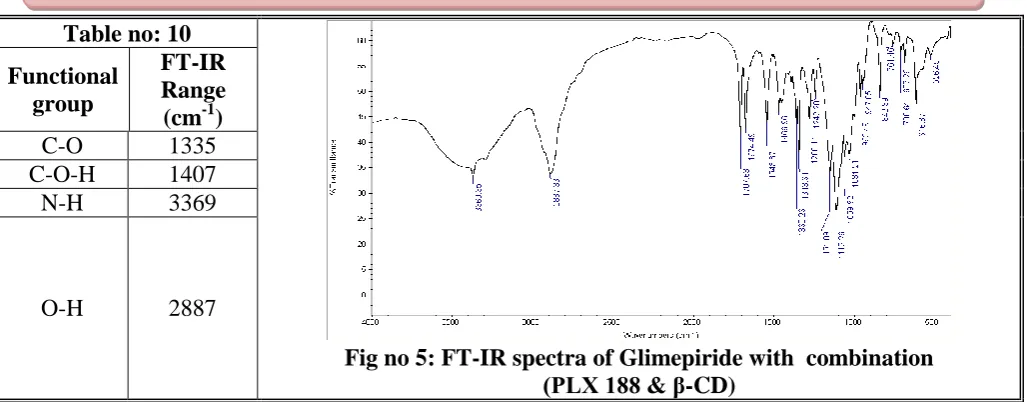
Fig no 5: FT-IR spectra of Glimepiride with combination (PLX 188 & β-CD)
Functional group
FT-IR Range (cm-1)
C-O 1335
C-O-H 1407
N-H 3369
O-H 2887
Sr.no Conc. of : β-CD (mM) Conc. of GMP
1 0 0.040
2 3 0.043
3 6 0.047
4 9 0.051
5 12 0.055
[image:10.595.127.469.406.722.2]www.wjpr.net Vol 4, Issue 09, 2015.
[image:11.595.126.473.90.411.2]1118 Table no 12: Phase Solubility Studies of glimepiride: Poloxamer 188 Complexes
Fig no 7: Effect of PLX 188 on Solubility of Glimepiride Drug Content Estimation
The complexes prepared by Solvent Evaporation method showed nearly 99.77 % (β-CD),
98.82 % (PLX 188) and 98.61% (Combination) drug content was observed. But the
complexes prepared by physical mixture method were found to be slightly less shown in
figure.
Fig no 8: Drug Content Estimation of F1 to F18 Sl.no Conc. of : PLX 188 (mM) Conc. of GMP
1 0 0.040
2 3 0.042
3 6 0.045
4 9 0.048
5 12 0.050
www.wjpr.net Vol 4, Issue 09, 2015.
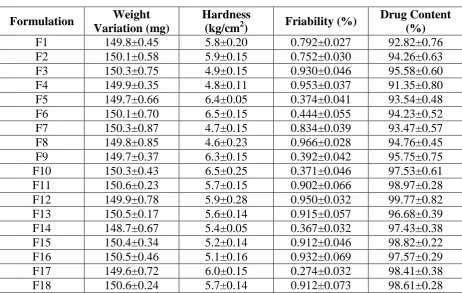
[image:12.595.66.529.86.379.2]1119 Table no 13: Post Compression Evaluation Parameters of F1 to F19
Formulation Weight
Variation (mg)
Hardness
(kg/cm2) Friability (%)
Drug Content (%)
F1 149.8±0.45 5.8±0.20 0.792±0.027 92.82±0.76
F2 150.1±0.58 5.9±0.15 0.752±0.030 94.26±0.63
F3 150.3±0.75 4.9±0.15 0.930±0.046 95.58±0.60
F4 149.9±0.35 4.8±0.11 0.953±0.037 91.35±0.80
F5 149.7±0.66 6.4±0.05 0.374±0.041 93.54±0.48
F6 150.1±0.70 6.5±0.15 0.444±0.055 94.23±0.52
F7 150.3±0.87 4.7±0.15 0.834±0.039 93.47±0.57
F8 149.8±0.85 4.6±0.23 0.966±0.028 94.76±0.45
F9 149.7±0.37 6.3±0.15 0.392±0.042 95.75±0.75
F10 150.3±0.43 6.5±0.25 0.371±0.046 97.53±0.61
F11 150.6±0.23 5.7±0.15 0.902±0.066 98.97±0.28
F12 149.9±0.78 5.9±0.28 0.950±0.032 99.77±0.82
F13 150.5±0.17 5.6±0.14 0.915±0.057 96.68±0.39
F14 148.7±0.67 5.4±0.05 0.367±0.032 97.43±0.38
F15 150.4±0.34 5.2±0.14 0.912±0.046 98.82±0.22
F16 150.5±0.46 5.1±0.16 0.932±0.069 97.57±0.29
F17 149.6±0.72 6.0±0.15 0.274±0.032 98.41±0.38
[image:12.595.56.540.412.628.2]F18 150.6±0.24 5.7±0.14 0.912±0.073 98.61±0.28
Table no 14: In-vitro drug release profiles of Formulation F1 to F9 Time
(hrs) F1 F2 F3 F4 F5 F6 F7 F8 F9
0 0 0 0 0 0 0 0 0 0
1 16.2 11.7 15.3 18.9 12.6 15.3 16.2 18 15.3
2 17.91 20.765 25.915 22.065 20.77 21.685 22.59 24.4 23.485
3 19.899 26.28 29.9285 25.877 25.385 28.105 28.115 29.935 29.915
4 20.2785 32.725 36.4835 30.0695 30.025 34.56 34.57 33.34 36.38
5 25.2495 36.505 40.194 37.4345 38.29 36.46 39.26 36.583 44.68
6 30.5175 44.805 46.894 44.8395 43.9 41.5195 45.775 43.713 50.325
7 45.624 51.35 52.37 48.2345 48.64 51.916 50.525 55.0215 59.6
8 50.4635 56.13 66.155 51.647 54.305 63.359 55.3 60.2715 65.325
9 56.3185 61.835 69.575 61.827 60 65.414 59.2 65.189 70.18
10 63.1945 66.67 74.182 66.752 64.825 68.5585 65.91 71.212 74.16
11 67.947 70.63 75.4825 69.0925 69.675 74.3285 72.4755 75.3765 79.06
12 71.284 73.98 78.948 72.704 73.65 77.2485 75.7455 79.292 83.085
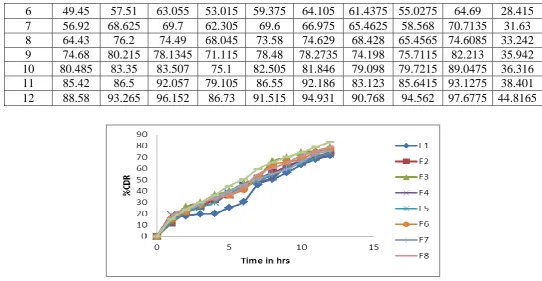
Table no 15: In-vitro drug release profiles of Formulation F1 to F9
Time F10 F11 F12 F13 F14 F15 F16 F17 F18 F19
0 0 0 0 0 0 0 0 0 0 0
1 16.2 12.6 18.9 12.6 15.3 23.4 29.7 17.1 17.1 9.99
2 25.29 20.77 26.205 18.07 24.385 30.73 33.015 26.195 28.895 14.4555
3 32.63 25.385 34.45 26.27 33.52 38.1 43.5475 34.44 37.155 19.0355
4 36.41 35.425 42.74 43.515 40.905 51.81 48.2875 41.83 51.76 22.7405
www.wjpr.net Vol 4, Issue 09, 2015.
1120
6 49.45 57.51 63.055 53.015 59.375 64.105 61.4375 55.0275 64.69 28.415
7 56.92 68.625 69.7 62.305 69.6 66.975 65.4625 58.568 70.7135 31.63
8 64.43 76.2 74.49 68.045 73.58 74.629 68.428 65.4565 74.6085 33.242
9 74.68 80.215 78.1345 71.115 78.48 78.2735 74.198 75.7115 82.213 35.942
10 80.485 83.35 83.507 75.1 82.505 81.846 79.098 79.7215 89.0475 36.316
11 85.42 86.5 92.057 79.105 86.55 92.186 83.123 85.6415 93.1275 38.401
[image:13.595.24.567.69.350.2]12 88.58 93.265 96.152 86.73 91.515 94.931 90.768 94.562 97.6775 44.8165
[image:13.595.128.469.379.532.2]Fig no 9: Cumulative percentage release Vs Time profile of formulations F1 to F9
Fig no 10: Cumulative percentage release Vs Time profile of formulations F10 to F18
[image:13.595.122.479.556.729.2]www.wjpr.net Vol 4, Issue 09, 2015.
1121 Release Kinetics
All the formulations show linearity with respect to zero order and first order kinetics.
Table no 16: Mathematical modelling and drug release kinetics of formulation F1 to F19
FORMULATION CODE
KINETIC MODELS Zero
order
First
order Higuchi Hixson Korsmeyer-pappas
R2 R2 R2 R2 n R2
F1 0.9565 0.9350 0.8912 0.9647 0.6893 0.8508
F2 0.9920 0.9625 0.9526 0.9448 0.7457 0.9974
F3 0.9797 0.9727 0.9732 0.9495 0.6725 0.9857
F4 0.9902 0.9573 0.9608 0.9812 0.6012 0.9501
F5 0.9961 0.9868 0.9866 0.9584 0.720 0.9952
F6 0.9837 0.9713 0.9670 0.9627 0.6855 0.9794
F7 0.9978 0.9746 0.9829 0.971 0.6372 0.9911
F8 0.9899 0.9673 0.9623 0.9783 0.6290 0.9658
F9 0.9892 0.9857 0.9905 0.948 0.7061 0.9958
F10 0.9943 0.9437 0.9734 0.9706 0.6994 0.9888
F11 0.9657 0.9623 0.9786 0.9145 0.8589 0.982
F12 0.9853 0.9013 0.9675 0.9276 0.6901 0.991
F13 0.9675 0.9756 0.9871 0.9012 0.8151 0.9806
F14 0.9749 0.9709 0.9853 0.9276 0.7463 0.9922
F15 0.9804 0.9068 0.9904 0.9379 0.5856 0.9895
F16 0.9912 0.9317 0.984 0.9685 0.4696 0.9732
F17 0.9937 0.8713 0.9839 0.956 0.6808 0.9961
F18 0.9749 0.8904 0.9966 0.9085 0.7006 0.9941
F19 0.9665 0.9749 0.9859 0.9164 0.5824 0.9933
Stability studies
The best formulations F12, F15 and F18 were subjected to stability studies at room
temperature and 45 RH for 2 months. Then the tablets were analyzed for physical change,
drug content estimation and in-vitro dissolution studies at an interval of 15 days. Results
show that after analyzing there was no change in case of physical appearance, no significant
differences in the drug content and dissolution study.
Bibliography
1. Dhirendra K, Lewis S, Udupa N and Atin K. Solid Dispersions: A Review. Pak J Pharm
Sci., 2009; 22(2): 234-46.
www.wjpr.net Vol 4, Issue 09, 2015.
1122 3. Prameela RA, Siva TP, Archana N, Bala SC. Phase Solubility Studies on Oral Antibiotic
Drugs with β-Cyclodextrin and HP-β Cyclodextrin. International Journal of Pharm Tech
Research., 2009; 1(4): 1632-37.
4. Abd-elgawad MR, Shimaa HE. Electrochemical study of glimepiride and its
complexation with β-cyclodextrin. Collect. Czech. Chem. Commun., 2011; 76(1): 13-25.
5. Baliar Singh OP, Biswal S, Sahoo J, Murthy PN. Physicochemical Properties of
Glimepiride in Solid Dispersions with Polyethylene Glycol 20000. International Journal
of Pharmaceutical Sciences and Nanotechnology., 2009; 2(2): 537-43.
6. Sanjoy Kumar D, Sudipta Roy,Yuvaraja Kalimuthu, Jasmina K, Arunabha Nanda. Solid
Dispersions: An Approach to Enhance the Bioavailability of Poorly Water-Soluble Drugs.
International Journal of Pharmacology and Pharmaceutical Technology., 2010; 1(1):
37-46.
7. http://www.colorcon.com/literature/marketing/mr/Extended%20Release/Surelease/Englis
h/ads influ coat sys type.pdf.
8. Golam Kibria and Reza-ul Jalil. In- vitro Release Kinetics Study of Diltiazem
Hydrochloride from Pellets using an Ethylcellulose Pseudolatex Coating System. Dhaka
Univ J Pharm Sci., 2007; 6(2): 87-92.
9. ICH Q1A (R2) Stability testing guidelines: Stability Testing of new drug substances and
products.[online]. [Cited 2008 Nov 10]; Available from: