The Role of Trait Reversal in Evolutionary
1Diversification: A Test Using Song Loss in
2Wild Crickets
34
Nathan W. Baileya,1,2, Sonia Pascoalb,1, Fernando Montealegre-Zc,2
5
6
a School of Biology, University of St Andrews, St Andrews KY16 9TH, UK 7
b Department of Zoology, University of Cambridge, Cambridge CB2 3EJ, UK 8
c School of Life Sciences, University of Lincoln, Lincoln LN6 7DL, UK 9
1 N.W.B. and S.P. contributed equally to this work. 10
2 To whom correspondence may be addressed. 11
E-mail: [email protected], [email protected]
Abstract
13The mechanisms underlying rapid macroevolution are controversial. One largely 14
untested hypothesis that could inform this debate is that evolutionary reversals might 15
release variation in vestigial traits, which then facilitate subsequent diversification. 16
We evaluated this idea by testing key predictions about vestigial traits arising from 17
sexual trait reversal in wild field crickets. In Hawaiian Teleogryllus oceanicus, the 18
recent genetic loss of sound producing and amplifying structures on male wings 19
eliminates their acoustic signals. Silence protects these ‘flatwing’ males from an 20
acoustically orienting parasitoid and appears to have evolved independently more 21
than once. Here we report that flatwing males show enhanced variation in vestigial 22
resonator morphology under varied genetic backgrounds. Using laser Doppler 23
vibrometry, we found that these vestigial sound-producing wing features resonate at 24
highly variable acoustic frequencies well outside the normal range for this species. 25
These results satisfy two important criteria for a mechanism driving rapid 26
evolutionary diversification: sexual signal loss was accompanied by a release of 27
vestigial morphological variants, and these could facilitate the rapid evolution of 28
novel signal values. Widespread secondary trait losses have been inferred from fossil 29
and phylogenetic evidence across numerous taxa, and our results suggest that such 30
reversals could play a role in shaping historical patterns of diversification. 31
32
acoustic communication | diversification | evolutionary rate | field cricket | sexual signal | trait loss
Significance
34Bursts of rapid evolutionary diversification are widely observed, but their underlying causes
35
are controversial. We tested whether secondary loss of sexual traits could play a role in
36
rapid diversification, by releasing variation in vestigial signalling structures which then
37
facilitates the rapid evolution of novel signal values. We found evidence to support such an
38
evolutionary model in the field cricket Teleogryllus oceanicus, which has recently lost the
39
ability to sing. Trait reversals are widespread, and may play an underappreciated role in
40
determining the pattern and rate of macroevolutionary change.
41
\body
Introduction
43One of the most contentious debates to have arisen in evolutionary biology centres on the rate
44
at which diversification proceeds (1). In particular, the mechanisms responsible for driving
45
rapid bursts of macroevolution remain unresolved despite decades of study (2-4). Here we
46
evaluate an overlooked mechanism that could cause rapid diversification: the release of
47
cryptic variation following secondary loss of a mate recognition signal, which exposes a
48
widened range of vestigial signalling structures to the action of selection. If novel or variable
49
signal values subsequently evolve, they could play a key role in speciation.
50
Secondary trait losses are common (5) and in several studies have been suggested to
51
precede diversification, for example in stick insects and in plethodontid salamanders (6, 7).
52
Loci involved in functional traits important for diversification, such as spectral tuning of the
53
visual system in cichlids, are known to be evolutionarily labile (8), and when such traits are
54
lost, functionless vestigial structures or behaviours are left behind which could facilitate the
55
re-evolution of new functions or trait values (2, 9-11). Sexual traits involved in mate
56
recognition systems are particularly prone to reversal (12). Their reduction under pressure
57
from countervailing natural selection is a central prediction of sexual selection theory (13,
58
14), and widespread sexual trait losses have been inferred phylogenetically (12). Acoustic
59
signals play a prominent role in speciation, communication and many animal behaviours.
60
Here we tested how their evolutionary reversal might predispose populations to
61
diversification using a field cricket system in which the sexually-selected male acoustic
62
signal has been recently, and abruptly, lost from multiple wild populations (15, 16).
63
Male crickets produce calls by stridulating: they rub modified forewings together to
64
generate mechanical vibrations (Fig. 1A). An individual producing an advertisement,
65
courtship, or aggressive song will draw a thickened ridge of tissue (the scraper) on one wing
66
across a corrugated vein (the file) on the opposing wing. In many species, the resulting
67
vibrations are amplified by resonating membranes formed from modified wing cells. When
68
coupled with wing motor behaviours that repeat this movement in succession, the pulse rate,
69
pattern, and carrier frequency of chirps can convey information about mate location, identity,
70
quality, or aggressiveness. We studied the widely-distributed Austro-Pacific cricket
71
Teleogryllus oceanicus. Hawaiian populations of this species overlap with an
acoustically-72
orienting endoparasitoid fly (Ormia ochracea) which responds to male songs and infests
73
them with destructive larvae. A mutation(s) showing Mendelian segregation on the X
chromosome appeared in a population on the island of Kauai approximately two decades ago,
75
and it silences males by erasing or dramatically reducing the stridulatory apparatus and sound
76
resonators on their forewings (15). Females have undifferentiated wings and do not sing.
77
Males carrying the flatwing genotype develop wings resembling those of females, so are
78
referred to as ‘flatwing males’ (Fig. 1B). Flatwing males are protected against parasitoid
79
infestation (15), and the flatwing phenotype rapidly spread and now appears on more than
80
one Hawaiian island (16, 17). In all cases investigated, flatwing segregates as a single-locus
81
trait on the X (16, 18), but the degree to which affected male wings are feminised varies
82
noticeably between islands, and several lines of evidence suggest that independent flatwing
83
mutations have arisen convergently (16). On Kauai, flatwing male wings tend to be almost
84
completely feminised and lack identifiable resonators characteristic of grylline species,
85
whereas flatwing males from the neighbouring island of Oahu retain approximately one third
86
to one half of their harp and often possess a scraper (Fig. 1B) (16).
87
Research examining acoustic signal function and diversity in ensiferan singing insects
88
(crickets and katydids) has mostly focused on the behavioural components of song, i.e. the
89
pattern of sound pulses produced during wing movement (19, 20). However, a major source
90
of variation in acoustic signals is their carrier frequency, which is increasingly recognised as
91
an important signal feature distinguishing closely-related species (21, 22). Frequency is
92
primarily determined by the morphology of sound resonating structures (23, 24), and in some
93
species can be varied by mechanically shifting between different resonant modes (25-27).
94
Resonator morphology most likely evolved from the modification and specialisation of
95
structural wing venation (28-30), subsequently elaborated and diversified through
96
coevolution with receivers (31). Fig. 1C illustrates the diversity of wing resonators across
97
taxa: morphological variation over macroevolutionary timescales shows suggestive parallels
98
to the morphological variation observed among the wings of flatwing T. oceanicus males
99
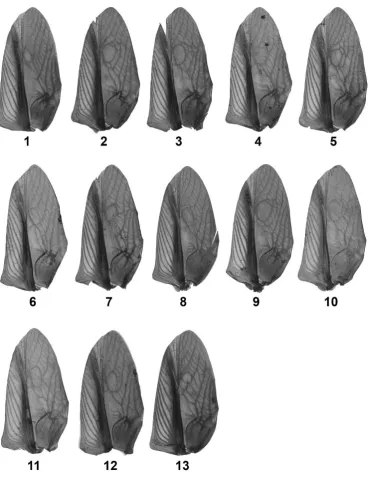
from different Hawaiian islands. We took advantage of the recent, repeated loss of signalling
100
in T. oceanicus to examine whether secondary signal loss can generate variation in
101
morphological signal components that recapitulates this deeper macroevolutionary variation.
102
Our study addressed two objectives focused on the early stages of such a process. The
103
apparently different underlying genetic causes of the loss-of-function flatwing phenotype,
104
coupled with the incomplete erasure of resonating structures in some populations, allowed us
105
first to identify and measure the variability of vestigial structures remaining on flatwing
106
males’ wings. We specifically evaluated whether background genetics could lead to
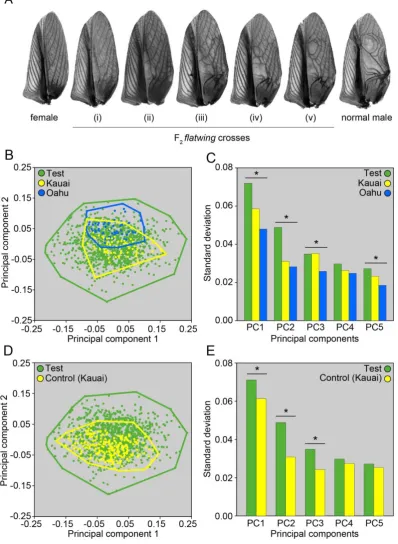
expression of decanalized variation following trait loss (32). Our results indicated that trait
108
loss is associated with the predicted increase in variation of vestigial acoustic resonators, so
109
we next used laser Doppler vibrometry (LDV) to characterise acoustic resonances of these
110
new wing areas and assess their potential to influence the evolution of new signal values.
111
112
Results
113Despite possessing wings that lack functional sound-producing structures, flatwing males still
114
produce the motor patterns associated with song: they elevate their forewings and silently
115
move them in a precise pattern characteristic of male sexual advertisement song (11). The
116
persistence of what appear to be partially-formed resonating structures (hereafter referred to
117
as ‘vestigial resonators’) on flatwing males’ forewings, coupled with the persistence of wing
118
motor behaviour associated with song, is consistent with the idea that trait loss could
119
potentiate the evolution of novel signal variants. The only requirement for the evolutionary
120
origin of a new or re-evolved signal is invasion of a genotype that re-engages the residual file
121
and scraper mechanism currently expressed in a reduced, functionless state in some flatwing
122
males (Fig. 1B). Developmental constraints could influence signal evolution following such a
123
reversal, but the existence of sister Teleogryllus species with different male carrier
124
frequencies (21) suggests that such constraints would not necessarily cause re-evolution of
125
the exact original configuration of resonating structures. The existence of wide variation in
126
song carrier frequency and wing venation suggests that such constraints are either weak, or
127
have been broken repeatedly during the evolutionary history of many ensiferan taxa (33).
128
To test whether variability in flatwing vestigial resonator morphology has been
129
released following loss of male-typical wing structures, we performed a series of crosses with
130
crickets known to carry flatwing genotypes derived from either Kauai or Oahu. We tested
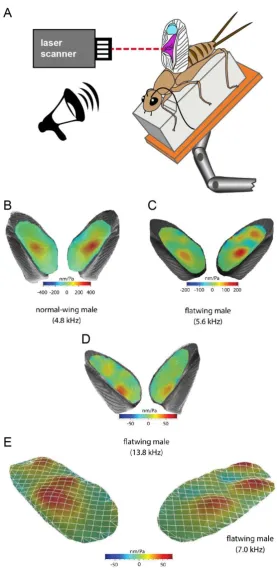
131
whether we could recover rare normal-wing recombinants in a complementation-like assay,
132
whether the genetic background of different populations affected expression of vestigial wing
133
structures, and whether family-level variation was detectable for flatwing morphology. The
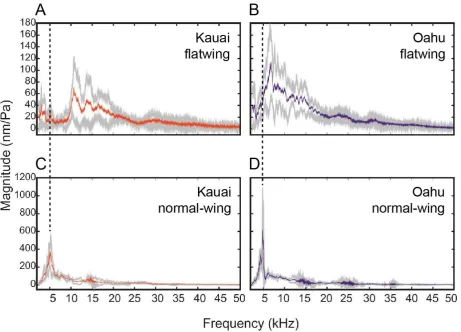
134
crossing design allowed us to examine two genetic scenarios. Under the first, background
135
effects are minimal and variation following trait loss is mainly caused by the expression of
136
independent loss-of-function flatwing mutations (Fig. 2A). Under the second, background
137
effects play a more significant role in generating variability among flatwing crickets (Fig.
138
2B).
Sex determination is female homogametic (XX/XO) in T. oceanicus, and in both
140
populations used, the flatwing phenotype segregates as a single-locus trait on the X
141
chromosome (16). Using pure-breeding Kauai lines and Oahu flatwing males, two
142
generations of crosses were performed to introduce flatwing-carrying X chromosomes from
143
Kauai and Oahu populations (fwKand fwO, respectively) into the same female to allow
144
potential recombination on the X (“test” condition). Simultaneously, the same crossing
145
design using only Kauai genotypes was undertaken separately (“control” condition). We
146
performed visual assessments for the presence or absence of scrapers and mirrors, and used
147
landmark-based geometric morphometrics and multivariate analyses to quantify variation in
148
wing venation among the test and control crickets (Fig. 2C).
149
A total of 1,067 F2 test crickets and 245 F2 Kauai control crickets were scored. Visual
150
classification of scraper and mirror presence revealed that 63.7% (n = 680) of test crickets
151
possessed a residual scraper, 1.2% (n = 13) possessed a definable, partial mirror, and a further
152
4.5 % (n = 48) possessed incomplete mirror-like structures (e.g. enlarged but not completely
153
enclosed wing cells). Examples of the range of flatwing phenotypes recovered are provided in
154
Fig. 3A. Among Kauai control crickets, 32.2% (n = 79) possessed a vestigial scraper, and one
155
(0.4%) possessed a partial mirror. We validated our visual scoring system by assigning a
156
randomly-selected subset of 100 wings to a sample-blind scorer, and proportions carrying
157
scrapers were consistent with the original dataset for both control crickets (Fisher Exact Test:
158
p = 1.00) and test crickets (Chi-square test with Yates’ correction: χ2 = 0.30, p = 0.584).
159
Across all 100 validation samples, concordance between scorers was 96% for the presence or
160
absence of scrapers, and 100% for mirrors.
161
We recovered no obvious recombinant, i.e. normal-wing, phenotypes, though among
162
the test crickets, the 13 males possessing partial mirrors were classified as nearly-normal.
163
These nearly-normal forewings possessed partial to complete scrapers, reduced but clearly
164
distinguishable mirror membranes bounded by thickened venation, and a distinctive harp that
165
extended significantly across the wing, but did not fully reach the distal wing margin as
166
occurs in normal-wing males. An example is given in Fig. 3A, and photographs of all 13 are
167
provided in SI Appendix, Fig. S1. This suggests that any mutation(s) independently
168
controlling the expression of flatwing phenotypes may be too closely linked on the X
169
chromosome, or contained within a non-recombining region, to allow double recombinants to
170
arise readily. However, the surprising level of morphological variation recovered from these
crosses suggests that background or modifier effects are superimposed upon the effects of
172
flatwing itself.
173
Consistent with the idea that trait loss leads to the expression of uncanalised or cryptic
174
variation, the forewings of F2 flatwing males from the complementation test showed greater
175
variation than those previously reported from Kauai and Oahu laboratory populations and
176
measured using the same methods by the same scorer (S.P.) (16). The range of phenotypic
177
variation among F2 males fully encompassed that of both island types (Fig. 3B). Forewing
178
morphology differed among the three groups of flatwing males (MANOVA: Wilks’ λ =
179
0.786, F10,2418 = 30.95, p < 0.001), and pairwise post-hoc tests between groups for each
180
principal component describing landmark-based wing morphology (with eigenvalue > 1)
181
revealed that this was largely driven by Oahu, which was involved in 12 out of 16 significant
182
post-hoc comparisons (SI Appendix,Table S2). Crucially, the amount of variation in wing
183
venation differed among groups, and was largest for test crickets for 4 of the 5 principal
184
components analysed (Fig. 3C and Table 1).
185
To exclude the possibility that minor variation in the genetic composition of lab
186
stocks or methodology between this and the previous study could have influenced the
187
differences we observed between test flatwings and Kauai and Oahu flatwings, we performed
188
a separate analysis of Kauai control flatwings which were simultaneously produced using the
189
same crossing protocol, contrasted with the same set of test flatwings. This analysis revealed
190
patterns of variation in flatwing venation consistent with the previous result. A separate
191
principal components analysis (PCA) showed that phenotypic variation of test crickets’ wing
192
venation exceeded that of the controls, again fully encompassing it (Fig. 3D). Flatwing
193
venation was significantly different between the two groups (MANOVA: Wilks’ λ = 0.849,
194
F5,1306 = 46.59, p < 0.001). Also as before, morphological variation was greater for test than
195
control crickets in all 5 principal components analysed, and significantly so for the first three
196
(Fig. 3E and Table 1). As a final analysis of the potential for background effects to interact
197
with the flatwing genotype, we examined family-level variation among the test crickets.
198
Significant family-level variation in wing shape among F2 flatwing males in the
199
complementation test provided confirmation of our interpretation of genetic background
200
effects superimposed on different flatwing genotypes (MANOVA: Wilks’ λ = 0.763, F20,3510 =
201
14.89, p < 0.001) (SI Appendix,Fig. S2).
Pre-existing morphological traits that permit the evolution of new signal variants are
203
difficult to identify and characterise, and reconstructing the sequence of evolutionary events
204
that coupled behavioural and morphological components of signals in ancestral lineages
205
represents a major challenge. Characterising ancestral behaviours is in many cases impossible
206
(though see (10)), and often the critical morphological structures involved in sound
207
production are comprised of soft tissue that does not persist in the fossil record (though see
208
(34)). Most work on signal macroevolution has therefore relied on comparative analyses
209
across extant taxa (35-38). An alternative approach is to predict and characterise signal values
210
on the basis of relevant morphological features, before the signalling traits themselves evolve.
211
To test whether vestigial harp and mirror structures that we identified on the surface of
212
flatwing crickets are a) capable of producing acoustic resonances, b) likely to produce a more
213
varied range of signal values than the typical 4-5 kHz carrier frequency produced by this
214
species, and c) to characterise these acoustic resonances, we performed a second experiment
215
using micro-scanning LDV (Fig. 4A). Adult flatwing male crickets were selected from three
216
pure-breeding Kauai flatwing lines and four pure-breeding Oahu lines that had been
217
subsequently produced (see Methods). For comparison, we also selected adult normal-wing
218
males from two lines from each island. The objective was to achieve a breadth of sampling
219
across different, naturally-occurring flatwing backgrounds, rather than a design balanced
220
across morph types. After a pilot experiment to assess the feasibility of the approach, we
221
successfully recorded data from 16 male cricket wings.
222
Analysis of wing resonances revealed acoustic resonators on flatwing males’
223
forewings, and Fig. 4 provides examples. Our main analysis focused on the harp area of the
224
wing as it is a key determinant of the carrier frequency of male song in ensiferan insects (22).
225
Table 2 reports the peak resonance of the harp (or vestigial harp) for each measured
226
individual. We confirmed that normal-wing males produced acoustic resonances
227
characteristic of this species between ca. 4.5-5.5 kHz. In contrast, flatwing males produced a
228
large range of peak resonant frequencies that almost exclusively did not overlap with
normal-229
wing males (Fig. 5). Peak resonance frequencies differed between Kauai and Oahu flatwing
230
crickets, with a higher average peak frequency in the former (left forewings: t = 7.10, p <
231
0.001; right forewings: t = 2.88, P = 0.016) (Figs. 5A, B). Animations of wing resonances for
232
exemplar flatwing and normal-wing males are provided in the SI Appendix (Movies S1-S3).
233
Discussion
235Sexual signals play a major role in speciation (20, 39, 40), so any factor that increases the
236
likelihood of new signal values evolving is likely to have an impact on the rate of
237
macroevolutionary diversification (41, 42). The morphological and functional outcomes of
238
evolved silence in field crickets support our predictions about the role of trait loss in rapid
239
diversification. We found that secondary loss of male song in Hawaiian T. oceanicus is
240
associated with substantial variation in vestigial morphological traits, susceptible to genomic
241
background effects. Analysis of vestigial wing structures identified a broad range of acoustic
242
resonances, which could facilitate the evolution of new cricket songs with carrier frequencies
243
that extend well beyond the typical narrow range centred around 5 kHz for this species [𝑥̅ =
244
5.02 kHz ± 0.017 s.e. reported in (43)].
245
The venation which has been left behind on the disrupted forewings of silent flatwing
246
crickets includes a wide range of morphological features: more than one occurrence of
247
genetic mutation appears to have driven convergent loss of song with noticeably different
248
morphological consequences (16; Fig. 1B), and we have found that these loss-of-function
249
flatwing genotype(s) also interact with background genetic variation to produce a suite of
250
wing structures with sharp acoustic resonances but impaired signalling capability. Peak
251
frequencies of vestigial harps on flatwing T. oceanicus wings spanned a range from
252
approximately 4.0 – 16.5 kHz in this study. The range of morphological variation we detected
253
among flatwings is suggestively similar to that which characterises variation in wing
254
resonators across deep evolutionary divisions within the Ensifera (Fig. 1C). Acoustic
255
signalling is thought to have facilitated rapid speciation and radiation in crickets and
256
katydids, has evolved independently on multiple occasions, and has been secondarily lost in
257
several lineages (33, 44). Our results raise the intriguing possibility that secondary losses of
258
song through male wing feminisation could have played a key role in evolutionary radiations
259
involving this group.
260
The existence of a suite of pre-existing morphological variants that could underpin the
261
evolution of new signal values does not guarantee the evolution of such new signal values or
262
subsequent diversification; these vestigial resonators may be best thought of as a facilitating,
263
yet not sufficient, requirement for such a mode of diversification. For new signals to evolve,
264
receiver structures and physiology must also coevolve. On a trivial level, that this has
265
happened repeatedly throughout the evolution of sexually signalling taxa is demonstrated by
the existence of divergent mate recognition systems across extant groups. The singing insects,
267
for example, produce an exceptionally broad range of species-diagnostic carrier frequencies
268
(27, 33, 35). One well characterised system involves the genus studied here, in which females
269
of the sister species T. oceanicus and T. commodus filter male advertisement songs differing
270
in carrier frequency by approximately 1 kHz, to discriminate against heterospecific calls that
271
might be experienced in sympatry (21, 45). In another group of calling insects, lebinthine
272
crickets, both signal and receiver shifts have occurred not only across frequency spectra
273
(audible to ultrasonic), but also across modalities (from acoustic to vibratory mate
274
localisation) (38). We note that although T. oceanicus females discriminate males on the
275
basis of call frequency, with a selectivity peak at approximately 5 kHz, they will also respond
276
to artificial song playbacks ranging from 2.5 to 7.0 kHz (21). The plausibility of a scenario
277
involving co-option and elaboration of vestigial resonators via sexual selection is supported
278
by the recent observation that female T. oceanicus from a population on Molokai
279
preferentially associate with attenuated acoustic stimuli produced by some flatwing males,
280
compared to silence (46). It is unclear whether these flatwing males’ acoustic emissions result
281
from engagement of a residual file and scraper mechanism or friction affecting other wing
282
structures; amplitude of the acoustic stimuli is orders of magnitude lower than that of singing
283
normal-wing males and likely to be close to the auditory detection threshold (47), and their
284
frequency spectra are relatively flat (46). Nevertheless, this finding confirms observations
285
that auditory neurons in grylline crickets show broad frequency tuning (48) and suggests that
286
female responses to novel acoustic frequencies may be less of a barrier to signal evolution
287
than are the biomechanical constraints imposed by morphological adaptations for sound
288
production.
289
The release of variation in T. oceanicus following secondary loss of song satisfies a
290
key requirement for models of rapid diversification following trait loss (2, 3, 7). Some
291
variation among flatwing males, for example those derived from different island populations,
292
appears to reflect different genetic causes (16), but the background and family-level effects
293
that we found to release further morphological variation is characteristic of decanalization
294
under different genetic backgrounds (32). Genetic control of canalisation has been
295
characterised in other contexts, for example the heat shock protein Hsp90 in Drosophila
296
melanogaster (49), and our results support the idea that a reduction in canalisation following
297
the evolutionary loss of song in field crickets can generate a broad phenotypic substrate of
298
male forewing variants that could facilitate the evolution of new signals. Another intriguing,
non-mutually exclusive possibility is that developmental plasticity contributes to the variation
300
in wing morphology we observed, raising the possibility that signal diversification following
301
trait reversal could involve a simultaneous combination of selection on genetic variation and
302
canalization of developmentally plastic phenotypes (50). Analysis of flatwing resonances
303
revealed that vestigial resonators have the potential to generate acoustic signals at frequencies
304
outwith the range of ordinary calling song in T. oceanicus, and more variable. It remains to
305
be seen (perhaps not in our lifetimes) whether a radiation of sexual signals in T. oceanicus
306
will evolve from this broad substrate of vestigial wing structures and contribute to
307
establishing new species boundaries. The predictions we tested about patterns of vestigial
308
signal traits and their design features are focused on the earliest stages of such a process, and
309
our results lend empirical support to the idea that trait loss could precede and facilitate bursts
310
of diversification (2, 51-53).
311
312
Methods
313
Cricket lines and crosses. Laboratory stocks of crickets were established from eggs laid by
314
approximately 20-30 wild-caught females. Collections were made in 2012 from populations
315
near Wailua, Kauai and La’ie, Oahu. In the complementation experiment, we used Kauai
316
lines breeding pure for flatwing or normal-wing morphology. The establishment of these lines
317
using two generations of standard Mendelian crosses to identify homozygous flatwing and
318
homozygous normal-wing genotypes has previously been described in detail (54). Crickets
319
were reared within a temperature-controlled chamber at 25 °C on a 12h:12h photo-reversed
320
light:dark cycle following established protocols (55). They were maintained in 16L
321
translucent plastic tubs at a density of approximately 30-50 individuals, with cardboard egg
322
carton for cover and ad libitum Burgess Excel Junior and Dwarf rabbit food and water.
323
Maintenance was performed twice weekly.
324
The crossing design for the complementation test followed the schematic in Fig. 2A-325
B. We set up five individual crosses using flatwing Kauai P0 dams and flatwing Oahu sires.
326
We did not have pure-breeding Oahu lines at the time of the complementation test, so we
327
performed the inter-island cross in one direction only. As a control, five crosses between
328
flatwing Kauai females and flatwing Kauai males were simultaneously performed. At the F1
329
generation, ten individual full-sibling crosses for the five test and three of the control crosses
330
were performed. All offspring were reared under common garden conditions as described
331
above.
333
Wing morphometrics. Landmark-based geometric morphometrics was performed as
334
previously described (16, 56). For n = 1067 F2 test crickets and n = 245 F2 control crickets,
335
male forewings were removed and immediately mounted between two slides. They were
336
then photographed using a Leica DFC295 digital camera affixed to a Leica M60 dissecting
337
microscope. The 16 landmarks illustrated in Fig. 2C were placed using the programme
338
tpsDIG v.2.16 (57). Software from the Integrated Morphomerics Package suite of
339
morphometrics programmes (58, 59) was used to superimpose landmark data from all
340
samples and quantify variation in wing venation shape using Procrustes distances (60). For
341
each comparison performed, a common dataset comprising landmark data from all the
342
individuals required for the comparison was assembled and Procrustes distances were
343
produced using CoordGen6f (58). Principal components and scores for all landmark data
344
were generated using PCAgen6n (58).
345
Wings of Kauai and Oahu flatwing males from a previous study (16) were used as a
346
reference comparison for the F2 male wings produced in the complementation crosses. The
347
same worker (S.P.) scored wing features and landmarks in both studies. We visually
348
assessed all F2 cricket wings from the complementation experiment to classify them as
349
Kauai-like or Oahu-like. Given the potential subjectivity of this qualitative classification, we
350
also recorded the presence or absence of full or partial (i.e. vestigial) scrapers and mirrors.
351
We verified this approach using a randomly selected subset of 100 wing photographs from
352
the test and control crosses. A separate scorer (N.W.B.) blinded to sample identity scored
353
whether each of the wings in the validation subset had scraper and a mirror. The proportion
354
of scrapers in the test vs. control individuals from both datasets was compared, and the
355
original scorer (S.P.) then blindly rescored the validation subset as well. Concordance
356
between scorers was found to be highly reliable, providing confidence in our method of
357
visually classifying wing traits.
358
A MANOVA was run using the first 5 principal components from a PCA in which all F2
359
test crickets were pooled with the previously-published set of flatwingmales from Kauai and
360
Oahu, to test whether wing morphology of flatwingmales arising from the test
361
complementation crosses differed from flatwingsfrom either or both island populations. A
362
post-hoc homogeneity of variance analysis was performed on the MANOVA residuals for
363
each of the five principal components, to assess whether wing variation among
364
complementation F2 crosses differed from that of the original Kauai and Oahu flatwing
365
males. We re-ran the PCA and MANOVA analyses to compare the same set of test crickets
366
against the n = 245 control wings produced using the same crossing procedure.
367
Subsequently, we ran a separate MANOVA on scores of the first n = 5 principal components
from a PCA of the complementation test F2 crickets only, here assessing family-level
369
variation in wing venation. The purpose of using five test families for the complementation
370
analysis was to provide a sufficient sample size of F2 flatwing males for analysis and
371
identification of potential recombinant phenotypes. The crossing design was insufficient to
372
formally estimate heritability of wing patterning, but quantifying family-level variation provided
373
an indication of genetic variation underlying flatwing male wing venation, as this full-sib cross
374
design included genetic and common environmental effects (61). Statistical analyses were
375
performed in SPSS v.23.
376
377
Laser Doppler vibrometry. Biophysical analyses of male forewing acoustic resonances
378
were performed using an additional three pubreeding Kauai lines that had been
re-379
established following outcrossing and re-crossing, plus pure-breeding Oahu lines that were
380
later established following the same crossing procedures as described in (54). Each
381
sampled cricket’s pronotum length and right hind femur length was measured to the nearest
382
0.01 mm three times and then averaged. Crickets were anaesthetized using FlyNap
383
(Carolina Biological Supply), then mounted whole with forewings extended dorso-laterally,
384
fixed with a mixture of beeswax (Fisher Scientific) and Colophony (Sigma-Aldrich). Following
385
Chivers et al. (62), we measured vibrating-producing regions of the mounted wings and
386
characterised associated frequency spectra using a micro-scanning LDV (Polytec PSV-500;
387
Waldbronn, Germany) with a close up attachment. The wings of mounted specimens were
388
positioned perpendicular to the lens of the laser unit, and an acoustic stimulus was
389
broadcast from a loudspeaker (Ultrasonic Dynamic Speaker Vifa, Avisoft Bioacoustics,
390
Glienicke, Germany) positioned above the laser unit and facing the specimen (Fig. 4A). The
391
stimulus consisted of periodic chirps (1-50 kHz) generated using Polytec software (PSV 9.2),
392
passed to an amplifier (A-400, Pioneer, Kawasaki, Japan), and sent to the loudspeaker. We
393
flattened the periodic chirp stimulus so that all frequencies were presented at 60 ± 1.5 dB
394
(SPL re. 20 µPA) at the position of the wings. A 1/8 inch condenser microphone (Brüel &
395
Kjær, Denmark) was positioned dorsally between the outstretched wings to monitor and
396
record the stimulus as a reference. Using the laser in scan mode, the extended wings were
397
scanned using 250-300 scan points, averaging 3 times to obtain the value for each point. For
398
each point, a fast-Fourier transform was generated using a rectangular window at a
399
sampling rate of 512,000 samples/second, a 64 ms sampling time, and a frequency
400
resolution of 15.63 Hz.
401
Raw vibrometry data was analysed using Polytec software (v. 9.2) and custom
402
MATLAB (The MathWorks Inc., Natick, MA, USA) scripts. Vibrometry frequency spectra
403
were normalised to the playback signal received by the microphone using a transfer function
(63). To estimate the amount of unrelated noise, we also computed the magnitude-squared
405
coherence between the vibrometer and microphone signals for each data point (64).
406
Coherence ranges between zero and one, where one indicates no unrelated or external
407
noise. Our aim was to identify sharply-tuned resonant peaks on crickets’ forewings, which
408
we assessed using the dimensionless index Q (65). We calculated Q by dividing the peak
409
frequency by the bandwidth at 3 dB below the peak amplitude (66), identifying the sharpest
410
peak (highest Q) on the surface of each pair of wings in the centre of the harp (in the case of
411
normal-wing controls) or vestigial harp area (in flatwings) to report the dominant resonant
412
frequency for each. Two-tailed t-tests were used to compare peak frequency differences
413
between Kauai and Oahu flatwing male resonators. Although sample sizes were small, the
414
large effect sizes (Cohen’s D for left wing comparison = 4.75, for right wing comparison =
415
2.66) provide a measure of confidence in this approach (67). Right wing comparisons
416
involved samples with heterogeneous variances so we performed a nonparametric test to
417
verify the inference that Kauai flatwings produce higher peak resonances than Oahu
418
flatwings (Mann-Whitney U test: U = 3, P = 0.028).
419
Data accessibility. Any data not presented in the SI Appendix will be archived on the Dryad
420
Digital Repository upon acceptance.
421
Author contributions. N.W.B. conceived the study. N.W.B., S.P. & F.M.-Z. designed the
422
experiments. S.P. performed complementation and morphometric experiments. N.W.B. and
423
F.M.-Z. performed laser Dopper vibrometry experiments. All authors analysed data. N.W.B.
424
wrote the manuscript with input from S.P. and F.M.-Z.
425
Competing interests. The authors declare no competing interests.
426
Funding. Funding support was provided by the Natural Environment Research Council to
427
N.W.B. (NE/I027800/1, NE/G014906/1, NE/L011255/1) and from the Leverhulme Trust to
428
F.M.-Z. (RPG-2014-284).
429
Acknowledgements. We are grateful for help with field collections from R. Goodwill and B.
430
Gray. Thanks are also due to B. Chivers and T. Jonsson for assistance with laser Doppler
431
vibrometry, D. Forbes and A. Grant for helping maintain crickets, and M. Ritchie for advice
432
on the crossing design. Two reviewers and the editor provided helpful feedback that
433
improved the manuscript.
434
References
435
1. Simpson GG (1944) Tempo and Mode in Evolution. Columbia University Press, New York.
436
2. Moczek AP (2008) On the origins of novelty in development and evolution. Bioessays. 30:432-447.
3. McGuigan K, Sgrò CM (2009) Evolutionary consequences of cryptic genetic variation. Trends Ecol
438
Evol 24:305-311.
439
4. Tanghe KB, et al. (2018) What’s wrong with the modern evolutionary synthesis? A critical reply to
440
Welch (2017). Biol Philos 33:23.
441
5. Porter ML, Crandall KA (2003) Lost along the way: the significance of evolution in reverse. Trends
442
Ecol Evol 18:541-547.
443
6. Whiting MF, Bradler S, Maxwell T (2003) Loss and recovery of wings in stick insects. Nature
444
421:264-267.
445
7. Chippindale PD, Bonett RM, Baldwin AS, Wiens JJ (2004) Phylogenetic evidence for a major
446
reversal of life-history evolution in plethodontid salamanders. Evolution 58:2809-2822.
447
8. Hofmann CM, et al. (2012) Opsin evolution in damselfish: convergence, reversal and parallel
448
evolution across tuning sites. J Molec Evol 75:79-91.
449
9. Fong DW, Kane TC, Culver DC (1995) Vestigialization and the loss of nonfunctional characters.
450
Annu Rev Ecol Systemat 26:249-268.
451
10. Gray DA, Hormozi S, Libby FR, Cohen RW (2018) Induced expression of a vestigial sexual signal.
452
Biol Lett 14:20180095.
453
11. Schneider WT, Rutz C, Hedwig B, Bailey NW (2018) Vestigial singing behaviour persists after the
454
evolutionary loss of song in crickets. Biol Lett 14:20170654.
455
12. Wiens JJ (2001) Widespread loss of sexually selected traits: how the peacock lost its spots.
456
Trends Ecol Evol 16:517-523.
457
13. Fisher RA (1915) The evolution of sexual preference. Eugenics Rev 7:184-192.
458
14. Lande R (1981) Models of speciation by sexual selection on polygenic traits. Proc Natl Acad Sci
459
USA 78:3721-3725.
460
15. Zuk M, Rotenberry JT, Tinghitella RM (2006) Silent night: adaptive disappearance of a sexual
461
signal in a parasitized population of field crickets. Biol Lett 2:521-524.
462
16. Pascoal S, et al. (2014) Rapid convergent evolution in wild crickets. Curr Biol 24:1369-1374.
463
17. Zuk M, Bailey NW, Gray B, Rotenberry JT (2018) Sexual signal loss: the link between behaviour
464
and rapid evolutionary dynamics in a field cricket. J Anim Ecol 87:623-633.
465
18. Tinghitella RM (2008) Rapid evolutionary change in a sexual signal: genetic control of the
466
mutation ‘flatwing’ that renders male field crickets (Teleogryllus oceanicus) mute. Heredity
100:261-467
267.
468
19.Alexander RD (1960) Sound communication in Orthoptera and Cicadidae. In: Animal Sounds and
469
Communication (Eds. Lanyon WE, Tavolga WN). American Institute of Biological Sciences,
470
Washington DC.
471
20. Mendelson TC, Shaw KL (2005) Rapid speciation in an arthropod. Nature 433:375-376.
472
21. Bailey NW, Moran PA, Hennig RM (2017) Divergent mechanisms of acoustic mate recognition
473
between closely related field cricket species (Teleogryllus spp.) Anim Behav 130:17-25.
474
22. Montealegre-Z F, Ogden J, Jonsson T, Soulsbury CD (2017) Morphological determinants of signal
475
carrier frequency in katydids (Orthoptera): a comparative analysis using biophysical evidence of wing
476
vibration. J Evol Biol 30:2068-2078.
477
23. Elliott CJH, Koch UT (1985) The clockwork cricket. Naturwissenschaften 72:150-153.
478
24. Prestwich KN, Lenihan KM, Martin DM (2000) The control of carrier frequency in cricket calls: a
479
refutation of the subalar-tegminal resonance/auditory feedback model. J Exp Biol 203:585-596.
25. Robillard T, Grandcolas P, Desutter-Grandcolas L (2007) A shift toward harmonics for
high-481
frequency calling shown with phylogenetic study of frequency spectra in Eneopterinae crickets
482
(Orthoptera, Grylloidea, Eneopteridae). Can J Zool 85:1264-1274.
483
26. Mhatre N, Montealegre-Z F, Balakrishnan R, Robert D (2012) Changing resonator geometry to
484
boost sound power decouples size and song frequency in a small insect. Proc Natl Acad Sci USA
485
109:E1444-E1452.
486
27. Robillard T, Montealegre-Z F, Desutter-Grandcolas L, Grandcolas P, Robert D (2013)
487
Mechanisms of high frequency song generation in brachypterous crickets and the role of ghost
488
frequencies. J Exp Biol 216:2001-2011.
489
28. Ragge DR (1955) The venation of the Orthoptera Saltatoria with notes on Dictyopteran
wing-490
venation. British Museum (Natural History), London, UK.
491
29. Gwynne DT (1995) Phylogeny of the Ensifera (Orthoptera): a hypothesis supporting multiple
492
origins of acoustical signalling, complex spermatophores and maternal care in crickets, katydids and
493
weta. J Orthop Res 4:203-218.
494
30. Jost MC, Shaw KL (2006) Phylogeny of Ensifera (Hexapoda: Orthoptera) using three ribosomal
495
loci, with implications for the evolution of acoustic communication. Molec Phylogenet Evol
38:510-496
530.
497
31. Alexander RD (1962) Evolutionary change in cricket acoustical communication. Evolution
16:443-498
467.
499
32. Flatt T (2005) The evolutionary genetics of canalization. Q Rev Biol 80:287-316.
500
33. Otte D, Alexander RD (1983) The Australian crickets (Orthoptera: Gryllida) Academy of Natural
501
Sciences of Philadelphia, Monograph 22.
502
34. Gu J-J, et al. (2012) Wing stridulation in a Jurassic katydid (Insecta, Orthoptera) produced
low-503
pitched musical calls to attract females. Proc Natl Acad Sci USA 108:3868-3872.
504
35. Robillard T, Desutter-Grandcolas L (2004) Phylogeny and the modalities of acoustic diversification
505
in extant Eneopterinae (Insecta, Orthoptera, Grylloidea, Eneopteridae). Cladistics 20:271-293.
506
36. Schiestl FP, Cozzolino S (2008) Evolution of sexual mimicry in the orchid subtribe orchidinae: the
507
role of preadaptations in the attraction of male bees as pollinators. BMC Evol Biol 8:27.
508
37. Tobias JA, et al. (2010) Song divergence by sensory drive in Amazonian birds. Evolution
64:2820-509
2839.
510
38. ter Hofstede HM, Schöeneich S, Robillard T, Hedwig B (2015) Evolution of a communication
511
system by sensory exploitation of startle behavior. Curr Biol 25:3245-3252.
512
39. Greenfield MD (2002) Signalers and Receivers. Oxford University Press, Oxford.
513
40. Wilkins MR, Nathalie S, Safran RJ (2013) Evolutionary divergence in acoustic signals: causes and
514
consequences. Trends Ecol Evol 28:156-166.
515
41. Endler JA, McLellan T (1988) The process of evolution: toward a newer synthesis. Ann Rev Ecol
516
Systemat 19:395-421.
517
42. West-Eberhard MJ (1983) Sexual selection, social competition, and speciation. Q Rev Biol
518
58:155-183.
519
43. Pascoal S, et al. (2016) Sexual selection and population divergence I: The influence of socially
520
flexible cuticular hydrocarbon expression in male field crickets (Teleogryllus oceanicus). Evolution
521
70:82-97.
522
44. Desutter-Grandcolas L (2003) Phylogeny and the evolution of acoustic communication in extant
523
Ensifera (Insecta, Orthoptera). Zool Script 32:525-561.
524
45. Moran P, et al. (2018) Opposing patterns of intraspecific and interspecific differentiation in sex
525
chromosomes and autosomes. Molec Ecol In press.
46. Tinghitella RM, et al. (2018) Purring crickets: the evolution of a novel sexual signal. Am Nat In
527
Press.
528
47. Staudacher EM (2009) The auditory system of last instars in Gryllus bimaculatus DeGeer. Physiol
529
Entomol 34:18-19.
530
48. Vedenina VY, Pollack GS (2012) Recognition of variable courtship song in the field cricket Gryllus
531
assimilis. J Exp Biol 215:2210-2219.
532
49. Queitsch C, Sangster TA, Lindquist S (2002) Hsp90 as a capacitor of phenotypic variation. Nature
533
417:618-624.
534
50. Moczek AP, et al. (2011) The role of developmental plasticity in evolutionary innovation. Proc R
535
Soc Lond B 278:2705.
536
51. Uyeda JC, Hansen TF, Arnold SJ, Pienaar J (2011) The million-year wait for macroevolutionary
537
bursts. Proc Natl Acad Sci USA 108:15908-15913.
538
52. Landis MJ, Schraiber JG (2017) Pulsed evolution shaped modern vertebrate body sizes. Proc Natl
539
Acad Sci USA 114:13224-13229.
540
53. Puttick MN (2018) Mixed evidence for early bursts of morphological evolution in extant clades. J
541
Evol Biol 31:502-515.
542
54. Pascoal S, et al. (2016) Rapid evolution and gene expression: a rapidly evolving Mendelian trait
543
that silences field crickets has widespread effects on mRNA and protein expression. J Evol Biol
544
29:1234-1246.
545
55. Bailey NW, Macleod E (2014) Socially flexible female choice and premating isolation in field
546
crickets (Teleogryllus spp.) J Evol Biol 27:170-180.
547
56. Pascoal S, Mendrok M, Wilson AJ, Hunt J, Bailey NW (2017) Sexual selection and population
548
divergence II. Divergence in different sexual traits and signal modalities in field crickets (Teleogryllus
549
oceanicus). Evolution 71:1614-1626.
550
57. Rohlf FJ (2012) tpsDIG: Digitize Landmarks and Outlines, Version 2.16 (Stony Brook: Department
551
of Ecology and Evolution, State University of New York at Stony Brook).
552
58. Zelditch ML (2012) Morphometrics Software: IMP6-Integrated Morphometrics Package.
553
http://www.canisius.edu/~sheets/morphsoft.html.
554
59. Zelditch ML, Swiderski DL, Sheets HD (2012) Geometric morphometrics for biologists: A primer
555
(2nd Ed.). Academic Press, London. 556
60. Rohlf FJ, Slice D (1990) Extensions of the Procrustes method for the optimal superimposition of
557
landmarks. Systemat Zool 39:40-59.
558
61. Lynch M, Walsh B (1998) Genetics and analysis of quantitative traits. Sinauer Associates, Inc.
559
Sunderland, MA.
560
62. Chivers BD, et al. (2017) Functional morphology of tegmina-based stridulation in the relict species
561
Cyphoderris monstrosa (Orthoptera: Ensifera: Prophalangopsidae). J Exp Biol 220:1112-1121.
562
63. Windmill JFC, Gopfert MC, Robert D (2005) Tympanal travelling waves in migratory locusts. J Exp
563
Biol 208:157-168.
564
64. Windmill JFC, Fullard JH, Robert D (2007) Mechanics of a ‘simple’ ear: tympanal vibrations in
565
noctuid moths. J Exp Biol 210:2637-2648.
566
65. Bennet-Clark HC (1999) Which Qs to choose: questions of quality in bioacoustics? Bioacoustics
567
9:351- 359.
568
66. Fletcher NH (1992) Acoustic systems in biology. Oxford University Press. Oxford, UK.
569
67. de Winter JCF (2013) Using the Student’s t-test with extremely small sample sizes. Practical
570
Assessment, Research and Evaluation. 18:1-12.
68. Morris GK, Gwynne DT (1978) Geographical distribution and biological observations of
572
Cyphoderris (Orthoptera: Haglidae) with a description of a new species. Psyche 85:147-167.
573
69. Schneider H (2015)
574
https://commons.wikimedia.org/wiki/File:Pholidoptera_griseoaptera_Vorderfl%C3%BCgel.png
575
70. Del Castillo RC, Gwynne DT (2007) Increase in song frequency decreases spermatohore size:
576
correlative evidence of a macroevolutionary trade-off in katydids (Orthoptera: Tettigoniidae). J Evol
577
Biol 20:1028-1036.
578
71. Fulton BB (1915) The tree crickets of New York: life history and bionomics. Technical Bulletin New
579
York Agricultural Experiment Station. Plate V. No. 42:3.
580
72. Walker TJ (1962) The taxonomy and calling songs of United States tree crickets (Orthoptera:
581
Gryllidae: Oecanthinae). I. The genus Neoxabea and the niveus and varicornis groups of the genus
582
Oecanthus. Annals Entomol Soc Amer 55:303-322.
584
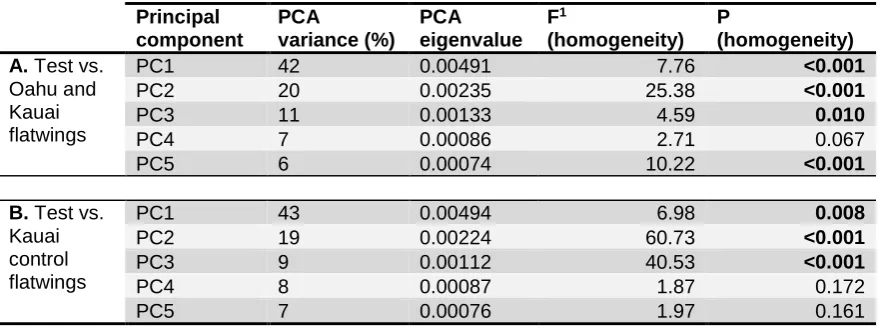
Table 1. Principal components describing variation in forewing venation among groups of flatwing
males (A)F2 complementation test, Kauai, Oahu (B)F2 complementation test, F2 Kauai controls).
Explained variance and eigenvalues are given for the leading 5 components of PCAs, and statistics are from Levene’s tests for homogeneity of variances performed separately for each component. Significance is indicated by bold text.
Principal component
PCA
variance (%) PCA eigenvalue
F1
(homogeneity) P
(homogeneity) A. Test vs.
Oahu and Kauai flatwings
PC1 42 0.00491 7.76 <0.001
PC2 20 0.00235 25.38 <0.001
PC3 11 0.00133 4.59 0.010
PC4 7 0.00086 2.71 0.067
PC5 6 0.00074 10.22 <0.001
B. Test vs. Kauai control flatwings
PC1 43 0.00494 6.98 0.008
PC2 19 0.00224 60.73 <0.001
PC3 9 0.00112 40.53 <0.001
PC4 8 0.00087 1.87 0.172
PC5 7 0.00076 1.97 0.161
585
586
587
588
[image:21.595.75.384.156.368.2]589
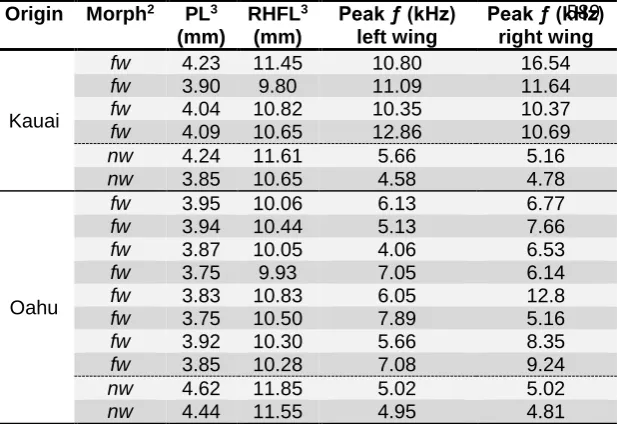
Table 2. Kauai and Oahu male wing resonances. Peak resonances
are provided for the harp area1 of each specimen’s right and left
forewing (forewings show a dominant right-over-left overlap in this species). Normal-wing males from each population are included as verifications of the technique and to aid comparison with flatwings, and full frequency spectra of all specimens are given in Fig. 5.
Origin Morph2 PL3
(mm)
RHFL3
(mm)
Peak ƒ (kHz) left wing
Peak ƒ (kHz) right wing
Kauai
fw 4.23 11.45 10.80 16.54
fw 3.90 9.80 11.09 11.64
fw 4.04 10.82 10.35 10.37
fw 4.09 10.65 12.86 10.69
nw 4.24 11.61 5.66 5.16
nw 3.85 10.65 4.58 4.78
Oahu
fw 3.95 10.06 6.13 6.77
fw 3.94 10.44 5.13 7.66
fw 3.87 10.05 4.06 6.53
fw 3.75 9.93 7.05 6.14
fw 3.83 10.83 6.05 12.8
fw 3.75 10.50 7.89 5.16
fw 3.92 10.30 5.66 8.35
fw 3.85 10.28 7.08 9.24
nw 4.62 11.85 5.02 5.02
nw 4.44 11.55 4.95 4.81
1 in flatwings, refers to either the vestigial structure, or the area in which
it would otherwise be located
2fw = pure-breeding flatwing genotype, nw = pure-breeding normal- wing genotype
3 pronotum length (PL) and rear hind femur length (RHFL): mean of three
590 591
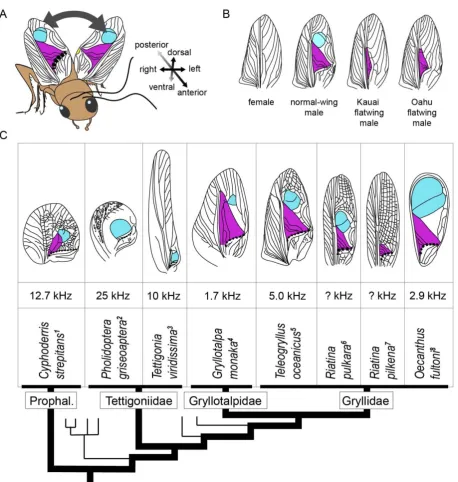
Fig. 1. Diversity of wing venation and acoustic signals in crickets and katydids. (A) Forewing stridulation
592
in a normal-wing Teleogryllus oceanicus male (anterior dorsal view with cricket’s directions indicated),
593
with mirror, harp and scraper highlighted in turquoise, purple, and yellow, respectively. The dashed
594
black line indicates the stridulatory file present on the ventral surface of the upper (right) wing, and the
595
solid gray line indicates the direction of forewing movements during singing. (B) Representative
596
Hawaiian T. oceanicus forewings, showing differences in the degree to which Kauai and Oahu flatwings
597
are feminised. Resonators and corresponding vestigial structures are highlighted as above. Adapted
598
from (16). (C) Male forewings from exemplar orthopteran species (not to scale). Sampled clades are
599
labelled on the phylogeny (Proph. = Prophalangopsidae), and approximate carrier frequencies reported
600
in the literature (“?” if unknown) are shown above species names. Shaded regions of the wing visually
601
illustrate taxonomic variation in sound resonator morphology across this group. In this simplified
602
phylogeny adapted from (30), branch lengths do not scale to divergence time. Thin branches represent
603
groups that do not sing or are not represented here. Sources from which figures were drawn and carrier
604
frequencies obtained: 1[figure: (S. K. Sakaluk); Cf: (68)], 2[figure: (69); Cf: (70)], 3[figure: (28); Cf: (70)],
605
4[figure: (33); Cf: (33)], 5[figure: (S. Pascoal); Cf: (33)] 6[figure: (33)] 7[figure: (33)], 8[figure: (71); Cf:
606
(72)].
608 609
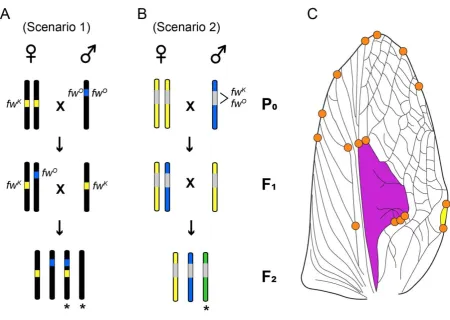
Fig. 2. Cross design for complementation test and geometric morphometrics. For each test family, a
610
parental flatwing male from Oahu (fwO) was crossed with a homozygous flatwing-carrying female from 611
Kauai (fwK). Recombination could potentially occur in the resulting heterozygous F1 females. A full-sib 612
mating was then performed to produce F2 offspring. F2 males were expected to represent either parental 613
or recombinant (asterisks) genotypes, assessed using landmark-based geometric morphometrics. The
614
same crossing scheme was followed using fwK sires and fwK dams as a control.Two genetic scenarios 615
are illustrated. (A) If fwK and fwO are sufficiently physically distant on the X (hypothetically illustrated 616
with yellow and blue colour, respectively), rare recombinant males with a restored normal-wing
617
phenotype might be detected in the F2 generation. The phenotype of the other recombinant progeny 618
(fwK/fwO) is unknown. (B) If fwK and fwO are distinct loci but sufficiently tightly linked (represented by the 619
gray region), recombination between flatwing loci is unlikely to occur. In this case, genomic background
620
effects (indicated by the yellow and blue shaded chromosomes) might be expected to predominate, and
621
recombinant F2 offspring would represent a mix of recombinant backgrounds (green shaded 622
chromosome). Under this scenario, variation in flatwing morphology is predicted to reflect the release
623
of cryptic genetic variation that epistatically interacts with wing venation loci, despite not producing
624
obvious recombinant phenotypes. The two scenarios are not mutually exclusive, but make distinct
625
predictions about whether normal-wing recombinants or release of cryptic variation should predominate
626
patterns of variation among F2 flatwing males. (C) Exemplar flatwing male forewing showing the 16 627
landmarks used in this study (orange dots). Colour scheme for vestigial resonator follows Fig. 1.
629 630
Fig. 3. Flatwing T. oceanicus wing venation. (A) Variable feminisation of vestigial sound-producing
631
structures. Selected wings (i) through (v) illustrate the range of variation in F2 individuals, from no 632
scraper, no mirror and minimal harp area in (i), to prominent scraper, ca. ½ sized harp, and almost
633
complete mirror in (v). Female and normal male wings are shown for comparison. CorelDraw v.12 was
634
used to adjust contrast and remove background. (B) Principal components describing flatwing venation
635
among the two island subtypes (data from (16)) and F2 test wings. Polygons indicate the data range for 636
each group. (C) Variability of wing venation, contrasting groups in B. (D) Principal components
637
describing test and control F2 flatwings; the former are the same samples as in B. Polygons indicate 638
the data range for each group. (E) Variability of wing venation, contrasting groups in D. Asterisks
639
indicate that group variation differed significantly (see Table 1 for statistics).
[image:24.595.73.472.79.624.2]641
Fig. 4. Vibration maps of male forewings obtained using LDV. (A) Diagram of experimental set-up,
642
showing lateral view of a normal-wing male cricket, with mirror and harp of the extended left hindwing
643
highlighted in turquoise and purple, respectively. During scans, a male is positioned in front of the laser,
644
which is aimed perpendicular to the plane of the wings (red line). The laser scans pre-defined grid points
645
while a broadband signal is played back. (B-D) Illustrative vibration maps (displacement / sound
646
pressure) showing resonant wing areas at the frequencies indicated (not necessarily peak resonances,
647
see Table 2) for: (B) Normal-wing male with typical resonant frequency at 4.8 kHz. (C) Oahu flatwing
648
male with vestigial harp producing a resonance at 5.6 kHz. (D) Kauai flatwing male with a resonance at
649
13.8 kHz. (E) Enlarged grid format of data collected from an Oahu flatwing male’s left forewing, with a
650
pronounced acoustic resonance at 7.0 kHz centred over the vestigial harp area.
[image:25.595.72.350.66.636.2]652
Fig. 5. Wing resonance plots for flatwing males from Kauai (A) and Oahu (B) populations, with
653
normal-wing comparators (C, D). Coloured lines indicate average spectra for each group, with ±1
654
standard deviation shown in grey. Dashed lines indicate peak frequencies of normal-wing males
655
recorded from each population to aid comparison with flatwing resonances. Sample sizes are
656
provided in Table 2.
Supplementary Information for
658
659
660
The Role of Trait Reversal in Evolutionary
661Diversification: A Test Using Song Loss in
662Wild Crickets
663664
Nathan W. Baileya,1,2, Sonia Pascoalb,1, Fernando Montealegre-Zc,2 665
666
a School of Biology, University of St Andrews, St Andrews KY16 9TH, UK 667
b Department of Zoology, University of Cambridge, Cambridge CB2 3EJ, UK 668
c School of Life Sciences, University of Lincoln, Lincoln LN6 7DL, UK 669
670
1 N.W.B. and S.P. contributed equally to this work. 671
2 To whom correspondence may be addressed. 672
E-mail: [email protected], [email protected]
674 675
Fig. S1. Forewings of thirteen F2 males from complementation test that exhibited distinctively,
676
but not complete, morphology characteristic of normal wings. The diagnostic features of
677
normal-wing-like morphology were: an identifiable residual mirror area defined by a clearly
678
bounded, enlarged, rounded cell adjacent and apical to the vestigial harp; typically expressing
679
an identifiable scraper; and a vestigial harp with stridulatory file visible on the ventral wing
680
surface, extending laterally from one-third to halfway across the median wing vein towards the
681
scraper. Images were processed in Adobe Illustrator v. 21.1.0 to remove background.
684
685
[image:29.595.73.319.88.328.2]686
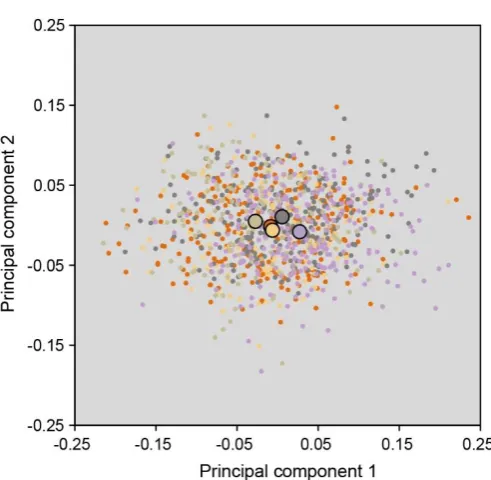
Fig. S2. Family-level variation in wing venation of flatwing males from the F2 complementation
687
test. The first two principal components of the analysis presented in the main text are plotted,
688
with colours distinguishing data from the 5 families and the larger symbols indicating their
689
centroids. Eigenvalues and percentage of variance explained for the leading 5 PCs were:
690
(PC1: 0.00517, 43%; PC2: 0.00239, 20%; PC3: 0.00122, 10%; PC4: 0.00088, 7%; PC5:
691
0.00074, 6%).
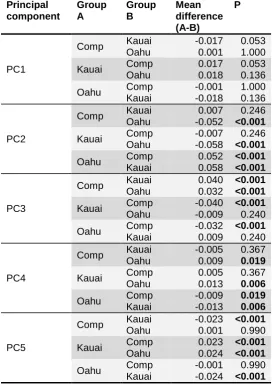
695 696 Table S1. Post-hoc comparisons between group pairs from MANOVA examining differences in forewing morphology of flatwing males from the F2
complementation test (“Comp”), Kauai, and Oahu. Tamhane’s comparisons for unequal variances were performed, and significant P-values are indicated in bold.
Principal component
Group A
Group B
Mean difference (A-B)
P
PC1
Comp Kauai -0.017 0.053
Oahu 0.001 1.000
Kauai Comp 0.017 0.053
Oahu 0.018 0.136
Oahu Comp -0.001 1.000
Kauai -0.018 0.136
PC2
Comp Kauai 0.007 0.246
Oahu -0.052 <0.001
Kauai Comp -0.007 0.246
Oahu -0.058 <0.001
Oahu Comp 0.052 <0.001
Kauai 0.058 <0.001
PC3
Comp Kauai 0.040 <0.001
Oahu 0.032 <0.001
Kauai Comp -0.040 <0.001
Oahu -0.009 0.240
Oahu Comp -0.032 <0.001
Kauai 0.009 0.240
PC4
Comp Kauai -0.005 0.367
Oahu 0.009 0.019
Kauai Comp 0.005 0.367
Oahu 0.013 0.006
Oahu Comp -0.009 0.019
Kauai -0.013 0.006
PC5
Comp Kauai -0.023 <0.001
Oahu 0.001 0.990
Kauai Comp 0.023 <0.001
Oahu 0.024 <0.001
Oahu Comp -0.001 0.990