Modeling of Microstructure Changes in FePt Nano-Granular Thin Films
Using the Phase-Field Method
Toshiyuki Koyama
*and Hidehiro Onodera
Computational Materials Science Center, Independent Administrative Institution National Institute for Materials Science, Tsukuba 305-0047, Japan
Since the factors that influence microstructure formation are extensive (e.g., alloy composition, heat treatment condition,etc.), quite a lot of experimental trial-and-error is often necessary when searching for the best combination of desired microstructure and material properties, even when the basic mechanism of microstructure formation is understood. During the last decade, the phase-field method has emerged across many fields in materials science as a powerful tool to simulate and predict complex microstructure evolution. Since phase-field methodology can model complex microstructure changes quantitatively, it is possible to search for the most desirable microstructure by using this method as a design simulation,i.e., through computer trial-and-error testing. In order to establish this methodology, first of all, quantitative modeling of complex microstructure changes using the phase-field method is required. The objective of this study is to model the FePt nano-granular structure formation and the order-disorder phase transition of FePt nano-particles as a typical example of phase-field modeling. We show that it is possible to model FePt nano-granular structure formation quantitatively using the phase-field method. This modeling method may also be applicable to various types of granular structure formation. The simulation result also suggests that there is a size dependence on the ordering of FePt nano-particles. Using the phase-field method to model the microstructure evolutions proved to be a very effective strategy in predicting and analyzing the complex microstructure formation.
(Received March 20, 2003; Accepted April 28, 2003)
Keywords: phase-field method, phase transformation, phase decomposition, pattern formation, complex system, diffusion equation, evolution equation, microstructure, energy, non-linear
1. Introduction
Since the factors that influence microstructure formation are extensive (e.g., alloy composition, heat treatment condition,etc.), quite a lot of experimental trial-and-error is often necessary when searching for the best combination of desired microstructure and material properties, even when the basic mechanism of microstructure formation is under-stood. During the last decade, the phase-field method1–5)has emerged across many fields in materials science as a powerful tool to simulate and predict complex microstructure evolution, (e.g., dendrite growth, spinodal decomposition, Ostwald ripening, crystal growth, recrystallization, marten-sitic transformation, dislocation dynamics, electromigration, crack propagation, and so on). Since phase-field method-ology can model complex microstructural changes quantita-tively, it is possible to search for the most desirable microstructure by using this method as a design simulation,
i.e., through computer trial-and-error testing. Therefore, the most effective strategy for developing advanced materials is as follows: First, we elucidate the mechanism of micro-structure changes experimentally, and then modeling the microstructure evolutions using the phase-field method based on the experimental results, and finally we search for the most desirable microstructure while simultaneously consid-ering both the simulation and experimental data. In order to carry out this methodology, the flexible quantitative model-ing method for complex microstructure changes usmodel-ing the phase-field method must first be established. For simplicity, ‘‘modeling of microstructure changes using the phase-field method’’ will be referred to as ‘‘phase-field modeling’’ throughout the rest of this paper. Phase-field modeling, from
a practical viewpoint, is aimed at decreasing the frequency of experimental trial-and-error testing as much as possible through modeling and computer simulations.
In this study, as a typical example of phase-field modeling, we propose a model for FePt nano-granular microstructure formation during sputtering and the order-disorder phase transition of FePt nano-particles in nano-granular thin film during subsequent annealing.6,7) The FePt nano-granular structure is considered to be a candidate for the next generation of high-density recording media due to its large magneto-crystalline anisotropy.
The phase-field method has been developed extensively in the field of materials science, and has come to be used in two different ways. One is the phase-field method used for simulation techniques on interface dynamics, e.g., where solidification process occurs, and the other is the continuum field model describing order parameters for temporal and spatial development during phase transformations. In this study, the latter definition of phase-field is used. We propose a modeling method for microstructure changes in FePt nano-granular thin films based on phase-field modeling.
2. Phase-Field Method
The phase-field method is explained below. Details of this method will be obtained from Refs. 1)–5). In general, the phase-field method is a computer simulation method for calculating the dynamics of temporal microstructure changes by solving the continuum non-linear evolution equations defined by eqs. (1) and (2). These equations include the dynamic coupling terms for the order parameters of time variation.
*Corresponding author, E-mail: [email protected]
Special Issue on L10-Type Ultra-High Density Magnetic Recording Materials
@ciðr;tÞ
@t ¼ r Mcifciðr;tÞ;Tg r
Gsys
ciðr;tÞ
þciðr;T;tÞ
þKcfciðr;tÞ;sjðr;tÞ;Tg
@sjðr;tÞ
@t ð1Þ
@sjðr;tÞ
@t ¼ Lsjfsjðr;tÞ;Tg
Gsys
sjðr;tÞ
þsjðr;T;tÞ
þKsfciðr;tÞ;sjðr;tÞ;Tg
@ciðr;tÞ
@t ð2Þ
T is absolute temperature. ciðr;tÞ and sjðr;tÞ are the order
parameters for the conserved and non-conserved fields, respectively, and these are a function of positionrand time
t. Subscriptiandjfor each order parameter distinguish order parameters belonging to the same category. The order parameters such asciðr;tÞand sjðr;tÞare commonly called
phase-field variables in the phase-field method.
Mcifciðr;tÞ;TgandLsjfsjðr;tÞ;Tgare the mobility terms for
microstructure changes with respect to each order parameter, and these are usually described as a function of the order
parameters, but in many actual calculations, the mobility is often set to a constant or to a function of temperature. In this study, the mobility is assumed to be constant,Mci¼1 and
Lsj¼1, so that the time dimension in this calculation is
normalized.pðr;tÞis a thermal Gaussian noise term for the
order parameterp(¼ciorsj). The second term of eqs. (1) and
(2) refers to the dynamic coupling of each phase-field variable, where Kcfciðr;tÞ;sjðr;tÞ;Tg and
Ksfciðr;tÞ;sjðr;tÞ;Tg are the coupling coefficients. These
are often assumed to a constant, or set to 0 when dynamic feedback between order parameters is ignored. In this simulation, we don’t consider these dynamical feedback terms. This coupling term should be introduced only when a highly complex microstructural morphology is formed con-siderably far from equilibrium,e.g., dendrite growth, fractal pattern formation,etc.
Gsysis the total free energy of the microstructure, which is defined by the sum of the chemical free energy Gc, the
interfacial energyEsurf, and the elastic strain energy Estr, so that the functionalGsys is written as:
Gsys¼
Z
r
Gcfciðr;tÞ;sjðr;tÞ;Tg þEsurffciðr;tÞ;sjðr;tÞ;Tg
þEstrfciðr;tÞ;sjðr;tÞ;Tg
dr: ð3Þ
SinceGc,Esurf, andEstrare expressed as a function of order parameters,ciðr;tÞandsjðr;tÞ, these parameters interact with
each other through the total free energy during microstructure changes in the computer simulation. Moreover, these variables interact dynamically when the dynamic coupling term is considered.
3. Modeling of Microstructure Changes in FePt Nano-Granular Thin Films
3.1 Formulation of total free energy
The desired microstructure change for the phase-field modeling in this study is to have the FePt nano-granular structure where the FePt nano-particles are distributed in a-Al2O3(amorphous alumina), produced by sputtering process. According to experimental results obtained by Watanabe6) and Pinget al.,7)the features of FePt nano-granular structure are as follows:
(1) Three phases have been identified experimentally,i.e., the a-Al2O3phase, disordered FePt phase (A1), and ordered FePt phase (L10).
(2) Since the as-sputtered FePt nano-granular structure shows the morphology of a two-phase mixture containing a-Al2O3 and the disordered FePt (A1), the phase separated state,i.e., a-Al2O3 phase + FePt phase is more stable than forming a solid solution.
(3) The FePt phase is in its disordered state (A1) in the as-sputtered film, and order-disorder phase transition from A1 to L10takes place in the FePt phase during subsequent thermal treatment.
In this study, we attempt to model these microstructure changes using phase-field modeling. Since phase-field mod-eling deals with the design of real microstructure changes quantitatively, several physically unclear assumptions have
occasionally been adopted. Although there may be several insufficient parts in this model, for practical engineering applications, we believe this methodology will be useful for actual materials research and development.
In order to describe temporal changes of microstructure, the order parameterFePtðr;tÞð0FePt1Þ, the probability of finding the FePt phase at time t and positionr, and the degree of ordersðr;tÞof the FePt(L10) phase are employed as phase-field variables. The value sðr;tÞis normalized by the maximum equilibrium value of degree of order determined by the FePt composition and temperature, so that the range of
sðr;tÞis set between (0 jsj 1). According to the initial as-sputtered stage experimental evidence, some amount of Fe and Pt elements are dissolved in the a-Al2O3 phase, and the volume fraction of FePt phase increases during aging. Therefore the concentrations of Fe and Pt can also be employed as order parameters. However, to make the present simulation model simpler we assume that all of the Fe and Pt atoms are contained in the FePt phase and the composition of FePt particles is constant.
The total free energy function is evaluated by utilizing the defined order parameters. Thermodynamic data which obtained from a thermodynamic database of Fe–Pt phase diagram is the Gibbs energies of disordered FePt phase (A1),
GA1FePtðcFe;cPt;TÞ, and ordered FePt phase (L10),
GL10
FePtðcFe;cPt;TÞ, where ci is the composition of element i.
GAl2O3-A1¼ ð1FePtÞG
am1
Al2O3ðTÞ þFePtG
Al
FePtðcFe;cPt;TÞ þWAl2O3-A1g
2
ðFePtÞ ð4Þ
GAl2O3-L10¼ ð1FePtÞG
am2
Al2O3ðTÞ þFePtG
L10
FePtðcFe;cPt;TÞ þWAl2O3-L10g
2ð
FePtÞ; ð5Þ
where the functiongðÞis defined bygðÞ ð1Þ.1,4)Gam1
Al2O3ðTÞandG
am2
Al2O3ðTÞare the Gibbs energy of the a-Al2O3phase
before and after the ordering of the FePt phase, respectively.WAl2O3-A1andWAl2O3-L10are the energy barriers terms between the
a-Al2O3 and the FePt phase. These terms ensure that the phase separation for these two phases is stable, and we assume
WAl2O3-A1¼WAl2O3-L10. By using eqs. (4) and (5), the chemical free energy of the system is expressed as:
Gc¼ f1hðsÞgGAl2O3-A1þhðsÞGAl2O3-L10þWA1-L10g
2
ðsÞ; ð6Þ
wheresis the L10 ordering parameter, and the function hðsÞis defined byhðsÞ s2ð32s2=jsjÞ.1,4)WA1-L10 is the energy
barrier term for the order-disorder phase transition, and we assumeWA1-L10¼0. In order to make the equations simpler, the
standard reference energy level,i.e., the segregation limit of the chemical free energy, is shifted toð1FePtÞGam1Al2O3ðTÞ þ FePtGA1FePtðcFe;CPt;TÞ. Therefore, eqs. (4)–(6) reduce to:
GAl2O3-A1ðFePtÞ ¼WAl2O3-A1g
2
ðFePtÞ ð7Þ
GAl2O3-L10ðFePtÞ ¼ ð1FePtÞG
am1!am2
Al2O3 ðTÞ þFePtG
A1!L10
FePt ðcFe;cPt;TÞ þWAl2O3-L10g
2ð
FePtÞ ð8Þ
GcðFePt;sÞ ¼ f1hðsÞgGAl2O3-A1þhðsÞGAl2O3-L10þWA1-L10g
2ðsÞ; ð9Þ
where Gam1!am2 Al2O3 G
am2 Al2O3G
am1
Al2O3 and G
A1!L10
FePt
GL10
FePtGAlFePt.
The gradient energy1–5) at the interface between the a-Al2O3and FePt phases is calculated by
Esurf¼ðrFePtÞ2þsjrsj2; ð10Þ
where the gradient energy coefficients and s are
constants. The elastic strain energy is assumed to be 0, because, in the present case, the elastic constraint can be ignored.
In the next section, we will explain how to evaluate the unknown constants, i.e.,GA1!L10
FePt ,G am1!am2
Al2O3 ,WAl2O3-A1, , ands, which are necessary for calculating the total free
energy.
3.2 Determination of the constants for the energy function
GA1!L10
FePt is the chemical driving force of ordering from A1 to L10 in the FePt phase. It is calculated using the chemical free energies of the FePt disordered and ordered phases. Recently, Fredriksson and Sundman8)assessed the thermodynamic data for the Fe-Pt binary system based on the CALPHAD method.9) Using their thermodynamic data for chemical free energy, GA1!L10
FePt is calculated as
GA1!L10
FePt ¼ 2:242103 (Jmol1) at T¼923K when the composition of FePt phase is cFe¼0:55ðcPt¼0:45Þ.
Gam1!am2
Al2O3 is expediently set as G
am1!am2 Al2O3 ¼
GA1!L10
FePt , then a phenomenological requirement that the a-Al2O3 phase does not change during ordering of the FePt phase is satisfied automatically.
The value ofWAl2O3-A1is estimated by the morphological
microstructure data for the as-sputtered film that was experimentally obtained.6,7) First of all, the two-phase granular structure in the as-sputtered film is considered to be the result of spinodal decomposition on the chemical free energy curve described by the phase-field variables. In the phase-field methodology, since the chemical free energy curves with a different crystal structure are connected to each other using phase-field variables, the mechanism of spinodal decomposition is applicable for all phase separation even if
the crystal structure is different. In this case, this phase separation is regarded as the spinodal decomposition from the gaseous solution phase to the two-phase solid state of a-Al2O3 and FePt, and the trajectory of the chemical free energy during the phase decomposition is assumed to be located on the chemical free energy curve of eq. (7). From the spinodal theory,10,11)we have eq. (11).
4kc2¼
@2G Al2O3-A1 @2
FePt
¼ 2WAl2O3-A1ð16FePtþ6
2 FePtÞ
ð11Þ
The preferential wave numberkcis defined by kc2=c,
where c is the preferential wavelength of the spinodal
decomposition for theFePtfield. In addition, when the shape of the FePt profile across the a-Al2O3/FePt interface possesses a stable profile shape with local equilibrium, eq. (12) is obtained.4,10)
¼
92
sVm2
WAl2O3-A1
ð12Þ
whereVmis the molar volume, andsis the interfacial energy
density at the a-Al2O3/FePt interface. Substituting eq. (12) into eq. (11), we get
WAl2O3-A1¼
6sVm
c
ffiffiffiffiffiffiffiffiffiffiffiffiffiffiffiffiffiffiffiffiffiffiffiffiffiffiffiffiffiffiffiffiffiffiffiffiffiffiffiffiffiffiffiffiffi 2
ð16FePtþ62FePtÞ
s
: ð13Þ
The experimental value ofsis available12)(see Table 1), and
according to the experimental results obtained by Watanabe6)
et al., FePt¼0:4 and c¼4 (nm), so that WAl2O3-A1¼ 1:30105 (J/mol), and using this, the value of
is
calculated from eq. (12). The molar volume of the FePt(L10) phase was used forVm.
The gradient energy coefficients is determined by using
s¼
1 4d
2 APBjG
A1!L10
FePt j ð14Þ
is satisfied.10)Experimental observations by Watanabeet al.6)
indicates thatdAPB¼1:38109(m), then the value ofsis
s¼1:071015 (Jm2/mol) for Fe–45 at%Pt (at 923 K).
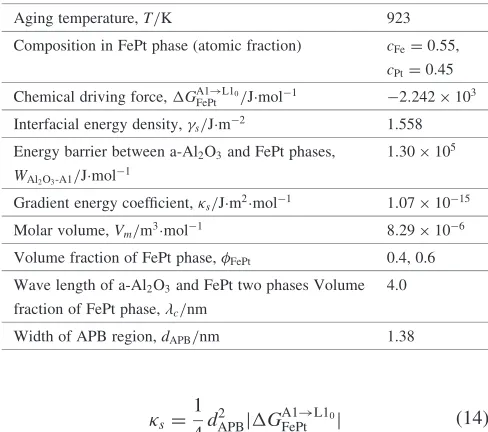
[image:4.595.309.548.72.260.2]Numerical values used for the calculation are summarized in Table 1.
Figure 1 is the chemical free energy curve for eq. (9). It is easy to visualize the path of phase decomposition during sputtering and the order-disorder phase transition of FePt phase by using this free energy surface. The initial state of the gaseous solution phase corresponds to the energy level denoted by (A). The path of phase decomposition during sputtering is indicated by the arrows pointing away from (A). The arrow in the direction of (B) corresponds to the path of the order-disorder phase transition in the FePt phase during subsequent heat treatment.
4. Results of the Phase-Field Simulation
Figure 2 shows the two-dimensional simulation result for the FePt nano-granular structure formation and the ordering of FePt nano-particles at 923 K. The composition of the FePt phase is set to Fe–45 at%Pt. The black and white droplet shaped regions are FePt nano-particles. The degree of white refers to the degree of L10ordering. The black particles are the FePt(A1) disordered phase, and the white particles are the FePt(L10) ordered phase. And the matrix (gray region) is the a-Al2O3 phase. Numerical values in the figure indicate the normalized aging time.
In the initial as-spattered stage, as shown in Figs. 2(a) and (b), FePt phase is in a disordered state. With progress of aging, as seen in Figs. 2(c) to (e), ordering from A1 to L10
Fig. 1 Chemical free energy of the a-Al2O3–FePt system.
a)100s'
b)200s'
c)500s'
20nm
Fe-45at%Pt at 923K
e) 1ks'
f) 2ks'
g) 3ks'
d)700s'
h) 4ks'
Fig. 2 Simulation result of the microstructure changes in FePt nano-granular film at 923 K. Volume fraction of FePt phase is 0.4. Table 1 Numerical values used for the calculation.
Aging temperature,T/K 923 Composition in FePt phase (atomic fraction) cFe¼0:55,
cPt¼0:45
Chemical driving force,GA1!L10
FePt /Jmol1 2:242103
Interfacial energy density,s/Jm2 1.558
Energy barrier between a-Al2O3and FePt phases, 1:30105 WAl2O3-A1/Jmol
1
Gradient energy coefficient,s/Jm2mol1 1:071015
Molar volume,Vm/m3mol1 8:29106
Volume fraction of FePt phase,FePt 0.4, 0.6
Wave length of a-Al2O3and FePt two phases Volume 4.0
fraction of FePt phase,c/nm
[image:4.595.46.290.83.299.2] [image:4.595.62.536.515.766.2]proceeds and the FePt phase becomes coarser. We observed that the ordering speed of the smaller sized particles was delayed, refer to the left arrow in Fig. 2(e). The anti-phase boundary is also seen in the FePt particle, refer to the right arrow in Fig. 2(e). It is interesting to note that the degree of ordering decreases as the particle size becomes smaller, refer to arrow in Fig. 2(g). This size dependant FePt phase ordering has already been observed experimentally by Takahashi et al.13)These microstructure changes agree well with the FePt nano-granular structure formation experimentally ob-served.6,7)
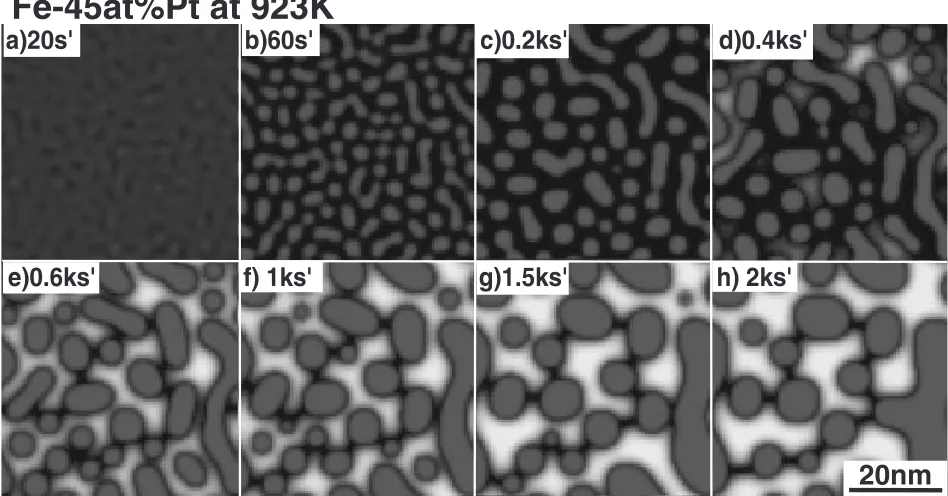
Since the simulation shown in Fig. 2 is the result of phase-field modeling constructed from experimental data, it is not surprising that the result calculated quantitatively reproduces the experimental microstructure. However, a characteristic of phase-field modeling is that once we construct the phase-field model for a specific case such as in Fig. 2, other micro-structure changes are easily calculated without the need for experimentation. The boundary conditions need only be changed slightly. For example, Fig. 3 shows the result for the volume fraction of FePt phase set to 60%. We can see from the figure that the FePt phase forms a matrix when compared with that of Fig. 2. The microstructure change in Fig. 3 shows good agreement with the experimental results by Pinget al.7)
Moreover, the calculation time required to finish the simulation took only a few minutes on a standard personal computer (1 GHz CPU or greater). Therefore, it is easy to carry out trial-and-error testing for various microstructure formations on a personal computer by changing the boundary conditions. This modeling method can also be applied to various types of granular structural formations.
Finally we would like to emphasize that the micro-structure’s morphological shape is quantitatively obtained using phase-field modeling, therefore, it is also possible to
calculate magnetic properties,i.e., magnetic hysteresis, based on the micromagnetics14)simulation by using the calculated microstructure data as boundary conditions.
5. Conclusions
We attempted to model the complex microstructural changes found in FePt nano-granular structure formation and the order-disorder phase transition of FePt nano-particle using the phase-field method. The results obtained are as follows:
(1) We quantitatively modeled FePt nano-granular struc-ture formation using the phase-field method.
(2) This method could be applied to the modeling of various types of granular structure formations.
(3) The simulation results suggested that FePt nano-particle ordering is size dependent.
(4) The modeling of microstructure evolution using the phase-filed modeling, is an effective strategy in pre-dicting and analyzing complex microstructure forma-tions.
Acknowledgements
The authors are grateful to Dr. Y. K. Takahashi for her helpful discussions. This work was partly supported by a NEDO International Joint Research Grant on ‘‘Structuring Knowledge, Science and Technology for Nano Material Processing’’, and by a Special Coordination Fund for Promoting Science and Technology on ‘‘Nanohetero Metallic Materials’’ from the Ministry of Education, Culture, Sports, Science and Technology.
a)20s'
b)60s'
c)0.2ks'
20nm
Fe-45at%Pt at 923K
e)0.6ks'
f) 1ks'
g)1.5ks'
d)0.4ks'
h) 2ks'
[image:5.595.60.534.81.329.2]REFERENCES
1) T. Koyama: Materia Japan42(2003) 397–404.
2) T. Koyama, T. Kozakai and T. Miyazaki: Materia Japan38(1999) 624– 628.
3) L.-Q. Chen: Annu. Rev. Mater. Res.32(2002) 113-40.
4) W. J. Boettinger, J. A. Warren, C. Beckermann and A. Karma: Annu. Rev. Mater. Res.32(2002) 163-94.
5) M. Ode, S. G. Kim and T. Suzuki: ISIJ Int.41(2001) 1076-82. 6) M. Watanabe, T. Masumoto, D. H. Ping and K. Hono: Appl. Phys. Lett.
76(2000) 3971–3973.
7) D. H. Ping, M. Ohnuma, K. Hono, M. Watanabe, T. Iwasa and T. Masumoto: J. Appl. Phys.90(2001) 4708-16.
8) P. Fredriksson and B. Sundman: CALPHAD25(2001) 535–548. 9) N. Saunders and A. P. Miodownik:CALPHAD, (Pergamon, 1998). 10) J. W. Cahn:The Selected Works of J. W. Cahn, ed. by W. C. Carter and
W. C. Johnaon, (TMS, 1998) pp. 29–50.
11) J. E. Hilliard:Phase Transformation, ed. by H. I. Aaronson, (ASM, Metals Park, Ohio, 1970) pp. 497–560.
12) L. E. Murr:Interfacial Phenomena in Metals and Alloys, (Addison-Wesley, 1975) pp. 155.
13) Y. K. Takahashi, M. Ohnuma and K. Hono: Collected Abstracts of the 2002 Autumn Meeting of the Japan Inst. Metals, (2002) 64. 14) D. V. Berkov, K. Ramstock and A. Hubert: Phys. Status. Solidi.137