Munich Personal RePEc Archive
Banking Strategy and Implementation of
Banking ASEAN Integration
Framework(ABIF)in ASEAN
Community (AEC)’s Era 2020 ERA 2020
Suryasnia, Sofi and Primiana, Ina and Sucherly, Sucherly and
Herwany, Aldrin
Doctorate Program in Management, Faculty of Economics and
Business, Universitas Padjadjaran, Bank BJB of West Java,
Indonesia
25 August 2016
Online at
https://mpra.ub.uni-muenchen.de/73303/
BANKING STRATEGY AND IMPLEMENTATION OF BANKING ASEAN
INTEGRATION FRAMEWORK ( ABIF ) IN ASEAN ECONOMIC COMMUNITY (AEC)’S ERA 2020 .
Sofi Suryasnia
PT. Bank Pembangunan Daerah Jawa Barat dan Banten. (Bank bjb) Doctorate Program in Management
Faculty of Economic and Business Universitas Padjadjaran, Bandung Indonesia Email [email protected]
Ina Primiana
Doctorate Program in Management
Faculty of Economic and Business Universitas Padjadjaran, Bandung Indonesia, Email : [email protected]
Sucherly
Doctorate Program in Management
Faculty of Economic and Business Universitas Padjadjaran, Bandung Indonesia, Email : [email protected]
Aldrin Herwany
Doctorate Program in Management
Faculty of Economic and Business Universitas Padjadjaran, Bandung Indonesia,
Email : [email protected], Chairman of Indonesian Economist Association (ISEI) West Java, Member of Governance Integration Committee of PT. Bank Pembangunan Daerah Jawa
Barat and Banten
ABSTRACT
As the preparation and to support the integration of ASEAN banks in 2020, through the establishment of ASEAN Banking Integration Framework (ABIF), banks and business people are expected to develop their businesses in the region with broader scope, more efficient and stable financial. The main purpose of ABIF 2020 is to provide Qualified ASEAN Banks (QAB) which has adequate capital, resilient, well managed and meet the prudential banking requirements, with more access to the regional markets and freedom to operate in ASEAN member countries. However, currently most Indonesian banks still have limited resources compared to the large banks from other ASEAN countries. Even Indonesia’s largest bank assets is only 1/6 of the largest bank in Singapore. Therefore, if Indonesian Banks want to compete, they certainly have to improve their overall performance.
This study is aimed to analyze the strategy that Bank should implement to deal with ABIF. One that must be done is to develop a business strategy that allows banks to achieve the optimum level of profitability and efficiency. The method that will be used in this research is the Seemingly Unrelated Regressions (SUR) for Panel Data. The data used is the entire banking listed in the Stock Market in ASEAN countries.
The results of this study are expected to provide a clear picture of the Banking Business Strategy in dealing with the enactment of ABIF in AEC’s era, and enrich the research literature in the field of Banking Business Strategy to challenge the increasing competition in the region.
1. INTRODUCTION
Indonesia will participate and support the integration of ASEAN banking which is the important action for ASEAN’s Economic and Financial integration system. ASEAN Banking Integration Framework (ABIF) Guidelines will be established as a guideline for the operational framework of ASEAN countries in implementing the principles and process of banking integration under the framework of the ASEAN Economic Community (AEC). Through the establishment of ASEAN Banking Integration Framework (ABIF), banks and business people are expected to develop their businesses in the ASEAN region with broader scope, more efficient and stable financial. The issue of uneven capital in the ASEAN banking has become the issue that should be concerned by bankers, the value of return on assets was quite good in several ASEAN banking, it become a mainstay of banks in expanding its market share. Nevertheless, according to the research of Yamanaka (2013) and Wu, Ting Lu, Nourani, and Kweh (2016) the issue of efficiency is still a concern, they explain that almost every banks in ASEAN has not reached the optimum level of efficiency, they recommend the banks in ASEAN to reduce carry-over, and also need managerial significant improvements.
ABIF main objective is to prepare market access and the freedom to operate (operational flexibility) in ASEAN member countries for Qualified ASEAN Banks (QAB), which are ASEAN banks that meet certain requirements agreed by ASEAN. Bank requirements to become a candidate of QAB include the ASEAN-owned banks with strong capital base, resilient and well run, and meet the prudential requirements in accordance to applicable international standards. The banks are expected to be the driver of trade and investment in ASEAN.
ABIF positive impact for Indonesia is the opportunity and potential framework for banking and Indonesian business people to expand into the ASEAN market. With emphasis on the principle of reciprocity and the agreement on a mechanism to reduce significant differences in terms of market access and operating flexibility in the integration process of ASEAN banking, it will open greater opportunities for Indonesian banks to gain access to markets and broader business activities in the ASEAN region. However, Indonesian banks also have to anticipate ABIF to strengthen the capital, the quality and efficiency of human resources to be able to compete in regional and global level. Business people will benefit through improved access to sources of larger and safer financing to cross-border trade and investment activities. Yamanaka (2013) and Lee and Fukunaga (2014) have explained that in countering the integration of banking market, it is necessary to strengthen cooperation to overcome the more stringent global challenges, in order to have competitive advantage and lowering new potential risks that exist.
Banking in Indonesia currently have very low assets compared to other ASEAN banking, even the Indonesia’s largest bank assets is only 1/6 of the largest bank in Singapore, which is not the large bank. Therefore if Indonesian Banks want to expand overseas or survive in their own country, they should have the same requirements as in other ASEAN countries.
the bank, and if such losses exceeded the amount of capital available then the bank would have difficulty in repaying liabilities, in which may lead to bankruptcy. The ratio required by a regulator will be that level deemed sufficient to protect the bank's depositors. (Moorad Choudrhy, 2007)”. It can be said that the optimum capital is the company's blood to develop it self or expand. This capital is very important for the Bank in order to improve its Business in terms of investment as well as providing qualified credit. Capital in Bank Indonesia included in the BOOK (General Books Business Activities) category. Therefore the capital factor becomes extremely important in developing the bank's business and enlarging the size of banks and markets. Neverthelles, Ahmad, Ariff and Skully (2008) have found something different as the capital factor is not the only factor that determines the profitability of banks but regulations are the ultimate factor related to the size of capital and risk level. Capital will greatly affect the acquisition of the bank's profit for the developed countries and not for developing ones, ASEAN is classified as the group of countries which dominantly developing countries except Singapore said to be included as a transition into the developed countries. Therefore, the capital become one of the factors described in this study, considering the outcome of their study result is out of date (2008).
Based on the above phenomenon, this study focused on determining what factors determine the bank's financial performance as seen from indicators of return on assets and return on equity, different from previous studies, this study used two simultaneous equations, therefore the variable that determines the change in return on assets and return on equity is comprehensive, it is to assert the existence of the financial indicators of banking into exogenous and endogenous as drivers of changes in earnings or indirect influence to bank profits. Next is to determine what suitable strategies to deal with integration banks in ASEAN.
The structure of the article starts from the introduction and continued by a literature review to analyze the comparison of results of previous study. Methodology becomes part (chapter) 3 containing models’ simulation with data panel approach and continued with the results of study and discussion. The last stage is making conclusions and recommendations concerning what ASEAN banks should do and the strategy forward.
2. LITERATURE REVIEW
INTEGRATION
In a market that integrates both real sector and financial sector policies, The local governments should certainly consider what most appropriate policies to encourage the expansion of banking business. ASEAN Economic Community (AEC) has been in effect since 2015, but not for the financial sector, especially banking sector that will be implemented in 2020, therefore banks in ASEAN countries still have enough time to prepare all the possibilities of what lies ahead. Yamanaka (2014) mentions that integrated financial markets of ASEAN countries requires a good level of efficiency as well, in addition there are several regulations that have to be prepared and performing deregulation because flow of goods and services will take place at the regional cross. Integrated market is a boon for banks with definite strong capital, this issue should be considered by the banking industries in ASEAN.
LEVEL OF COMPETITION AND POTENTIAL
Banking conditions in seven ASEAN countries can be seen in table 4.1 below includes a number of banks listed on the exchange and the financial indicators of banking.
From table 4.1 above can be seen that in this study, Indonesia is a country where the number of banks listed on the stock most are 36 banks. Philippine is a country that has the highest ROA level in ASEAN and Indonesia is the lowest. In terms of ROE, Laos is the highest state of 25.03% outpacing the ratio of other ASEAN countries. On the capital side, Philippine is the highest state of 18:22% which is a little different with Indonesia, other countries in the range of 16% of the country's and the lowest ratio of capital is Laos . By looking to the comparison of the study results by Nguyen, Skully, and Perera (2012) for the period 1998-2008, the capital in almost every ASEAN countries had increased, meaning that there was significant additional capital. Indonesia used to be in the range of 14.745 and nowadays has reached 18:33%, Malaysia from 13:02% to 15.9%, from 14:52 Philipinne % to 18:36%, Thailand from 10:56% to 16:11% and Vietnam from 12:09% to 13.65%. The increase in capital in almost every banks listed on the stock for ASEAN countries has shown the increase in liquidity and the ability of business expansion.
Net interest margin (NIM) is the level of profits earned by the bank through its intermediary function, as Indonesia, Philippine and Laos are still in the range of 4-5% and followed by Thailand and Vietnam in the range of 3% late. While the countries of Malaysia and Singapore have been much lower in the range of 1% late. The phenomenon of high margin can not be separated from the
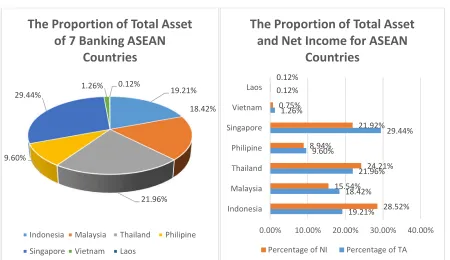
As an illustration on Table 4.2 , it can be seen that the current total number of ASEAN's largest asset is the total amount of the banking assets in Singapore almost 1/3 of the total assets of all banks in ASEAN, while banks in Indonesia, Malaysia and Thailand ranged between 300 s / d 400 billion USD. This illustrates how big it is the strength owned by Singapore compared to other ASEAN countries. On the contrary, it is the biggest number of Net Income owned by the banks in Indonesia followed by Malaysia and Singapore. Each in a row is 28.52%, 24.21% and 21.92% of the total ASEAN NI.
BANKING POTENTIAL AND FUTURE PROSPECTS
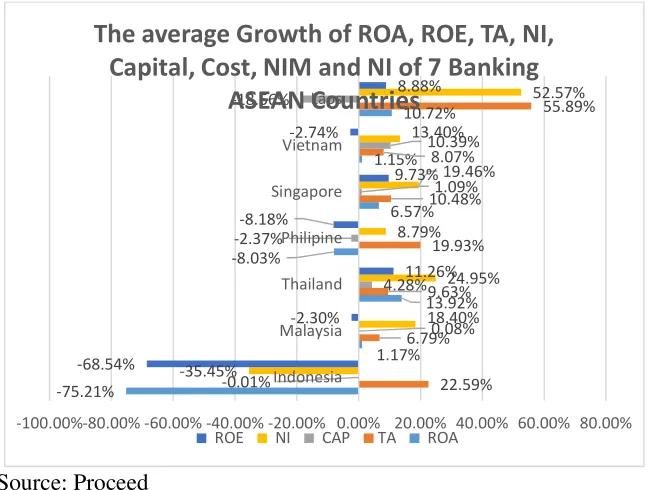
The growth trend is one of the option to measure bank’s the performance in the future, banks in Indonesia experienced a slowdown, characterized by a decrease in growth over the last 4 years. The Financial indicators that were decreasing are ROA, ROE, NI, NIM and CAP while in terms of COST experienced a positive growth in table 4.3 below.
COST growth tended to be inefficient. NIM improvement was characterized by a decrease in negative growth. On the contrary, banking in Malaysia as experienced the improvement of efficiency levels characterized by COST negative growth, while ROA, TA, CAP and NI showed positive growth. The NI growth experienced significant increase of 18.4%, but ROE experienced a slowdown or negative sign. Banking of Thailand experienced a positive growth in almost every financial indicators and increased efficiency , characterized by a negative growth rate of COST. Total assets (TA) in the Philippine banking increased significant growth followed by a positive NI growth but ROA and ROE growth are negative. The other side of the Philippine banking indicator was the growth of NIM and COST that is increased, indicated the decrease of banks’ efficiency level.
3. DATA AND METHODOLOGY
The following is the explanation of data stages and methodology used in this study.
DATA
The data used in this study are financial indicators of banking around 7 countries in ASEAN includes Indonesia, Malaysia, Thailand, Philippine, Singapore, Vietnam, and Laos. There are sampled from 66 already listed on the stock exchange. Financial indicators used in this study include return on assets, return on equity, total capital ratio, net interest margin, cost to income ratio and net income. Source of data derived from the annual data bank scope published during the time period 2012-2015.
METHODOLOGY
There are three stages in the model used to examine the data in this study, include; The first is to conduct regular panel data regression analysis to see the significant level of coefficient and the consistency level of variable. Second, is to analyze the simultaneous similarities to anticipate the effects of two interrelated variables and their two-way directions. Third, we test two models that have the power of two dependent variables, using Instrumental variable method, the estimation model aims to provide an explanation of variable exogenous and endogenous in influencing the dependent variable directly or indirectly obtaining a clear picture of which variable of the financial indicators of banking in 7 ASEAN countries that provide strong influence on the change of return on assets and return on equity.
In combining the time series data using cross sectional panel data model consisting of two, fixed effects models and random effects models. Fixed effect model: Y_it = 〖a + β〗_1 X_it + υ_it where α_i (i = 1 ... n) is the intercept, YIT is dependent variable (where I = entity and t = time), Xit is the independent variable, β_1 is the coefficient for the independent variable and υ_it is the error term, the assumptions used are unobserved variables does not change over time. Random effects models is: Y_it = a + β〗 〖X_it _1 + υ_it + ε_it
Random effects models assume that the error term is not correlated with the predictor. The Hausman test is used to determine the best model in doing estimation. In explaining the changes of several independent variables to two dependent variables that correlated one another need simultaneous model that include :
C = a + bY + e and Y = C + I + G + V + E.
This equation is two equation simultaneous equation system, between C and Y are interdependent where AE - ΔC in equation 1 but ΔC ΔY in equation 2 and ΔY - ΔC to equation 1, therefore the changes of C will cause changes in Y. Simultaneous equations can be solved by ordinary least squares (OLS)formula :
While the two Stage least squares formula is (2SLS) is b_2sls = cov (x, y) / cov (X, X).
In addition to determine which variables are endogenous and exogenous, need Instrumental Variable models. Instrumental variables (IV) is used to address the existence of endogen variables derived from two simultaneous equations, endogen variable is an event where the independent variable is correlated with the value of residual (error term) because of omitted variable bias,
measurement errorandsimultaneity. Estimator of Instrumental variable is (Greene, 2010): b_IV = [X'Z (Z ^ 'Z) ^ (- 1) Z'X] ^ (- 1) X ^' Z (Z ^ 'Z) ^ (- 1) Z'y
= Β + [X'Z (Z ^ 'Z) ^ (- 1) Z'X] ^ (- 1) X ^' Z (Z ^ 'Z) ^ (- 1) Z'ε
Where X is a set of K regressors and Z is L ≥ K instrumental variables. Instrumental variables and two-stage least squares for the data-panel models are as follow :
y_ (it = Y_it X_1it γ + β + μ_i + υ_it = Z_ (it) δ + μ_i + υ_it)
Where Yit is the dependent variable; Yit is 1 g2 vector of observations on g2 endogenous variables
included as covariates, and these variables are allowed to be correlated with the υit; X1it adalah 1 X ki vector of observations on the exogenous variables included as covariates; Zit=[YitXit]; τ adalah
g2 X 1 vector coefficient, β adalah k1 X1 vector of coefficients and δ adalah K X 1 vector of
coefficients, K = g2 + k1.
4 RESULTS AND DISCUSSION
RESULTS
Panel data used in this study (see Table 4.4) amounted to 264 consist of data time series and cross sectional from 66 bank around seven ASEAN countries. The variable ROA, CAP, NIM, COST and ROE in percentage, while the TA and NI in mutla figures (Millions of USD). The average value of ROA for 7 banking ASEAN countries was 1.42 with a standard deviation of 1.17, while the CAP has an average of 18.83 with the risk of volatility of 10.41 percent over the period 2012-2015. Net interest margin of banks in ASEAN are on the average of 4.55 percent, while the average Cost Ratio amounted to 59.91 percent. The total value of assets ranging from the average of 24.7 millions of USD and net income of 352 thousands of USD or income to total assets ratio of 1:43% for all banks listed in the ASEAN. In general, it can be seen that the ability of ASEAN banks to generate profits is in very wide range of distance with a minimum income of minus 93 thousands of USD to a maximum of 3 millions of million USD. This indicates that the net income of banks in ASEAN are very varied and has a very wide range of distances.
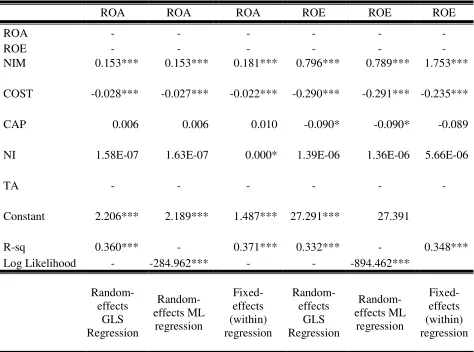
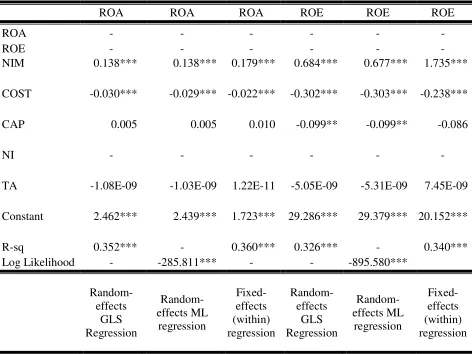
PANEL REGRESSION
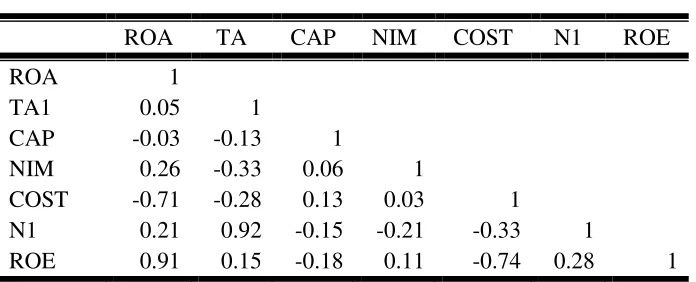
(FE), as dependent variable also used the alternatives between ROA or ROE. Hausman test results recommended to use the model of fixed-effects panel regression with Chi-square probability value in significantly smaller than the level of the small interval confidence of 0.05. Meanwhile, the value of R-sq is between 33.2% up to 37,1%, with three consistent significant variables across all models such as NIM, COST and CAP, which are significant on random effects and not on fixed-effects. TA variables were not significant in all models of the test (see Table 5.7). The Selection of NI variable compare to TA that put into the next test model was because the large amount of correlation coefficient on those two models that was 0,92, therefore only NI variable was added into the equation. This method was also a one way solution to filter the number of variables that will be used in subsequent regression model.
From the results of panel regression on table 5.6 and 5.7 can be concluded that the variable NIM, COST and CAP are the factors that influence the change in ROA and ROE, when we obtained three variables significantly influence two different dependent variables, so it is necessary to do other test on other models to determine which oneisendogenousandexsogenous variable.
From the test results seen in Table 5.6 and 5.7, it is concluded that NIM,COST and CAP variables were adequate to be the basis for Instrumental variables (IV) model selection on the next regression or known as seemingly unrelated regression (SUR) of panel data.
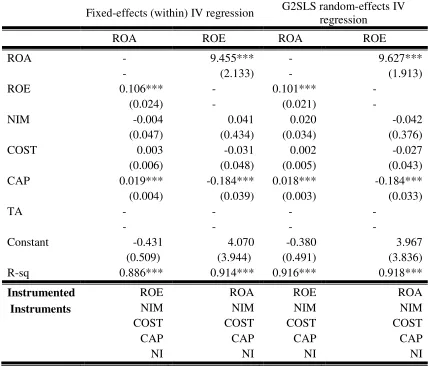
Seemingly Unrelated Regressions (SUR) of Panel Data
Hausman test results for subsequent regression panel models has recommended to use random-effects due to the Chi-square probability greater than 5% significance level (0.05), that is equal to 0.9371. In table 5.8 it can be seen that by using both endogenous variables of ROE or ROA, the CAP variable was a factor which significantly and consistently affected at a rate of 1%. This indicates that the CAP was the only variable that need attention in the banking industry in facing ASEAN financial markets integration, while NIM, COST, and NI variables were the instrumental variables that affect ROE changes. The ability to explain the change in ROA ranged from 88.6% to 91.8%, in other words, the change in ROA value was caused by the change of ROE and ROA, ROE and CAP itself, affected directly by the changes of NIM, COST, and NI. CAP value changes will significantly influence the ROE changes that ultimately affect the ROA changes.
DISCUSSION
regression. Then generated return on equity is affected by the net interest margin, cost to income ratio, total capital ratio and net income.
Learning from the results Ahmad, Ariff, and Skully (2008) who found that the capital ratio is influenced by the ratio of equity to total liabilities, it means that if you want to add a profit it will really depend on the ratio and the structure of capital and debt, ie, the greater the capital, it will encourage positive change of the level of bank profitability. Meanwhile, to give positive impact to the increase of return on equity, we need to focus on the addition of profits from credit operations, reducing costs in terms of obtaining optimal levels of efficiency and excellence overall net income from loans and fee base income.
4. CONCLUSION AND RECCOMENDATION
CONCLUSION
Based on this research, we can conclude that the most important thing to enter integrated financial Banking market in ASEAN is the capital factor. The greater the capital is owned has proven to increase the ratio of profitability (ROE) in banking industry. As we see that capital in the ASEAN banking are not evenly distributed, Indonesia, Philippine, Singapore, Thailand and Malaysia are countries that have high capital ratio , but not including Vietnam and Laos, but if we see it from the capital growth potential, then Vietnam has become the country that has a very high capital growth in banking industry compared to other ASEAN countries. Therefore, Vietnam has the potential to grow faster than other ASEAN countries. From the views of market shares based on population and number of banks listed on the stock exchange, then Indonesia becomes superior. Singapore doesn’t have many linkages but has the strong power in the amount of asset and capital, so does Malaysia.
RECCOMENDATION
References
Nguyen My, Michael Skully, and Shrimal Perers (2012), Bank market power and revenue diversification: Evidence from selected ASEAN countries, Journal of Asian Economics, 23 (2012) 688–700
Wu Yueh-Cheng, Irene Wei Kiong Ting, Wen-Min Lu, Mohammad Nourani, Qian Long Kweh, (2016), The impact of earnings management on the performance of ASEAN banks,
Economic Modelling, 2016, 53, 156-165
Ahmad Rubi, M. Ariff , and Michael J. Skully The Determinants of Bank Capital Ratios in a Developing Economy, ,Asia-Pacific Finan Markets (2008) 15:255–272
Apendixes
Table 4.1
The Average Value Ratio of Financial Indicators of 7 Banking ASEAN Countries by 2015
No BANK Bank Total
Return on Average Assets % Total Capital Ratio % Net Interest Margin % Cost to Income Ratio % Return on Average Equity %
1 Indonesia 36 1.01 18.22 4.85 72.66 7.19
2 Malaysia 3 1.27 15.90 1.84 39.20 15.66
3 Thailand 8 1.34 16.11 3.42 49.10 13.09
4 Philippine 13 1.46 18.36 4.51 59.00 12.04
5 Singapore 2 1.10 16.40 1.62 40.26 12.34
6 Vietnam 3 0.88 13.65 3.31 66.68 10.23
7 Laos 1 1.79 5.68 4.29 55.38 25.03
Average 1.26 14.90 3.41 54.61 13.65
Source: Proceed Source: Proceed 19.21% 18.42% 21.96% 9.60% 29.44% 1.26% 0.12%
The Proportion of Total Asset
of 7 Banking ASEAN
Countries
Indonesia Malaysia Thailand Philipine
Singapore Vietnam Laos
19.21% 18.42% 21.96% 9.60% 29.44% 1.26% 0.12% 28.52% 15.54% 24.21% 8.94% 21.92% 0.75% 0.12%
0.00% 10.00% 20.00% 30.00% 40.00% Indonesia Malaysia Thailand Philipine Singapore Vietnam Laos
The Proportion of Total Asset
and Net Income for ASEAN
Countries
Table 4.2
Total Assets and Net Income of 7 Banking ASEAN Countries for the End of 2015
No BANK Total Assets Net Income Ratio NI /TA
Percentage of Total Assets
Percentage of Net Income
1 Indonesia 349,560,041 7,225,558 2.07% 19.21% 28.52% 2 Malaysia 335,184,100 3,937,882 1.17% 18.42% 15.54% 3 Thailand 399,652,312 6,133,119 1.53% 21.96% 24.21% 4 Philippines 174,626,138 2,265,473 1.30% 9.60% 8.94% 5 Singapore 535,807,235 5,555,059 1.04% 29.44% 21.92% 6 Vietnam 22,952,933 191,161 0.83% 1.26% 0.75%
7 Laos 2,106,432 29,469 1.40% 0.12% 0.12%
Average 1,819,889,192 25,337,721 1.33% 100.00% 100.00% Source: Proceed, TA is total asset, NI is Net Income.
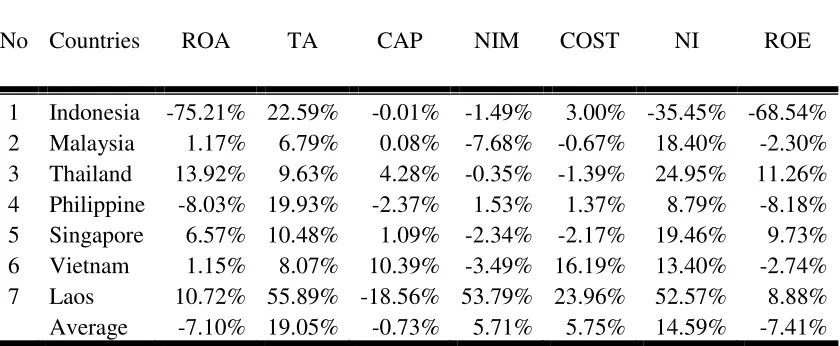
Table 4.3
The average level of growth in Financial Indicators 7 Banking ASEAN Countries over 2012-2015
No Countries ROA TA CAP NIM COST NI ROE
1 Indonesia -75.21% 22.59% -0.01% -1.49% 3.00% -35.45% -68.54% 2 Malaysia 1.17% 6.79% 0.08% -7.68% -0.67% 18.40% -2.30% 3 Thailand 13.92% 9.63% 4.28% -0.35% -1.39% 24.95% 11.26% 4 Philippine -8.03% 19.93% -2.37% 1.53% 1.37% 8.79% -8.18% 5 Singapore 6.57% 10.48% 1.09% -2.34% -2.17% 19.46% 9.73% 6 Vietnam 1.15% 8.07% 10.39% -3.49% 16.19% 13.40% -2.74% 7 Laos 10.72% 55.89% -18.56% 53.79% 23.96% 52.57% 8.88% Average -7.10% 19.05% -0.73% 5.71% 5.75% 14.59% -7.41% Source: Proceed, ROA is return on asset, TA is total asset, Cap is total capital ratio, NIM is
[image:13.595.98.518.456.629.2]Source: Proceed
Table 4.4
Descriptive Statistics of
Financial Indicators 7 Banking ASEAN
Variable Obs. Mean Std. Dev. Min Max
ROA 264 1.42 1.17 -7.62 4.86
TA 264 2.47e+07 4.75e+07 27.728.14 3.04e+08
CAP 264 18.83 10.41 5.68 87.49
NIM 264 4.55 2.17 0.60 17.08
COST 264 59.91 26.66 27.85 368.96
NI 264 352.026.9 607.185.5 -93.198.79 3.484.185
ROE 264 12.32 11.09 -86.75 34.89
Source: Proceed, ROA is return on asset, TA is total asset, Cap is total capital ratio, NIM is net interest margin, COST is cost to income ratio, NI is net income and ROE is return on equity
-75.21% 1.17% 13.92% -8.03% 6.57% 1.15% 10.72% 22.59% 6.79% 9.63% 19.93% 10.48% 8.07% 55.89% -0.01% 0.08% 4.28% -2.37% 1.09% 10.39% -18.56% -35.45% 18.40% 24.95% 8.79% 19.46% 13.40% 52.57% -68.54% -2.30% 11.26% -8.18% 9.73% -2.74% 8.88%
-100.00%-80.00% -60.00% -40.00% -20.00% 0.00% 20.00% 40.00% 60.00% 80.00% Indonesia Malaysia Thailand Philipine Singapore Vietnam Laos
The average Growth of ROA, ROE, TA, NI,
Capital, Cost, NIM and NI of 7 Banking
ASEAN Countries
Table 5.5
Correlation Matrix of Financial Indicators of 7 Banking ASEAN Countries
ROA TA CAP NIM COST N1 ROE
ROA 1
TA1 0.05 1
CAP -0.03 -0.13 1
NIM 0.26 -0.33 0.06 1
COST -0.71 -0.28 0.13 0.03 1
N1 0.21 0.92 -0.15 -0.21 -0.33 1
ROE 0.91 0.15 -0.18 0.11 -0.74 0.28 1
Table 5.6
Panel Regression of Financial Indicators of 7 Banking ASEAN Countries
ROAit= at+ b1tNIM + b2tCOST + b3tCAP + b4tNI + e
ROEit= at+ b1tNIM + b2tCOST + b3tCAP + b4tNI + e
ROA ROA ROA ROE ROE ROE
ROA - - -
-ROE - - -
-NIM 0.153*** 0.153*** 0.181*** 0.796*** 0.789*** 1.753***
COST -0.028*** -0.027*** -0.022*** -0.290*** -0.291*** -0.235***
CAP 0.006 0.006 0.010 -0.090* -0.090* -0.089
NI 1.58E-07 1.63E-07 0.000* 1.39E-06 1.36E-06 5.66E-06
TA - - -
-Constant 2.206*** 2.189*** 1.487*** 27.291*** 27.391
R-sq 0.360*** - 0.371*** 0.332*** - 0.348***
Log Likelihood - -284.962*** - - -894.462***
Random-effects
GLS Regression
Random-effects ML
regression
Fixed-effects (within) regression
Random-effects
GLS Regression
Random-effects ML
regression
Fixed-effects (within) regression
Table 5.7
Panel Regression of Financial Indicators of 7 Banking ASEAN Countries
ROAit= at+ b1tNIM + b2tCOST + b3tCAP + b5tTA + e
ROEit= at+ b1tNIM + b2tCOST + b3tCAP + b5tTA + e
ROA ROA ROA ROE ROE ROE
ROA - - -
-ROE - - -
-NIM 0.138*** 0.138*** 0.179*** 0.684*** 0.677*** 1.735***
COST -0.030*** -0.029*** -0.022*** -0.302*** -0.303*** -0.238***
CAP 0.005 0.005 0.010 -0.099** -0.099** -0.086
NI - - -
-TA -1.08E-09 -1.03E-09 1.22E-11 -5.05E-09 -5.31E-09 7.45E-09
Constant 2.462*** 2.439*** 1.723*** 29.286*** 29.379*** 20.152***
R-sq 0.352*** - 0.360*** 0.326*** - 0.340***
Log Likelihood - -285.811*** - - -895.580***
Random-effects
GLS Regression
Random-effects ML
regression
Fixed-effects (within) regression
Random-effects
GLS Regression
Random-effects ML
regression
Table 5.8
Instrumental Variable (IV) of Panel Data Regression of Financial Indicators of 7 Banking ASEAN Countries
Two equation for first Model
ROAit = at+ b1tROE + b1tNIM + b2tCOST + b3tCAP + e; ROEit= at + b1tROA + b1tNI +
b2tNIM + b3tCOST + b4tCAP + e
Two equation for second Model
ROEit= at+ b1tROA + b2tNIM + b3tCOST + b4tCAP + e; ROAit= at+ b1tROE + b1tNI
+b2tNIM + b3tCOST + b4tCAP + e
Fixed-effects (within) IV regression G2SLS random-effects IV regression
ROA ROE ROA ROE
ROA - 9.455*** - 9.627***
- (2.133) - (1.913)
ROE 0.106*** - 0.101***
-(0.024) - (0.021)
-NIM -0.004 0.041 0.020 -0.042
(0.047) (0.434) (0.034) (0.376)
COST 0.003 -0.031 0.002 -0.027
(0.006) (0.048) (0.005) (0.043) CAP 0.019*** -0.184*** 0.018*** -0.184*** (0.004) (0.039) (0.003) (0.033)
TA - - -
-- - -
-Constant -0.431 4.070 -0.380 3.967
(0.509) (3.944) (0.491) (3.836)
R-sq 0.886*** 0.914*** 0.916*** 0.918***
Instrumented ROE ROA ROE ROA
Instruments NIM NIM NIM NIM
COST COST COST COST
CAP CAP CAP CAP
NI NI NI NI