Abstract—In this paper, a technique for identifying the phase with fault appearance in underground cable is presented. The Wavelet transform has been employed to extract high frequency components superimposed on fault signals simulated using ATP/EMTP. The coefficients obtained from the Wavelet transform are used in constructing a decision algorithm. Various cases have been investigated so that the algorithm can be implemented. It is found that the proposed method can indicate the fault types with satisfactory accuracy.
Index Terms—Wavelet Transform, Fault Types, Underground Cable, ATP/EMTP.
I. INTRODUCTION
When faults occur in the transmission and distribution systems, it is important to clear fault from the power system as soon as possible in order that transmission line can reconnect with power system. In previous decade, the development in the algorithm for detecting the faults on the transmission lines has been progressed and results in transient based techniques. In order that the transient based protection can be accurately successful in operation, the application of wavelet transform is employed. In several research papers, the fault classification or the phase with fault appearance can be obtained from employing trial and error method [1-3] or from the artificial intelligent decision algorithms [4-7]. However, most research works have only considered in the fault diagnosis for overhead transmission and distribution systems while research work rarely mention about the fault diagnosis in underground distribution system. The techniques to detect and determine the fault location in underground distribution system are discussed in several research papers [8-9] but the types of fault and the phase with fault appearance are as important as fault location. As a result, it is useful if the fault types in the underground distribution system can be identified using wavelet transform.
Hence, the objective of this paper is to present an application of Wavelet transform and a decision algorithm in order to identify the types of fault in underground cable. The simulations, analysis and diagnosis are performed using ATP/EMTP and MATLAB. It is noted that the discrete wavelet transform is employed in extracting the high frequency component contained in the fault currents and the coefficients of the first scale from the Wavelet transformer are investigated. The comparison of the coefficients is
Manuscript received January 11, 2010. This work was supported in part by the faculty of engineering, King Mongkut’s Institute of Technology Ladkrabang (KMITL).
C. Apisit and A. Ngaopitakkul are with Faculty of Engineering, King Mongkut’s Institute of Technology Ladkrabang, Bangkok 10520, Thailand (e-mail: [email protected]).
investigated and used in the construction of the decision algorithm.
II. WAVELET TRANSFORM
Wavelet transform is a mathematical technique used in signal analysis. The advantage of the transform is that the band of analysis can be fine adjusted so that high frequency components and low frequency components can be detected precisely. Results obtained from the wavelet transform are shown on both the time domain and the frequency domain. The wavelet transform which has a change in the analysis scale by the factor of two is called discrete wavelet transform (DWT) as in Equation 1 [5].
(
)
∑
( )
⎥ ⎥ ⎦ ⎤ ⎢
⎢ ⎣ ⎡ − =
k
m m
m
k n k f n
m DWT
2 2
2 1
, ψ (1)
where,
⎥ ⎥ ⎦ ⎤ ⎢
⎢ ⎣ ⎡ −
m m k n
2 2
ψ = mother wavelet
III. SIMULATION
The ATP/EMTP [5-7] is employed to simulate fault signals, at a sampling rate 200 kHz. The system employed in case studies is chosen based on the underground distribution system as illustrated in Figure 1. In addition, a cross-sectional view of a cable is shown in Figure 2. To avoid complexity the fault resistance is assumed to be 10Ω. Fault patterns in the simulations are performed with various changes of system parameters as follows:
- Fault types are under consideration, namely: single phase to ground (SLG), double-line to ground (DLG), line to line (L-L) and three-phase fault (3-P).
- Fault locations on the underground distribution system are the distance of 1, 8, 27 km measured from the sending end.
- Inception angle on a voltage waveform is varied between 0°-180° , with the increasing step of 30°. Phase A is used as a reference.
Figure 1. The system used in simulation studies
Identification of Fault Types for Underground
Cable using Discrete Wavelet Transform
Figure 2. The configuration of cable in simulation studies
The example of ATP/EMTP simulated fault signals is illustrated in Figure 3. This is a fault occurring with phase A to ground fault at 8 km measured from the sending bus as depicted in Figure 1. The fault signals generated using ATP/EMTP are interfaced to the MATLAB for the fault detection algorithm.
Figure 3. Example of ATP/EMTP simulated fault signals for AG fault at sending end.
IV. DECISION ALGORITHM
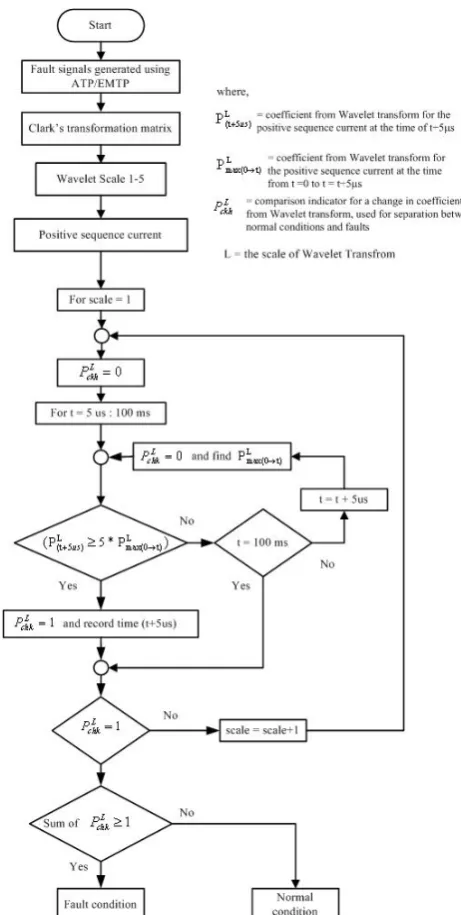
Fault detection decision algorithm is processed using positive sequence current signal. Fault signals generated using PSCAD/EMTDC are imported to the MATLAB/Simulink in order to analyse the high frequency transient components, which are superimposed in the fault current signals, by DWT using the wavelet toolbox. The Clark’s transformation matrix is employed for calculating the positive sequence and zero sequence of currents. With several trial and error processes, the fault detection decision algorithm on the basis of computer programming technique is constructed as shown in Figure 4. The mother wavelet
[image:2.595.304.535.58.516.2]
Figure 4. Flowchart for fault detection.
[image:2.595.48.284.296.570.2]Sc ale 1 Sc ale 2 Sc ale 3 Sc ale 4 Sc ale 5 (A )
Figure 5 Wavelet transform from scale 1 to 5 for the positive sequence of current signal shown in Figure 3.
From Figure 5, the coefficients in all scale of the wavelet transform are clearly changed then it presumes that these signals are fault condition. After the fault detection process, the comparison of the coefficients from first scale that can detect fault is considered so that the types of fault can be analysed. The most appropriate algorithm for the decision algorithm can be concluded as follows:
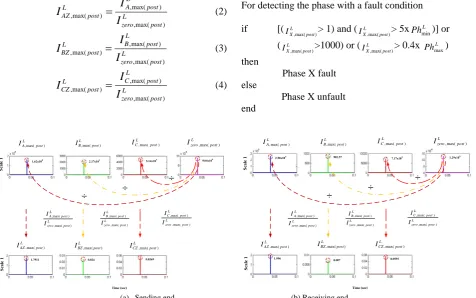
The division algorithm between the maximum coefficients of DWT at ¼ cycle of phase A, B, C are performed as shown in Equation 2-4.
L post zero L post A L post AZ
I
I
I
) max( , ) max( , ) max(,
=
(2)L post zero L post B L post BZ
I
I
I
) max( , ) max( , ) max(,
=
(3)L post zero L post C L post CZ
I
I
I
) max( , ) max( , ) max(,
=
(4)where, L = the scale of wavelet transform that can detect fault.
L (post) max A,
I
= maximum coefficient from Wavelettransform at ¼ cycles of phase A for post-fault current L
(post) max B,
I
= maximum coefficient from Wavelettransform at ¼ cycles of phase B for post-fault current L
(post) max C,
I
= maximum coefficient from Wavelettransform at ¼ cycles of phase C for post-fault current L
(post) max zero,
I = maximum coefficient from Wavelet
transform of zero sequence current at the time of ¼ cycles after detecting faults
L post AZ
I ,max( )= maximum ratio obtained from division algorithm between
I
A,Lmax (post) and Izero,L max (post)L post BZ
I ,max( )= maximum ratio obtained from division algorithm between
I
B,Lmax (post) and Izero,L max (post)L post CZ
I ,max( )= maximum ratio obtained from division algorithm between
I
C,Lmax (post) andL
(post) max zero,
I
From Figure 6, it is shown that maximum ratio obtained from division algorithm is calculated. For identifying the phase with fault appearance, the comparisons of the maximum ratio obtained from division algorithm have been performed as follows:
For detecting the phase with a fault condition if [( L
post X
I ,max( )> 1) and ( L
post X
I ,max( )> 5x
L
Phmin)] or ( L
post X
I ,max( )>1000) or ( L
post X
I ,max( )> 0.4x L Phmax) then
Phase X fault else
Phase X unfault end
÷
÷
÷
L post AI ,max( )
L post B
I ,max( )
L post C
I ,max( ) L
post zero
I ,max( )
Scale 1 L post zero L post A I I ) max( , ) max( , L post zero L post B I I ) max( , ) max( , L post zero L post C I I ) max( , ) max( , Sc ale 1 L post AZ
I ,max( )
L post BZ
I ,max( )
L post CZ
I ,max( )
1.7911 0.024 0.0569
1.62x10⁵ 2.17x10³ 5.14x10³ 9.04x10⁴
Time (sec)
÷
÷
÷
L post AI ,max( )
L post B
I ,max( )
L post C
I ,max( )
L post zero
I ,max( )
L post zero L post A I I ) max( , ) max( , L post zero L post B I I ) max( , ) max( , L post zero L post C I I ) max( , ) max( , Sca le 1 L post AZ
I ,max( )
L post BZ
I ,max( ) L
post CZ
I ,max( )
Time (sec) 1.996
Scale 1
0.007 0.0555
2.58x10⁵ 901.57 7.17x10³ 1.29x10⁵
[image:3.595.63.540.439.737.2]TABLE 1 Result for detecting types of faults at sending end
Phase A Phase B Phase C Zero sequence Result
Max (post)
L post AZ
I ,max( ) Max
(post) L
post BZ
I ,max( ) Max
(post) L
post CZ
I ,max( ) Max
(pre)
Max (post)
L
Phmax
L
Phmin Sending end
1.62x10⁵ 1.7911 2.17x10³ 0.024 5.14x10³ 0.0569 3.2x10⁻⁵ 9.0x10⁴ 1.62x10⁵ 2.17x10³ AG
TABLE 2 Result for detecting types of faults at receiving end
Phase A Phase B Phase C Zero sequence Result
Max (post)
L post AZ
I ,max( ) Max
(post) L
post BZ
I ,max( ) Max
(post) L
post CZ
I ,max( ) Max (pre)
Max (post)
L
Phmax
L
Phmin Receiving end
[image:4.595.65.527.63.284.2]2.58x10⁵ 1.196 901.57 0.007 7.17x10³ 0.0555 8.5x10⁻⁴ 1.3x10⁵ 2.58x10⁵ 901.57 AG
Table 3 Percentage average accuracy for fault types
where, L
post X
I ,max( ) = maximum value obtained from division algorithm ( L
X
I = L
AZ
I , L
BZ
I and L CZ
I respectively)
L
Phmax = the maximum value obtained form comparing among
L post AZ
I ,max( ), IBZL ,max(post) and ICZL ,max(post)
L
Phmin = the minimum value obtained form comparing among
L post AZ
I ,max( ), IBZL ,max(post) and
L post CZ
I ,max( )
In addition, for detecting the zero sequence current with a fault condition
If
(
zero,L max (pre))
L(post) max
zero, 5 I
I ≥ ×
then
Ground fault else
Unground fault end
where, L
(pre) max zero,
I = maximum coefficient from Wavelet
transform of zero sequence current at the time of ¼ cycles before the inception of faults
Results illustrated from Tables 1 to 2 are obtained from one case of phase A to ground fault. Case studies are varied so that the decision algorithm capability can be verified. Various case studies are performed with various types of faults at each location in the underground cable including the variation of fault inception angles. The results are shown that the average accuracy of fault type from the decision algorithm proposed in this paper is highly satisfactory as shown in Table 3.
V. CONCLUSION
The applications of the discrete wavelet transform (DWT) for identifying the phase with fault appearance along the underground cable distribution system have been investigated in this paper. Daubechies4 (db4) is employed as mother wavelet in order to decompose high frequency components from fault signals. Coefficients of positive sequence current signals are calculated and employed in fault detection decision algorithm. By performing many simulations, the result is found that the fault detection decision algorithm can detect fault with the accuracy of 100% using scale 1 only. The maximum coefficients details (cD1) in scale 1 at ¼ cycle of phase A, B, C and zero sequence for post-fault currents waveforms are used in constructing a decision algorithm. Various case studies have been studied including the variation of fault inception angles, different locations in cable and various types of faults. The results are shown that the proposed algorithm can indicate fault types with the accuracy higher than 90%. The further work will be improvement the overall accuracy so that the higher precision can be achieved.
ACKNOWLEDGEMENTS
The authors wish to gratefully acknowledge financial support for this research by the faculty of engineering, King Mongkut’s Institute of Technology Ladkrabang (KMITL), Thailand.
REFERENCES
[1] P. M. Silveira, R. Seara and H. H. Zurn, “An Approach Using Wavelet transforms for Fault Type Identification in Digital Relaying,.” IEEE Power Engineering Society Summer Meeting 1999, Vol. 2, July 1999, pp. 937-942.
[2] Omar A.S. Youssef “Fault Classification Based On Wavelet Transforms” IEEE IEEE/PES Transmission and Distribution Conference and Exposition, October 2001, Vol. 1, pp. 531-538. [3] P. Makming, S. Bunjongjit, A. Kunakorn, S. Jiriwibhakorn and M.
Kando ‘Fault diagnosis in transmission lines using wavelet transforms’ IEEE Transmission and Distribution Conference, Yokohama, Japan, October 2002, pp. 2246-2250.
Fault type Fault Location
(Distance measured from the sending end)
Number of
case studies SLG DLG LL 3-P
1 km 8 km 27 km
28 28 28
100% 100% 100%
71.4% 71.4% 71.4%
85.7% 100% 100%
85.7% 100% 100%
[5] P. Chiradeja and A. Ngaopitakkul, “Identification of Fault Types for Single Circuit Transmission Line using Discrete Wavelet Transforms and Artificial Neural Networks,” The International Multi-Conference of Engineers and Computer Scientists 2009 (IMECS2009), Hongkong, China, pp. 1520 – 1525, 18-20March 2009.
[6] C. Pothisarn, and A. Ngaopitakkul, “Discrete Wavelet Transform and Back-propagation Neural Networks Algorithm for Fault Classification on Transmission Line” In Proceedings of IEEE International Conference on Transmission and Distribution (T&D Asia 2009),
Korea, October 2009.
[7] Pathomthat Chiradeja and Chaichan Pothisarn “Discrete Wavelet Transform and Fuzzy Logic Algorithm for Identification of Fault Types on Transmission Line” International Conference (APSCOM2009), November 2009.
[8] El Sayed Tag El Din, Mahmoud Gilany, Mohamed Mamdouh Abdel Aziz, Doaa khalil Ibrahim “A wavelet base fault location technique for aged power cables” in IEEE Power Engineering Society, Vol.3, pp.2485-2491, 12-16 June 2005.
[9] M.S. Choi, D.S. Lee, and X. Yang, “A line to ground fault location algorithm for underground cable system,” KIEE International Transactions on Power Engineering, Vol. 54, pp. 267–273, Jun. 2005.
BIOGRAPHIES
Choawat Apisit graduated with B.Eng in electrical engineering from King Mongkut’s Institute of Technology Laddrabang, Bangkok, Thailand in 2009. He is currently a M.Eng. candidate at the Faculty of Engineering, King Mongkut’s Institute of Technology Ladkrabang. His research interests are in power system analysis.