Organizational Factors to the Effectiveness of
Implementing Servitization Strategy
Zahir Ahamed, Akira Kamoshida, Takehiro Inohara
Graduate School of Decision Science and Technology, Tokyo Institute of Technology, Tokyo, Japan. Email: [email protected]
Received March 1st, 2013; revised April 3rd, 2013; accepted April 10th, 2013
Copyright © 2013 Zahir Ahamed et al. This is an open access article distributed under the Creative Commons Attribution License, which permits unrestricted use, distribution, and reproduction in any medium, provided the original work is properly cited.
ABSTRACT
It has been recognized that in today’s highly competitive industrial markets, servitization is one of the key strategic choices for many leading manufacturers to gain differentiation from competitors by offering value-added services. To do so, however, requires a service-oriented strategy and the active implementation of this strategy, which comprises a significant shift in the underlying business model, management philosophy and approach. Unfortunately, there has no study examined the organization factors specific to the issues of servitization strategy. Therefore, this paper aims to examine the influence of organization factors on the effectiveness of implementing servitization strategy. Data was col- lected from three multinational electronics/ICT firms in Japan, respectively, Fujitsu, Toshiba, and Hitachi limited (FTH). Organization answer to a survey included multiple choices and open questions about the perception, process, barriers, and the important factors of implementing servitization strategy. The study result revealed that there were significantly positive influences of organizational factors, such as leadership (17.2%), vision (16.3%, and marketing (9.5%), on the effectiveness of implementing servitization strategy.
Keywords: Servitization; Service Design; Strategy Implementation; Organizational factors; Case Study
1. Introduction
Recently, it has been observed a significant trend in manufacturing industry that the firms are shifting their business from not only producing goods to offering an integrated package of goods and services. This move-ment has been termed as “servitization of business”. The concept first introduced by Vandermerwe and Rada [1], is now widely recognized as the process of creating value by adding services to products. Since the late 1980s, the adoption of this concept as a competitive business strat-egy of manufacturing firm has been studied by range of authors [2-5] who have highly focused on developing the process and its implications in product saturated market. This literature indicates a growing interest in this topic by academia, business and government [6], much of which is based on a belief that a move towards servitiza- tion is a means to create additional value adding capa- bilities for traditional manufacturers. As a result, today many leading companies embrace this concept as a ser- vice-led competitive strategy, environmental sustainabil- ity, and the basis to differentiate them from competitors who simply offer lower priced products.
Traditionally services provided by manufacturing or- ganizations have typically been in the form of after-sales. Services such as installation, maintenance and repair have therefore generally been viewed as complementary to the primary business focus on selling products [7]. Hence, services have conventionally been considered as necessary add-ons to the core product portfolio. The more contemporary view is that manufacturing compa- nies need to move towards a more extensive provision of services to remain its competitiveness in the current mar- ketplace [3,8,9]. The rationale for developing service operations, extending the services business and integrat- ing products and services can be summarized by follow- ing view points that drive companies to pursue a serviti- zation strategy; namely, financial, strategic, economic, marketing and environments:
2) Strategic Advantages: Service addition helps the firm differentiate from competition, aids the consolidation and protection of the core product businesses, and es- tablishes intimate relationships with clients. Since ser- vices are more labor dependent and less visible ren- dering them more difficult to imitate, and hence a source of sustainable competitive advantage [3,9]. 3) Economic Pressure: Service roles in manufacturing
sector are growing rapidly, as increased the share of services activities are necessary to produce goods [17, 18]. Also, the de-industrialization and increasing in- ternational division of labor between manufacturing and services led to the declining shares of manufac-turing in developed economies.
4) Marketing Opportunities: Service component has great influence on purchasing decision and tend to in- duce repeat-sales, and by intensifying contact oppor- tunities with the customer, can put the supplier in the right position to offer other products or services [16, 19].
5) Environmental Rationale: Services make sure the use of resources more rationally and proper way [20]. Thus, by offering services, companies can gain insight into their customers’ needs and are able to develop more tailored offerings which in long-run creates values for organizations. It has been observed in successful cases that organizations such as IBM, General Electric, Fujitsu, Siemens, Cannon and Hitachi have had a significant share of revenues and profits from services since they transformed into services operation in mid 1990s or/and in the early millenniums. Oliva and Kallenberg [3], Araujo and Spring [10] and Davies [21] argue that during this transformation to a combined product-service offer-ing, organizations are likely to change their strategies, operations and value chains, technologies, people exper-tise and system integration capabilities. However, the transformation paths from product-centric strategy to a combined product-service strategy are still poorly under- stood and remain a new and complex concept [12,22,23]. Hence, the purpose of this paper is to seek the influence of organizational factors experienced by Japanese manu-facturing firms toward an implementing servitization strategy.
In this study we aimed at exploring the tendency of Japanese electronic/ICT firms toward servitization, and identifying factors that influence to the effectiveness of implementing servitization strategy. The main study ma- terials were gathered with the help of questionnaire, dis- cussion, and observations of three giant electronics/ICT companies in Japan, namely, Fujitsu, Toshiba, and Hi- tachi limited (FTH). The structure of this paper is as fol- lows: after this introduction section research background and hypothesis is presented. Section 3 describes the re- search methodology was used in this paper. This is fol-
lowed by Section 4, which verifies and analyzes the fac- tors that influence on implementing servitization strategy by using path analysis. The next section we articulate the output of the results and presented the degree of influ- ence toward servitization strategy. Section 6 concludes the paper with summary and gives suggestions for the future research in the field of servitization of business.
2. Towards Servitization of Business
2.1. Background
Today, manufacturing industries, especially high-tech firms are under massive pressure and realize the difficul- ties to achieve their desired profit from only selling goods, which forces them to respond by moving up value chain, seeking to innovate and create more sophisticated products and services so that they do not have to compete on the basis of cost alone [24]. In these circumstances, the concept of servitization becomes an increasingly re-levant strategy for manufacturing firms in developed economies to improve their competitive advantage in the market. Many manufacturers offer services, but may not use services as the basis of their competitive strategy. Servitization is defined as the strategic innovation of organization’s capabilities and processes to shift from selling products to selling an integrated product and ser-vice offering that delivers value in use [1,25]. There are various forms of servitization such as the Tukker [22] proposes. They range from products with services as an “add-on”, to services with tangible goods. They tend to be delivered using customer-centric strategies in order to provide “desired outcomes for the customer. According to Oliva and Kallenberg [3], customer orientation con- sists of two distinctive elements; first, a shift of the ser- vice offering from product-oriented service to “user’s process oriented services” (i.e., a shift from a focus on ensuring the proper functioning and/or customer’s use of the product to pursuing efficiency and effectiveness of end-user’s processes related to the product), and second, a shift of the nature of the customer interaction from transaction-based to relationship-based (i.e., a shift from selling products to establishing and maintaining a rela- tionship with the customer). In other words, both a trans- fer from the old transaction-based mode of service to continuous connection with the customer and a shift to- wards process-oriented services for end-users instead of physical goods efficacy is required.
organizational principles, structures, and processes. Wise and Baumgartner [2], Oliva and Kallenberg [3] and Weeks [25] claimed that to implement a servitization strategy successfully, organizations are required to change their strategies, operations and value chains, technologies, peoples for supporting cultural shifts in the organizational blueprint, and system integration capabili-ties. However, commentators have also suggested that companies need to maintain a constant flow of innova- tion, not only in terms of what is offered to the customer, but also in how products and services are designed, pro- duced, delivered, and marketed [26,27]. Based on the previous studies, it is observed that while there is a sig-nificant literature, theoretical models, and discussions available in the general field of organizational success factors, there are no models or study related to the spe-cific issues of organizational success toward implement-ing servitization strategy. Thus, this research is tryimplement-ing to identify the influential factors of organization, which has significantly positive impact on implementing servitiza-tion strategy.
2.2. Hypothesis
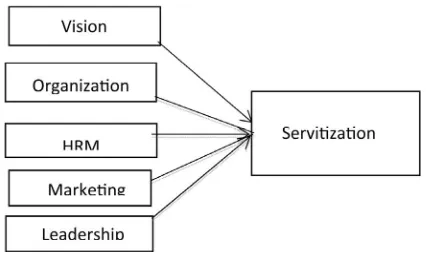
This research hypothesizes that the implementing ser-vitization strategy required a collaborative support of many organizational forces, which is implicitly or explic-itly influence on building firm product-service operations or along with the change of company’s new directions. Based on a comprehensive list of organizational factors from related studies [28-34], five organizational factors that influence on implementing servitization strategy are identified to use in this study. The five factors are vision, organization, human resource, leadership, and marketing as shown in Figure1.
Based on the review of the literature on the five di-mension related to the implementation of servitization strategy, the following hypotheses are presented:
[image:3.595.66.279.572.699.2]H1: Vision has a significantly positive influence on implementing servitization strategy.
Figure 1. Structural model exploring the influence of or-ganizational vision, organization, human resource, leader-ship, and marketing on implementing servitization strategy.
H2: Organization has a significantly positive influence on implementing servitization strategy.
H3: Human resources have significantly positive in- fluence on implementing servitization strategy.
H4: Marketing has a significantly positive influence on implementing servitization strategy.
H5: Leadership has a significantly positive influence on implementing servitization strategy.
3. Methodology
3.1. Data Collection
A self-administered questionnaire was used to measure the factors under the investigation. Prior to the actual distribution of the questionnaire, a discussions and pilot study were conducted with the engagement of the firm over two months period. This helps the authors to explain the objective of questionnaire to the respondents and ensure the consistency and clarity of the questions asked which resulted in the questionnaires being refined and rephrased accordingly. The questionnaires were also translated to the native language (Japanese Language) for better understanding who were less expert in English.
The questionnaires were then distributed to the em-ployees of three multinational Japanese electronic/ICT firms, referred to as Fujitsu, Toshiba, and Hitachi (FTH), which can be qualified in its industry as a medium or large size companies with yearly sales of JPY 4467 bil-lion, 6100 bilbil-lion, and 9665 billion (FY 2012) respec-tively [35-37]. The selection of these companies were a critical task for this study, as we sought to investigate the hi-tech manufacturing firms who have a track record of successful provision of product related services. For this reason, we have adopted a purposive sampling strategy and selected Japan based original hi-technology products manufacturer that designs and manufactures high-value electronics/IT goods for the business enterprise, govern-ment and consumer market as well. A significant trend of these three companies movement toward servitization of business is explained in the following as case 1 (Fujitsu), case 2 (Toshiba), and case 3 (Hitachi):
Case 1: Fujitsu limited, a leading Japanese information and communication technology (ICT) firm was estab-lished in 1935, as the manufacturing subsidiary of Fuji Electric limited. At the beginning of the journey, com-pany started to produce telephone and automotive ex-change equipment and steadily expanded its activities in producing computers, semiconductors, and telecommu-nications equipment and so on. Historically, Fujitsu was best known as the world’s number 2 maker of mainframe computers, just behind IBM, but they exited from that market at the turn of the millennium to focus its hard-ware efforts on Unix-based servers, personal computers, and peripherals. In the early 21st century, however, the
as an internet-centered company, and generating in-creasing amounts of revenues from services and software. The later, which included such areas as system integra-tion services, front-end technologies, outsourcing ser-vices, network serser-vices, system support serser-vices, security solutions and consulting services. As a result, they achieved over 50 percent of revenues from the provision of services that are closely coupled to its products. The company has made a significant progress and is at a rela-tively advanced stage of servitization for a traditional manufacturer. This was confirmed by the portfolio strat-egy and marketing president who acknowledged that, “at the interfaces between the company and customers, I think we are now seeing far more evidence of responsive agile service-centered behavior and solution oriented to the customers, so that, today we recognized as the Ja-pan’s number 1 and world’s 3rd largest IT service
pro-vider in the industry”.
Case 2: Toshiba, a world leader in high technology, is a diversified Japanese manufacturer and marketer of ad-vanced electronic and electrical products, spanning in-formation & communications equipment and systems, internet-based solutions and services, electronic compo-nents and materials, power systems, industrial and social infrastructure systems, and household appliances. Under the management vision of “Innovation-driven, customer- focused growth”, the key objective of the Toshiba is to provide total utmost satisfaction to customers worldwide through leading-edge products and top-of-the-line ser-vices. In realizing this objective, company started to transform its business structure from not only product- centric to product-service-centric organization and stren- gthening such focus businesses as integrated storage so- lutions, retail solutions, home solutions, health care ser-vices and solutions, and so on. In order to offer these wide ranges of solutions to such business, pursuing technology development, Toshiba realizing the impor- tance of M&A investments and established new business alliances. In addition, the firm continuing speed up the pace of innovation by nurturing the buds for next genera- tion business development and creating exciting new values through the introduction of World’s First and ex- pansion of World’s No.1 products and services in the global market.
Case 3: Hitachi is a traditional manufacturing firm of-ten called the General Electric of Japan, and is in fact considered to be one of the “Big Five” sogo denki or general electric companies in Japan. The company bal-anced its portfolio of business activities predominantly in the field of electronics and electrical engineering that renowned the Hitachi as a giant manufacturer in the in-dustry. However, in the middle part of the last decade, company realizes a significant change in the market de-mand, increasing customer expectations for reliable and
high quality services, cutthroat competition, and a thin profit margin of manufacturing goods that calculated only 2% of total revenues compared to more than 7% from maintenance services. In these circumstances, Hi-tachi started to shift its operations from not only produc-ing or sellproduc-ing goods to offerproduc-ing an integrated package of goods and services, even they already had hardware de-pend services approximately 30 years ago like, mainte-nances. So, in extend to service provision with core busi-ness, company added non-hardware (Service ware) de-pend services including operation management systems, staffing, training, consulting, and solutions, etc. and ex-pected to gain 7% to 8% profit from combination of goods and services (Senior marketing manager). Of par-ticular interest is the way in which the company is fre-quently held to be an exemplar of the trend towards ser-vitization of business [21,38,39].
The questionnaire for this study consisted of 30 items, there were 25 items divided into five dimensions based on the literature review as mentioned before and other 5 items were about the questions of servitization strategy. A total of 100 questionnaires were distributed, and 57 were returned giving a response rate of 57%. The re-spondents’ background ranges from diverse functional areas including, planning and decision making, research and development, portfolio strategy and marketing unit, finance and human resource, business development unit, service design and engineering and so on. The majority of the respondents (70%) occupy managerial rank or higher-level positions. The proportion in this rank in-cludes HR managers, sales and marketing managers, ser-vice engineers, operational managers, ubiquitous manag-ers and senior managmanag-ers. The other 30% of the respon-dents belong to the top-level management. They are the marketing directors, vice president of portfolio strategy, senior consultants, and CEO. The use of respondents from different backgrounds allowed different avenues of inquiry to be pursued in the data collection [40]. The questionnaire focused on determining the influence or-ganizational factors on implementing servitization strat-egy. Subjects were asked to assess their perceptions of various items of different constructs about the factors of organization and servitization strategy. Assessment were based on a five-point Likert scale ranging from 1 = strongly disagreed to 5 = strongly agreed the participants indicated to what degree they observed the reasons as important. Measures were adapted from [41].
3.2. Data Analysis and Procedure
vari-ables is higher than 0.8, satisfying a minimum require-ment of 0.6. This suggests that the questionnaire and its variables are reliable for the intended study.
According to the above Table 1, it is clear that we can use all variables for the further statistical analysis, i.e., path analysis, which we conduct in Section 4.
4. Path Analysis
To verify the influence of organizational factors on im-plementing servitization strategy, a path model linking vision (V), organization (O), human resource manage-ment (H), marketing (M), and leadership (L) with ser-vitization (S) is tested using a series of regression analy-sis in SPSS (PASW 18.0). The following path diagram in Figure 2 is representing a proposed hypothetical model involving five variables.
Figure 2 indicates that the path diagram consists of a substructure, which contains five exogenous variables V, O, H, M, L and an endogenous variable S. Therefore, the structural equation from above path diagram is as fol- lows:
SV SO SH SM SL
S V O H M L.
According to the structural equation, servitization is influenced by five exogenous variables V, O, H, M, and L. We will investigate how these variables V, O, H, M, and L are influenced to the implementation of servitization strategy.
Figure 2. Structural relationship between V, O, H, M, L and S.
Table 1. Reliability test results of the independent variables.
Variables Items Cronbach’s Alpha
Vision 5 0.899
Organization 5 0.897
HRM 5 0.898
Marketing 5 0.896
Leadership 5 0.898
4.1. Correlations
First, we investigate the correlations of each variable V, O, H, M, and L to S. Based on the data, the correlations matrix between variables has been obtained by using SPSS version 18.0 (PASW). The output of the result is shown in Table 2.
Based on Table 2, for example, the correlation be-tween organization and servitization is 0.379. From Ta-ble 2, the variable which have high correlation is vision, i.e., 0.638.
4.2. Regression
Here are the tests for the predictors’ goodness of the fit of the regression model and regression equation.
In Table 3, the is 0.577. This suggests that there is 57.7% goodness of fit of the model produced by the regression equation. From , we can calculate the path coefficient for others variable, which is not included in our model. Thus,
2 R
2 R
1 0.577 0.650 S
In Table 4, ANOVA tested the hypothesis that there is a linear relationship between the predictors and the de- pendent variable. F is the ratio of the mean square for regression to the mean square for the residual. In Table 3, when all predictors were entered, the significance level
.
Table 2. Correlations between variables.
S V O H M L
Pearson
Correlation 1 0.638 0.379 0.383 0.547 0.629
Sig. (1-tailed) 0.000 0.002 0.002 0.000 0.000
S
N 57 57 57 57 57 57
Pearson
Correlation 0.638 1 0.451 0.299 0.437 0.532
Sig. (1-tailed) 0.000 0.000 0.012 0.000 0.000
V
N 57 57 57 57 57 57
Pearson
Correlation 0.379 0.451 1 0.416 0.353 0.348
Sig. (1-tailed) 0.002 0.000 0.001 0.004 0.004
O
N 57 57 57 57 57 57
Pearson
Correlation 0.383 0.299 0.416 1 0.277 0.381
Sig. (1-tailed) 0.002 0.012 0.001 0.018 0.002
H
N 57 57 57 57 57 57
Pearson
Correlation 0.547 0.437 0.353 0.277 1 0.445
Sig. (1-tailed) 0.000 0.000 0.004 0.018 0.000
M
N 57 57 57 57 57 57
Pearson
Correlation 0.629 0.532 0.348 0.381 0.445 1 Sig. (1-tailed) 0.000 0.000 0.004 0.002 0.000
L
associated with the observed value of F was 13.909 (=0.000). Thus, the hypothesis can be accepted and we may conclude that there is a significant linear relation- ship between the set of independent variables and the dependent variable.
In Table 5, coefficients for variables V to L or beta coefficients has been calculated, i.e., SV is 0.347;
SO
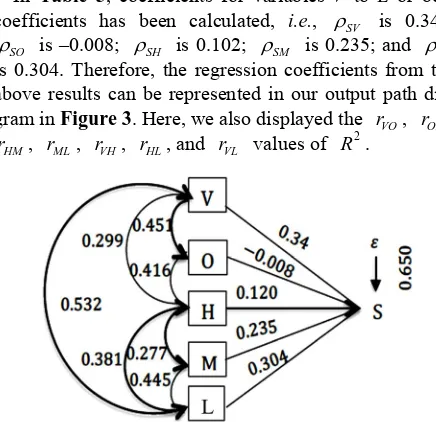
is –0.008; SH is 0.102; SM is 0.235; and SL is 0.304. Therefore, the regression coefficients from the above results can be represented in our output path dia- gram in Figure 3. Here, we also displayed the rVO, rOH,
HM
r , rML, rVH, rHL, and rVL values of R2.
Figure 3. Output path diagram (Structural relationship of V, O, H, M and L to S).
Table 3.Summary of the model testing.
Model R R Square Adjusted R Square Std. Error of the Estimate
1 0.760a 0.577 0.535 0.361
aPredictors: (Constant),
[image:6.595.60.278.154.365.2]V, O, H, M, L.
Table 4. ANOVA output of the hypothesis testing.
Model Squares Sum of df Square Mean F Sig.
Regression 9.100 5 1.820 13.909 0.000a
Residual 6.673 51 0.131
1
Total 15.773 56
aPredictors: (Constant),
[image:6.595.59.285.499.570.2]V, O, H, M, L.
Table 5. Regression coefficients analysis.
Unstandardized
Coefficients Standardized Coefficients Model
B Std. Error Beta
t Sig.
(Constant) 0.353 0.405 0.870 0.388
L 0.276 0.105 0.304 20.635 0.011
V 0.358 0.120 0.347 20.977 0.004
M 0.208 0.095 0.235 20.191 0.033
O −0.007 0.100 −0.008 −0.071 0.944
1
H 0.068 0.070 0.102 0.973 0.335
5. Output of the Results
5.1. Identifying Influential Factors
[image:6.595.61.284.608.735.2]The relevant output is in the tables labeled Correlations, Model Summary, ANOVA and Coefficients. These tables are shown in SPSS output 18.0 (PASW). The first table in the output (not produced here) gives descriptive statis-tics such as means and standard deviations. Next comes the correlations table, and we see that the correlations that our model specified as casual effects are all statisti-cally significant. This is encouraging. The next table (not produced here) is Variables Entered/Removed, and this just tells us that vision, organization, HRM, marketing, and leadership were entered properly and that servitiza-tion was the dependent variable. Next is the model sum-mary, in which we see that . Thus, there is 57.7% goodness of fit of the model produced by the re-gression equation. Then comes an ANOVA table that just confirms that the regression equation is significant. Fi-nally, we have the coefficients table, in which we see that the “Sig.” values are 0.004 for vision, 0.033 for market-ing, and 0.011 for leadership to servitization, which is just significant (p = 0.05), as “Sig.” (p-value = 0.05) is the significance level for the test of the hypothesis. But, the “Sig.” value for factors, like organization and HRM are 0.944 and 0.335 respectively, which is greater than 0.05 and is not significant to servitization. Therefore, in Table 6, the hypothesis H1, H4, and H5 are accepted and have direct influence to the implementation of servitiza-tion strategy. But, the hypothesis H2 and H3 that there are a linear relationship between these predictors and attractiveness can be rejected.
2 0.577
R
5.2. Degree of Influences (Proposition)
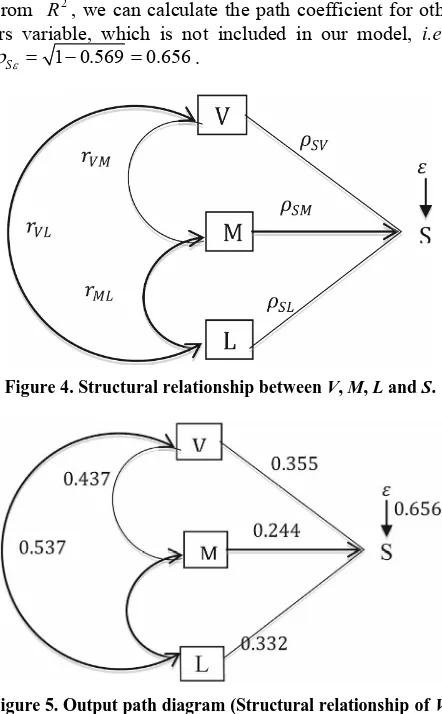
According to the output of analysis described in the pre- vious section, we found that the factors, like vision, marketing, and leadership are significantly influence to the implementation of servitization strategy. On the basis of this understanding, we can propose and improve the following path diagram involving three variables in Fig- ure 4.
The current path diagram (Figure 4) contains three exogenous variables V, M, L and an endogenous variable
Table 6. Result for hypotheses test.
Research Hypotheses Results
H
1 Accepted
H
2 Rejected
H
3 Rejected
H
4 Accepted
H
[image:6.595.309.536.625.734.2]S. Thus, the structural equation of this path diagram is as follows:
SV SM SL
S V M L.
Based on the above structural equation, servitization is influenced by three exogenous variables V, M, and L. We will investigate how these variables V, M, and L are in-fluenced to the implementation of servitization strategy. The regression analyses required by the path model in this part are carried out in the same way, using regression dialog boxes. This time, we will not reproduce the output tables again, but only the relevant information from them is as follows: the correlations specified in the model are significant, the independent variables in each regression was entered and the ANOVA confirmed that all were significant. The 2
R is 0.569, which means that there is 56.9% goodness of fit of the model produced by equation. Finally, the coefficients of the variables, in which p-value (Sig. column) = 0.002 for vision, 0.023 for mar-keting, and 0.004 for leadership that are smaller than 0.05 and significant to the implementation of servitiza-tion strategy. The graphical regression coefficients are displayed in our output path diagram in Figure 5, where we also displayed the vm, ml, and vl values of . From , we can calculate the path coefficient for oth-ers variable, which is not included in our model, i.e.,
r r r R2
2 R
1 0.569 S
[image:7.595.62.283.368.725.2] 0.656 .
Figure 4. Structural relationship between V, M, L and S.
Figure 5. Output path diagram (Structural relationship of V, M, and L to S).
In order to identify the degree of influence of variables V, M, and L towards servitization, we calculated each of these variables’ direct and correlative relational influ-ences, which are as follows:
1) Influence of Vision (V)
Direct Influence
0.355 0.355 0.126
SV SV
Influence through correlative relations with marketing (M) SVrvmSm
0.355 0.437 0.244
0.0372) Influence of Marketing (M)
Direct Influence
0.244 0.244 0.059
Sm Sm
Influence through correlative relations with leadership (L)
0.244 0.445 0.332
0.036Sm rml sl
3) Influence of Leadership (L)
Direct Influence
0.332 0.332 0.110
sl sl
Influence through correlative relations with vision
V sl rlv SV
0.332 0.532 0.355
0.062 Therefore, on the basis of above calculations, we can summarize the following results:1) The direct influence of vision (V) toservitization is 12.6% (0.126), and through the relationship with marketing is 3.7% (0.037). Thus, the influence of vi-sion toward implementing servitization strategy in total is 16.3% (0.163).
2) The direct influence of marketing (M) to servitization is 5.9% (0.059), and through the relationship with leadership is 3.6% (0.036). Thus, the influence of marketing toward implementing servitization strategy in total is 9.5% (0.095).
3) The direct influence of leadership (L) to servitization is 11% (0.110), and through the relationship with vi-sion is 6.2% (0.062). Thus, the influence of leadership toward implementing servitization strategy in total is 17.2% (0.172).
6. Conclusions
[image:7.595.63.281.418.572.2]leading companies like, Fujitsu, Toshiba, Hitachi, and so on embraces this concept as a service-led competitive strategy, environmental sustainability, and the basis to differentiate themselves from competitors who simply offer lower priced products. But, transforming from product manufacturing to product-service system is not an easy strategic choice and that a manufacturer first needs to carefully design its services. To succeed with servitization, a manufacturer is likely to need some new and alternative organizational principles structures and processes. Consequently, the firm needs to understand the success factors, which is undoubtedly important to-wards implementing servitization strategy.
In this paper, the researcher explored the relationship between organizational five factors and the implementa-tion of servitizaimplementa-tion strategy using a quesimplementa-tionnaire survey of three Japanese electronics/ICT firms (FTH). The re-sults of this study provide a clear indication that organ-izational factors are, indeed, highly significant on im-plementing servitization strategy. Our empirical study also found that organizational factors such as leadership (17.2%), vision (16.3%), and marketing (9.5%) signifi-cantly influenced to the implementation of servitization strategy. The research result can be used to identify the key organizational factors in shifting from manufacturing to servitization, and to help companies for mitigating transition risks especially related to organizational proc-ess and behaviors. The expected benefits from this re-search are to help enterprise managers and decision makers to make the correct tactics for implementing ser-vitization strategy and achieving their desired objectives. Since our empirical study analyzed data collected from 3 organizations in Japan, it would be interesting and valu-able to conduct similar surveys in other regions for com-parative studies. Furthermore, we may extend our study in the future by increasing the number of sampled com-panies, including other organizational factors such as organizational culture and top management support, management style, resources allocation, and investigating how the effectiveness of servitization strategy influences organizations upon their performance in various areas such as financial output, competition edge, customer sat-isfaction, corporate image, credibility, trust, and reputa-tion in the market. Is there any other alternative that the manufacturer can consider as the value proposition to their offerings rather than servitization?
REFERENCES
[1] S. Vandermerwe, and J. Rada, “Servitization of Business: Adding Value by Adding Services,” European Manage- ment Journal, Vol. 6, No. 4, 1988, pp. 314-324.
doi:10.1016/0263-2373(88)90033-3
[2] R. Wise and P. Baumgartner, “Go Downstream: The New Profit Imperative in Manufacturing,” Harvard Business
Review, Vol. 77, No. 5, 1999, pp. 133-141.
[3] R. Oliva and R. Kallenberg, “Managing the Transition from Products to Services,” International Journal of Ser- vice Industry Management, Vol. 14, No. 2, 2003, pp. 160- 172. doi:10.1108/09564230310474138
[4] N. Slack, “Operations Strategy: Will Is Ever Realize Its Potential,” Gestao & Producao, Vol. 12, No. 3, 2005, pp. 323-332. doi:10.1590/S0104-530X2005000300004 [5] A. Neely, “The Servitization of Manufacturing: An Ana-
lysis of Global Trends,” Centre for Business Performance, Cranfield School of Management, 2009.
[6] P. Hewitt, “The Government’s Manufacturing Strategy,” Secretary of State for Trade and Industry, 2000.
wwwdti.gov.uk/manufacturing
[7] D. Bowen, C. Siehl and B. Schneider, “Developing Ser- vice-Oriented Manufacturing,” In: I. Kilmann, Ed., Mak- ing Organizations Competitive, Jossey-Bass, San Francis- co, 1991, pp. 397-418.
[8] N. W. Foote, J. Galbraith, Q. Hope and D. Miller, “Mak- ing Solutions the Answer,” The MicKinesy Quarterly, Vol. 3, No. 1, 2001, pp. 84-93.
[9] H. Gebauer and T. Friedli and E. Fleisch, “Success Fac- tors for Achieving High Service Revenues in Manufactur- ing Companies,” Benchmarking: An International Jour- nal, Vol. 13, No. 3, 2006, pp. 374-386.
doi:10.1108/14635770610668848
[10] L. Araujo and M. Spring, “Service, Product, and the In- stitutional Structure of Production,” Industrial Marketing Management, Vol. 35, No. 7, 2006, pp. 797-805. doi:10.1016/j.indmarman.2006.05.013
[11] VDMA, “Dien und Verdienen,” VDMA Verlag, Frank- furt, 1998.
[12] R. Johnston, “The Determinants of Service Quality: Satis- fiers and Dissatisfiers,” International Journal of Service Industry Management, Vol. 6, No. 5, 1995, pp. 53-71.
doi:10.1108/09564239510101536
[13] T. Knecht, R. Leszinski and F. Weber, “Memo to a CEO,” The McKinsey Quarterly, Vol. 4, No. 1, 1993, pp. 79-86. [14] G. W. Potts, “Exploiting Your Product’s Service Life Cy-
cle,” Harvard Business Review, Vol. 66, No. 5, 1988, pp. 32-35.
[15] S. Brax, “A Manufacturer Becoming Service Provider— Challenges and Paradox,” Manufacturing Service Quality, Vol. 15, No. 2, 2005, pp. 142-155.
[16] V. Malleret, “Value Creation through Service Offers,” European Management Journal, Vol. 24, No. 1, 2006, pp. 106-116. doi:10.1016/j.emj.2005.12.012
[17] A. Wolfl, “Interactions between Services and Manufac- turing—Findings from I-O and Occupations Data,” OECD Workshop on Services, Paris, 15-16 November 2004. [18] G. Ren and M. Gregory, “Servitizatin in Manufacturing
Companies,” Paper Presented at 16th Frontiers in Service Conference, San Francisco, 2007.
[19] H. Mathe and R. Shapiro, “Integrating Service Strategy in the Manufacturing Company,” Chapman and Hall, Lon- don, 1993.
IIIEE, Lund University, Lund, 2000.
[21] A. Davies, “Moving Base into High Value Integrated So- lutions: A Value Stream Approach,” Industrial and Cor- porate Change, Vol. 13, No. 5, 2004, pp. 727-756.
doi:10.1093/icc/dth029
[22] A. Tukker, “Eight Types of Product-Service Systems: Eight Ways to Sustainability? Experiences from SusProNet,” Business Strategy and the Environment, Vol. 13, No. 4, 2004, pp. 246-260. doi:10.1002/bse.414
[23] C. A. Voss, “Alternative Paradigms for Manufacturing Strategy,” International Journal of Operations & Pro- duction Management, Vol. 25, No. 2, 2005, pp. 314-324. [24] M. Porter and C. Ketels, “UK Competitiveness: Moving
to the Next Stage,” Department of Trade and Industry, London, 2003.
[25] R. Weeks, “The Culture and Skills Challenges Associated with Servitization: A South African Persceptive,” Gradu- ate School of Technology Management, University of Pretoria, 2010.
[26] L. L. Berry, “Relationship Marketing of Services: Grow- ing Interest, Emerging Perspectives,” Journal of the Aca- demy of Marketing Science, Vol. 23, No. 4, 1995, pp. 236- 245. doi:10.1177/009207039502300402
[27] C. Martin and D. Horne, “Restructuring towards a Service Orientation,” International Journal of Service Industry Management, Vol. 3, No. 1, 1992, pp. 25-38.
[28] T. O. Davenport, “Human Capital: What Is and Why Peo- ple Invest It,” Jossey-Bass, San Francisco, 1999.
[29] T. P. Flannery, D. A. Hofrichter and P. E. Platten, “Peo- ple, Performance, and Pay: Dynamic Compensation for Changing Organizations,” Free Press, New York, 1996. [30] T. B. Weisis and F. Hartle, “Reengineering Performance
Management: Breakthrough in Achieving Strategy through People,” St. Luis Press, Boca Raton, 1997.
[31] J. R. Katzenbatch and D. K. Smith, “The Wisdom of Teams: Creating High-Performance Organizations,” Har-
vard Business School Press, Boston, 1993.
[32] J. M. Kouzes, and B. Z. Posner, “The Leadership Chal- lenge: How to Get Extraordinary Things Done in Organi- zations,” Jossey-Bass, San Francisco, 1987.
[33] B. George, “Authentic Leadership: Rediscovering the Sec- rets to Creating Lasting Value,” Jossesy-Bass, San Fran- cisco, 2003.
[34] W. B. Rouse, “A Theory of Enterprise Transformation,” Wiley InterScience, Hoboken, 2005, pp. 279-295. [35] “Fujitsu Annual Report 2012,” 2012.
http://www.fujitsu.com/downloads/IR/annual/2012/all.pdf [36] “Toshiba Annual Report 2012,” 2012.
http://www.toshiba.co.jp/about/ir/en/finance/ar/ar2012/tar 2012e.pdf
[37] “Hitachi Annual Report 2012,” 2012.
http://www.hitachi.com/IR-e/library/annual/2012/ar2012e. pdf
[38] S. Desmet, R. van Dierdonck and B. van Looy, “Servitiza- tion: Or Why Services Management Is Relevant for Manu- facturing Environments,” Services Management: An In- tegrated Approach, Pearson Education, Harlow, 2003, pp. 40-51.
[39] C. Windahl and N. Lakemond, “Developing Integrated Solutions: The Importance or Relationships within the Network,” Industrial Marketing Management, Vol. 35, No. 7, 2006, pp. 806-818.
doi:10.1016/j.indmarman.2006.05.010
[40] J. Merdith, “Building Operations Management Theory through Case and Field Research,” Journal of Operations Management, Vol. 16, No. 4, 1998, pp. 441-454.
doi:10.1016/S0272-6963(98)00023-0
[41] H. P. Lu and J. Y. Wang, “The Relationship between Management Style, User Participation, and System Suc- cess over MIS Growth Stages,” Information & Manage- ment, Vol. 32, No. 3, 1997, pp. 203-213.