ISSN Online: 2152-2219 ISSN Print: 2152-2197
DOI: 10.4236/jep.2018.94026 Apr. 30, 2018 405 Journal of Environmental Protection
Spatial Variability and Radiative Impact of
Aerosol along the Brahmaputra River Valley in
India: Results from a Campaign
Shyam Sundar Kundu
1,2*, Arup Borgohain
1, Nilamoni Barman
1, Meenakshi Devi
2, P. L. N. Raju
11North Eastern Space Applications Centre, Umiam, Shillong, India 2Department of Physics, Gauhati University, Guwahati, India
Abstract
The first ever land campaign to study the spatial variability of the aerosol characteristics along the Brahmaputra river valley (BRV) in Assam, North-Eastern India, was conducted during 2011. Measurements were made over 13 locations for Aerosol Optical Depth (AOD), scattering coefficient, particulate matter, black carbon (BC) concentration and meteorological pa-rameters. The BRV is divided into three sectors longitudinally viz western sector (WS), central sector (CS), and eastern sector (ES). Significant Spatial heterogeneity in AOD and BC concentration was observed (p < 0.05) with the highest values over WS and a continual decrease from WS to ES with aerosol dominance in PM2.5 category along the entire valley. The Angstrom coeffi-cient measured using different wavelength pairs showed spatial variability in-dicating dominance of fine particles over WS and coarse particles in ES with a probable bimodal distribution. The scattering and absorption coefficient shows dominance of both types of aerosol over WS than other areas. The shortwave radiative forcing was higher over the WS than CS and ES of the valley. The campaign revealed that under favorable wind conditions, the BRV is loaded with significant amount of natural and anthropogenic aerosol during local winter and is influenced by the long-range transport of aerosols from the Indo-Gangetic plain.
Keywords
Brahmaputra Valley, Aerosol, Radiative Forcing, Land Campaign, Black Carbon
1. Introduction
Aerosols play a key role in climate system by altering the global radiation
budg-How to cite this paper: Kundu, S.S., Bor-gohain, A., Barman, N., Devi, M. and Raju, P.L.N. (2018) Spatial Variability and Radia-tive Impact of Aerosol along the Brahma-putra River Valley in India: Results from a Campaign. Journal of Environmental Pro-tection, 9, 405-430.
https://doi.org/10.4236/jep.2018.94026
Received: February 21, 2018 Accepted: April 27, 2018 Published: April 30, 2018
Copyright © 2018 by authors and Scientific Research Publishing Inc. This work is licensed under the Creative Commons Attribution International License (CC BY 4.0).
http://creativecommons.org/licenses/by/4.0/
DOI: 10.4236/jep.2018.94026 406 Journal of Environmental Protection
et, directly by scattering and absorbing the incoming radiation or indirectly by changing the cloud microphysical properties [1] [2][3] [4]. The estimation of aerosol radiative forcing (RF) comes with large uncertainties [4][5] and aerosols dominate the uncertainty in the total anthropogenic RF [5][6]. This uncertainty arises primarily due to unavailability of adequate information on spatial and temporal distribution of aerosol across the globe [7][8]. This uncertainty can be greatly reduced through accurate measurements of optical, physical, and chemi-cal properties of aerosols through continuous measurements from ground-based networks, ships, aircrafts, balloons, and satellites, collecting data through field experiments supported by numerical modeling [9].
The Brahmaputra River Valley (BRV) of Southeast Asia recently has been ex-periencing regional climate change due to aerosol [10]. Several studies have shown that on a global scale the largest source of BC aerosols has been the South East Asia [11][12]. Large scale biomass burning aided by transport of pollution form Indo-Gangetic plain (IGP) is the reason for dominant source of carbona-ceous aerosols over this region [13]. The region with all its natural diversities, high population density, diverse living habits, and the growing industrialization and urbanization calls for detail investigation on aerosol properties [14]. Unfor-tunately, in the BRV region of India, which is home to about 20 million people and several biodiversity hotspots, no systematic measurement of aerosol over space and time has been done. A few studies by Gogoi et al. [15][16] and Pathak et al. [17] have reported short and long term optical and physical properties of aerosol over Dibrugarh (an urban location in eastern Assam, India) during last few years and related them with the synoptic meteorology and long range trans-port. Aerosol measurements have also been made over Guwahati city with an indigenously developed LIDAR [18][19].
DOI: 10.4236/jep.2018.94026 407 Journal of Environmental Protection
central Indian region [31] have been conducted.
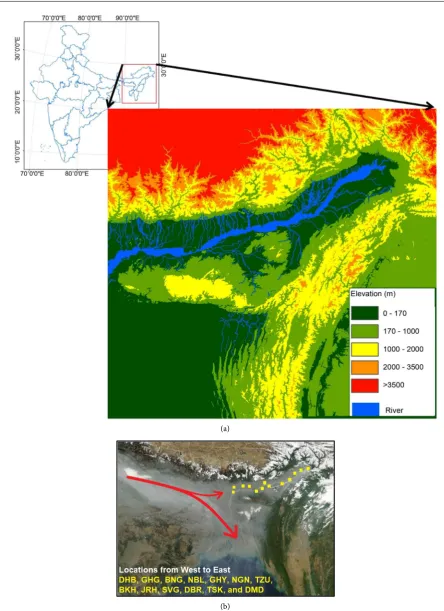
It is evident that field experiments give the unique opportunity of collecting data over an extended spatial domain within a short time span that is useful in bringing out the special features of aerosols within the campaign area. The Brahmaputra valley in north eastern region (NER) of India with a unique terrain is among the highest rainfall receiving zones in world (Cherrapunjee and Maw-synram that receive world’s highest annual rainfall are within this region). Ma-jority of the population in NER resides in the Brahmaputra valley spanning from east to west in the state of Assam. The valley is highly vulnerable to aerosols loading during winter (Nov-Feb) and pre-monsoon season (March-May) owing to the fact that the valley has hills of altitude more than 1500 m all around (Figure 1(a)), except a narrow opening in the west [15]. The wind over the re-gion is primarily westerlies during the winter and pre-monsoon season that has the potential to carry dust laden air from north-west and west Asian countries along with the contribution from IGP [13] [32]. The winter is also mostly dry with daytime relative humidity remaining below 50% for most of the times. The aerosol within the atmospheric boundary layer therefore has the potential to re-main over the area for long duration. The north eastern part of India has not been explored much either in the form of fixed station measurements or during any of the campaigns mentioned above except partly during the CAIPEEX pro-gram [30]. Therefore, to examine the spatial variability of the aerosol characte-ristics along the BRV, a land campaign was conducted by North Eastern Space Applications Centre (NESAC) in collaboration with Dibrugarh University, by collecting in-situ data from west to east along the BRV during the period from February 3 to March 2, 2011. In this paper, we present the results of columnar and surface aerosol measurements, absorption and scattering measurements carried out during the campaign. The RF calculated using SBDART model for the campaign locations are also presented in this paper.
2. Site Description and Meteorology
DOI: 10.4236/jep.2018.94026 408 Journal of Environmental Protection (a)
(b)
[image:4.595.72.517.56.668.2]DOI: 10.4236/jep.2018.94026 409 Journal of Environmental Protection
50 m), Bongaigaon (BNG, 26.52˚N, 90.5˚E, 63 m), Nalbari (NBL, 26.47˚N, 91.43˚E, 42 m), Guwahati (GHY, 26.17˚N, 91.75˚E, 55 m), Nagaon (NGN, 26.22˚N, 92.5˚E, 67 m), Tezpur (TZU, 26.7˚N, 92.83˚E, 48 m), Bokakhat (BKH, 26.63˚N, 93.58˚E, 76 m), Jorhat (JRH, 26.73˚N, 94.01˚E, 116 m), Sivasagar (SVG, 26.95˚N, 94.63˚E, 95 m), Dibrugarh (DBR 27.3˚N, 94.6˚E, 108 m), Tinsukia (TSK, 27.5˚N, 95.36˚E, 116 m) and Doomdooma (DMD, 27.6˚N, 95.55˚E, 114 m). Most of the sampling locations were so chosen to be away from heavy traffic and any visible pollution sources. Three locations i.e. GHY, JRH, and DBR are urban locations, while GHG, NBL, and DMD are rural locations and the rest are semi-urban locations.
For spatial assessment of aerosols, the valley is grouped into three re-gions/sectors from west to east, and named as western sector (WS: from DHB to GHY), central sector (CS: from TZU to JRH), and eastern sector (ES: from SVG to DMD) based on proximity to the external pollution source and terrain. The major pollution sources in the western sector are two oil refineries and a number of open cast coal mines in close proximity. The region is also characterized by very less forest cover, large open agricultural field and several large sand islands. The CS region is largely covered by moderately dense vegetation and large water bodies, a large number of tea gardens, and one oil refinery. The BRV gets nar-rowed down in the ES with densely vegetated hills on both side and is mostly covered by tea gardens in addition to several oil fields and coal mines.
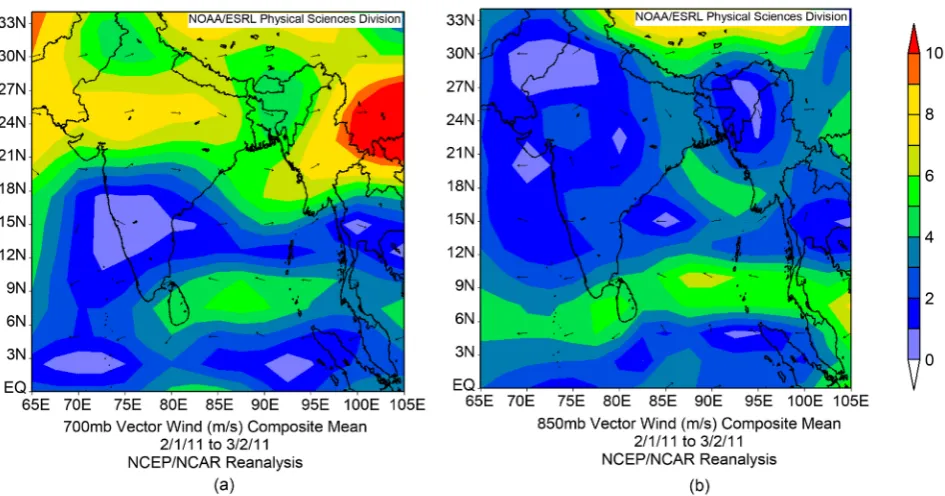
[image:5.595.62.535.444.692.2]The NCEP/NCAR reanalysis data on synoptic wind at 700 mb and 850 mb pressure level over the region is shown in Figure 2. The wind was of the order of 1 - 3 m/s at 850 mb and was mostly north-westerly, while that at 700 mb was
DOI: 10.4236/jep.2018.94026 410 Journal of Environmental Protection
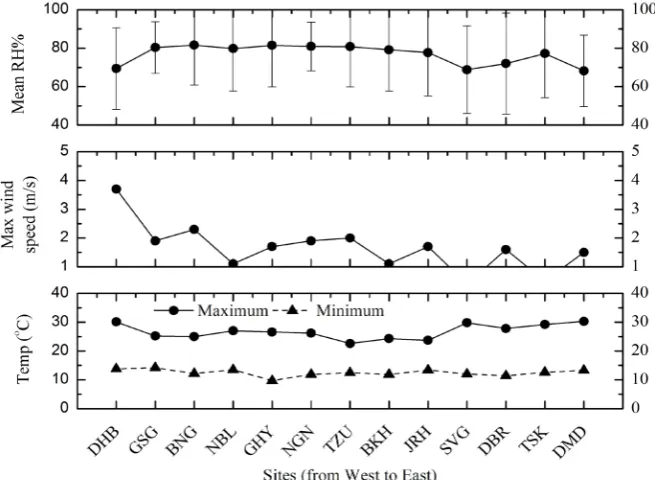
relatively strong at 5 - 6 m/s and was westerly over the region. The surface me-teorology at the observation sites were obtained from nearby Automatic Weath-er Stations (AWS, set up and maintained by NESAC). Figure 3 shows spatial variations of the maximum and minimum temperature, mean relative humidity (RH) with one standard deviation as vertical bars on both sides, and maximum wind speed. The maximum and minimum temperature was in the range of 30.3˚C - 22.6˚C and 9.7˚C - 17.5˚C respectively. The CS showed more consistent temperature than the other two sectors. The mean RH remained in the range of 70% - 80% with daytime RH going below 50% and that reaching to 99% at night. Short spells of rainfall accumulating to 3 - 5 mm was recorded at NGN and TZU during the campaign. The entire campaign period remained dry barring this rainfall episode. Surface wind remained north-westerly and is weak throughout the valley with higher wind speed observed over the WS.
3. Instruments and Model Description
[image:6.595.210.538.438.678.2]The measurements were made continuously for 48 hours in each location using Microtops Sunphotometer, Aethalometer, Integrating Nephelometer, Quarts Crystal Microbalance Impactor, and Automatic Weather Station. A Toyota quails vehicle was internally modified and the equipments were placed inside the vehicle. The air inlet was placed at a height of more than 10 m from ground. The vehicle had an uninterrupted power supply system with battery backup for up to 3 hours. However, due to frequent load shedding in Assam during the campaign period, data could not be collected for few hours in a few stations. No data could
DOI: 10.4236/jep.2018.94026 411 Journal of Environmental Protection
be collected using Sunphotometer over NGN due to overcast situation during both the days scheduled for the station. The Sunphotometer and the Nephelo-meter were 5 months and 3 months old instruments respectively when the cam-paign was conducted. The factory calibration was therefore valid for both these instruments. The Aethalometer, being 3 years old during the campaign period, was calibrated two months prior to the campaign by the Indian authorized agent of the manufacturer of the instrument. A brief description about the instruments and models used is provided below.
3.1. Aethalometer
A portable Aethalometer (Magee Scientific, model AE42) was used for mea-surement of Black Carbon (BC) concentrations. The instrument measures at-tenuation of light beam at seven different wavelengths, viz., 370, 470, 520, 590, 660, 880, and 950 nm. The observation at 880 nm wavelength only was taken for BC measurement as it is the principal absorber of light at 880 nm. Details of the instrumentation, methodology and uncertainty are discussed elsewhere [33] [34]. The Aethalometer was operated at a flow rate of 4 litres per minute (LPM) and with a temporal resolution of 5 minutes at all the stations. The Aethalometer measurement is subject to uncertainties that arise from the multiple scattering effects in the filter tape and the shadowing effects. The corrections for these un-certainties were done following Weingartner et al. [35] and Nair et al. [34].
3.2. Quartz Crystal Microbalance Impactor
A Quartz Crystal Microbalance (QCM) Impactor (model PC-2, California Mea-surements Inc., USA) was used to measure the aerosol mass concentration at 10 different size ranges (cut-off diameters in μm at >25, 12.5, 6.25, 3.2, 1.6, 0.8, 0.4, 0.2, 0.1, and 0.05 for stage 1 to 10) assuming a typical density of 2 g·cm−3 for
continental aerosols. The QCM was operated with a flow rate of 240 milliliters per minute. It was operated only when the ambient relative humidity (RH) was less than 75% as quartz crystals in QCM are sensitive to high RH. The observa-tions were made at sampling accumulation time of 5 min at every hourly interval during 7:00 hrs to 19:00 hrs (local time) on all days. The error in QCM mea-surements is less than 15% [31].
3.3. Integrating Nephelometer
DOI: 10.4236/jep.2018.94026 412 Journal of Environmental Protection
sensitivity of better than 1.0 × 10⁻⁷ meter−1 for light scattering coefficients.
3.4. Microtops Sunphotometer
The aerosol optical depth measurements were made using a MICROTOPS II (make: solar light company, Inc, USA) hand-held multi-band Sunphotometer. The instrument has five accurately aligned optical collimators having full field view of 2.5°. The instrument made simultaneous measurement of Aerosol Opti-cal Depth (AOD) at 380, 440, 500, 936, and 1020 nm wavelengths. The amount of precipitable water in atmospheric column was determined by measurements at 936 nm (complete water absorption channel) and 1020 nm (no water absorp-tion). A detailed description about the instrument functions and its calibration and validation is provided by Morys et al. [36].
3.5. SBDART Model
The SBDART (Santa Barbara DISORT Atmospheric Radiative Transfer) mul-tiple scattering model [37] was used to estimate the aerosol RF for all the loca-tions along the valley. The model has been developed by the atmospheric science community and is being used widely for the radiative transfer calculations. The major input parameters for RF estimations are AOD, single scattering albedo, asymmetry factor and surface albedo. Other input parameters in the model in-clude are solar zenith angle, which is calculated by specifying a particular date, time, latitude and longitude, and atmospheric profiles (humidity, temperature, ozone and other gasses). Based on the prevailing weather conditions and meas-ured parameters suitable atmospheric model are used.
4. Results and Discussions
The aerosol characterization over RBV has been done by studying different opt-ical and physopt-ical properties of aerosol and estimating their effect on the radiative balance of the Earth-Atmosphere system. Continuous measurement was made for 48 hours over 13 locations along the valley. The data collected for the entire period of observation was used to estimate the station wise mean. Standard dev-iation from mean was also computed each station. The observations made are analyzed below.
4.1. Aerosol Optical Depth
DOI: 10.4236/jep.2018.94026 413 Journal of Environmental Protection
is provided in Section 4.2.
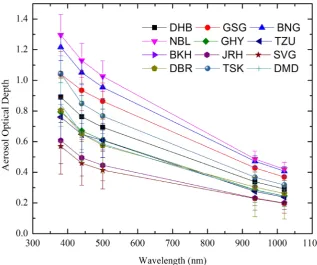
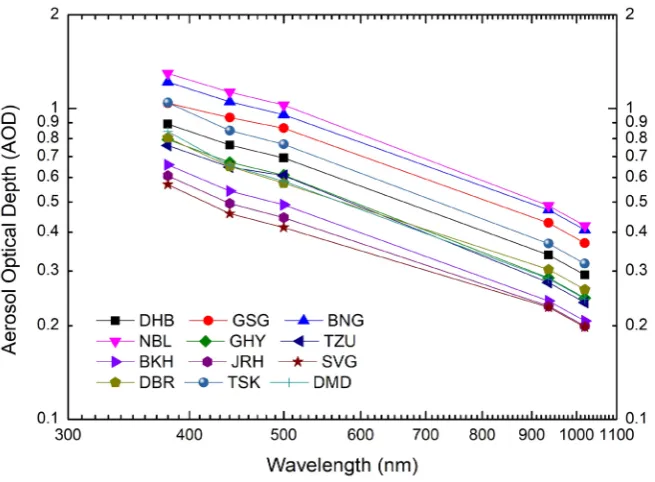
[image:9.595.211.529.427.692.2]The variation in AOD for all the stations at five representative wavelengths, namely, 380, 440, 500, 936, and 1020 nm are shown in Figure 4. Vertical lines on top of each bar represent ±1σ variation about the mean value. The locations in WS show higher AOD than the locations in CS and ES. One station in ES, namely, TSK shows higher AOD comparable with that in WS locations. No AOD measurement could be done over NGN due to overcast situation there. The variation of AOD along the western to eastern corridor of BRV is consistent at all wavelengths. However, AOD shows more consistency at longer wave-lengths (936 and 1020 nm) than at smaller wavewave-lengths (380 nm). The highest value of AOD at 550 nm of 1.03 ± 0.1 was observed over NBL in WS while lowest value of 0.41 ± 0.12 was observed at SVG in ES. The locations in CS show very consistent AOD values in all channels. The regional inhomogeneity ob-served could be attributed to several reasons, firstly, the locations in WS are closer to the relatively high aerosol dominated IGP and the westerly wind travel-ling from the IGP (Figure 1(b), Figure 2(a), and Figure 2(b)) could transport a significant amount of aerosol towards the WS locations, which could further propagate towards the locations in CS and ES, but with lesser concentration. Se-condly, the WS and CS of the BRV are more densely populated than the ES, leaving reasons for higher anthropogenic aerosol generation over WS. The WS has more agricultural field along the valley than other two sectors, causing more loading of dust aerosol as well over the WS locations. All these contribute to higher concentration of both anthropogenic and natural aerosols over the
DOI: 10.4236/jep.2018.94026 414 Journal of Environmental Protection
locations in WS than CS and ES. Similar observations have been reported by Pathak et al. [41]. AOD values at higher wavelengths are more affected by natu-rally produced coarser aerosols, while the submicron sized aerosols produced mostly because of various anthropogenic activities contribute maximum to AODs at smaller wavelengths [42]. The higher AOD in all channels over the en-tire valley suggest both higher natural and anthropogenic aerosol along the val-ley.
Total aerosol loading in the atmosphere over any location depends on the dif-ferences between production of aerosols from all possible sources (either locally produced or transported to that location by wind) and their sinks (either gravi-tational settling or transported to other locations by wind) [42]. This means that even if there is no difference in source strength of aerosols, any weakening of the sink mechanisms can result in pile up of aerosols in the atmosphere which may manifest itself in terms of higher aerosol optical depth. There was a rainfall of the order of 2 - 5 mm over large part of CS and ES, when the vehicle was sta-tioned in NGN. Such a small amount of rainfall cannot do any large scale moval of aerosol from atmosphere. However, still it could cause moderate re-duction in AOD over subsequent stations like TZU and BKH. The AOD over JRH and SVG showed lowest value even though data were collected five to seven days after the rainfall event.
4.2. Ångström Exponent
Another important parameter used for optical and physical characterization of aerosol is Ångström Exponent (AE, α), which is computed from the Ångström’s [40] empirical formula:
AODλ=
βλ
−α (1)where AODλ is the AOD at wavelength λ and β is the turbidity coefficient and is
equal to AOD for λ = 1 µm. Logarithm of Equation (1) provides equation of a straight line between lnAODλ and lnλ as:
ln AODλ =α λln +lnβ (2)
Taking ratio of Equation (2), the AE can be calculated from the spectral values of AOD as:
(
d ln AODλ)
(
d ln)
α
= −λ
(3)sensi-DOI: 10.4236/jep.2018.94026 415 Journal of Environmental Protection
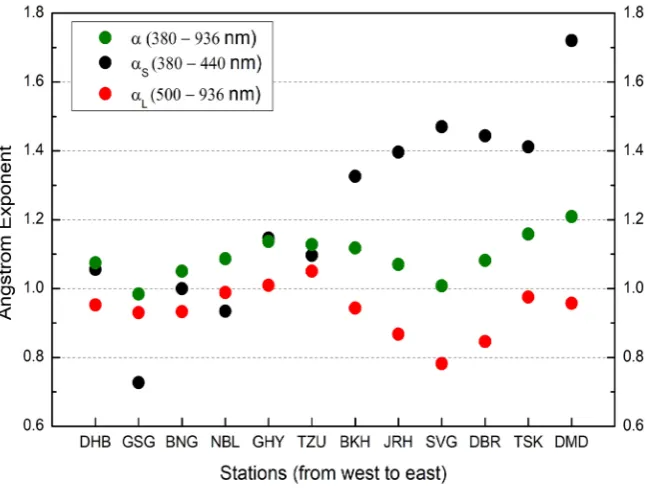
tive to changes in the number of nucleation and accumulation mode sized par-ticles. To find the dominating factor which causes α to change from one station to another along the BRV, we have computed this parameter for different wave-length intervals. Figure 5 shows the location wise variation of α computed for three different wavelength intervals (α: 380 - 936 nm, αS: 380 - 440 nm, and αL:
500 - 936 nm). The AOD at 1020 nm were not included for computation of AE values because of possible water vapor absorption effects at that wavelength.
We find that α values (computed using entire spectrum) is almost consistent over all locations with highest value of 1.21 over DMD (extreme eastern loca-tion) and lowest of 0.98 over GSG, that do not provide any clear picture on rela-tive dominance of either fine mode or coarse mode aerosols along the entire val-ley. However, the αS values have very significant variation along the valley with
lower values over locations in WS (close to 1) and higher values in ES (max. of 1.72 for DMD). As AE represent relative abundance in aerosol fine mode frac-tion and αS is more sensitive to changes in nucleation and accumulation mode
aerosol particles, the increase in its value may signify increase in fine mode frac-tion over the locafrac-tions from BKH to DMD in CS and ES. However, the αL,
com-puted using larger wavelength pairs, decreased as we move from west to east along the BRV, suggesting relative increase in coarse mode fraction as well over the ES. The locations in WS and part of CS covering from DHB to TZU, howev-er, show consistent values of α (close to 1) for all wavelength pairs, that do not provide any clarity on the relative dominance of aerosol mode over this region. This calls for a detail investigation on the spectral properties of AE along the valley, particularly over the ES of the BRV.
[image:11.595.214.539.448.692.2]DOI: 10.4236/jep.2018.94026 416 Journal of Environmental Protection
Since AE is also observed to vary with wavelength, a more precise empirical relationship between aerosol extinction and wavelength was suggested using a second order polynomial fit [39][45][46][47][48][49] given by:
(
)
20 1 2
ln AODλ =α +α lnλ α+ lnλ (4)
where α0, α1, and α2 are constants. The coefficient α2 accounts for a curvature
of-ten observed in sun-photometry measurements [50]. As a parameter to quantify the curvature of AODλ, the second derivative of lnAODλ versus lnλ is utilized as
it is related to the derivative of AE with respect to lnλ[39][45][49]. The second derivative (α') of AE is a measure of the rate of change of slope with respect to wavelength. From Equations (2) and (4), the following relationship can be ob-tained:
(
)
(
)
2d d ln d ln AODλ d ln d ln 2
α′ = α λ= − λ λ= − α (5)
A curvature in lnAODλ versus lnλ plot can provide useful information for
type of aerosol [45][49]. While a concave curve depicts dominance of biomass burning and/or urban/industrial aerosol, a convex curve depicts a dust domi-nated aerosol [39]. They [39][45][49] also concluded that aerosol dominated by coarse modes and having bimodal distribution could have very small curvature for lnAODλ versus lnλ, making polynomial fit to be linear. Figure 6 shows the
plot for lnAODλ versus lnλ for all the stations along the BRV. It is clear that
none of the station in BRV has any significant curvature for lnAODλ versus lnλ,
suggesting a possible presence of bimodal distribution with presence of both biomass burning aerosols and dust aerosols.
The second derivative of AE (α' = −2α2) has been used for qualitative assessment
[image:12.595.211.539.467.708.2]of aerosol particle size. A positive value of α' indicates aerosol size distribution
DOI: 10.4236/jep.2018.94026 417 Journal of Environmental Protection
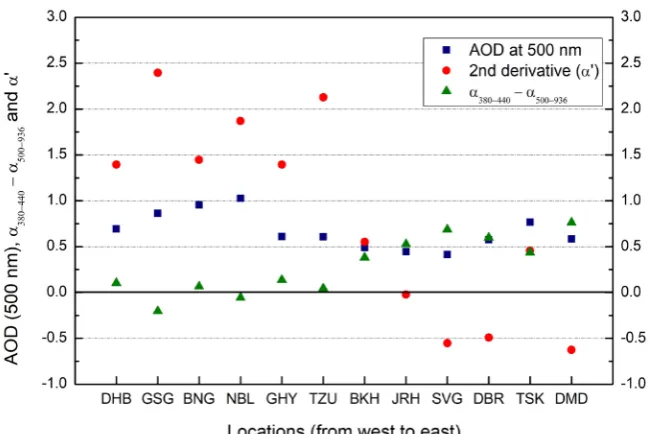
dominated by fine mode and negative values indicates the same dominated by coarse mode [39][44][51]. Kaskaoutis et al. [50] also concluded that the if the values of α computed using shorter wavelength pair is larger than that computed using longer wavelength pair and the second derivative of AE is negative, that strongly characterizes aerosol size distribution significantly dominated by coarse mode aerosols. The opposite of the above was characteristic of fine mode do-minance. Figure 7 depicts the distribution of second derivative of AE along with the AOD at 500 nm and difference of αS and αL for all the sites along the BRV.
The locations in the ES show negative values for second derivative of AE for all locations except over TSK supported with higher value of αS than αL. This clearly
indicates dominance of aerosol with coarser mode over these locations. TSK, being a railway hub in the ES and has relatively higher population density than other locations in ES, could have more anthropogenic aerosols leading to fine mode fraction dominance. The same can also be inferred from relatively higher AOD over TSK than other locations in ES.
The locations in WS and CS except JRH have negligible difference between the values in αS and αL, and have moderately higher positive value for the second
derivative of AE. This indicates the presence of aerosol distribution with signifi-cant presence of both fine and coarse mode aerosols over these locations with a higher number concentration of fine mode aerosols. The AOD at 500 nm wave-length also is significantly higher over these locations, which also support the presence of aerosols with bimodal distribution over these locations.
4.3. Aerosol Mass Concentration and Absorption Properties
[image:13.595.211.536.459.676.2]The aerosol mass concentrations over all locations along the BRV were measured
DOI: 10.4236/jep.2018.94026 418 Journal of Environmental Protection
using the QCM for particulate matter (PM) concentrations, viz., PM10 and PM2.5. The BC mass concentration, which is normally a subset of PM2.5 were also measured using an Aethalometer. Figure 8 shows the variation of these pa-rameters along the valley. The PM and BC concentration and its variation along the BRV has been discussed by Pathak et al. [52], using the data collected during the same campaign discussed here. The highest PM concentrations (PM10 and PM2.5) were observed at NBL in WS (53.75 ± 4.75 and 51.82 ± 3.1 μg·m−3) with
almost similar values at BKH, JRH, and SVG in CS and ES. However at sector level, CS shows the maximum sector average values of 37.73 ± 10.26 and 35.12 ± 10.2 μg·m−3 respectively for PM10 and PM2.5. Despite the light rain at two sites,
NGN and TZU in CS recorded appreciable PM concentrations (29.82 ± 3.7 and 28.1 ± 2.1 μg·m−3 for PM10). This concentration could be attributed to contribution
from local sources. Most of the sites in ES show low PM concentrations which lead to a sector based average value of 27.68 ± 9.74 and 25.08 ± 9.95 μg·m−3,
re-spectively for PM10 and PM2.5. The regional inhomogeneity observed for the PM and BC concentration also has similar causes as those discussed in Section 4.1.
[image:14.595.233.517.447.692.2]Two locations in WS named DHB and GHG showed significantly lower value of PM, irrespective of relatively higher value of BC concentration and AOD. The AOD is a columnar data with contribution from aerosol in the entire column over the measurement sites unlike the BC and PM concentrations representing the surface level aerosol. There could be significant amount of aerosol well above the surface over these two locations contributing to the overall increase in AOD. This observation also supports the concept of significant contribution of
DOI: 10.4236/jep.2018.94026 419 Journal of Environmental Protection
transported aerosol from the locations west of the BRV, primarily the IGP, af-fecting the locations in the WS more than CS and ES. In addition, a relatively higher wind speed over DHB could uplift more aerosols at a higher altitude, while almost calm weather over other locations confines aerosol at a lower sur-face level.
The daily mean BC mass concentration varies between highest value of 22.52 ± 4.05 μg·m−3 at NBL and lowest value of 6.82 ± 0.09 μg·m−3 at TZU. The WS
loca-tions again are rich in BC concentration near the surface (17.55 ± 3.26 μg·m−3) as
compared to the other two sectors having almost similar mean concentration of ~10.3 μg·m−3. Pathak et al. [52] also reported an appreciable day-to-day
variabil-ity in BC concentration particularly at the western locations and at DMD in the eastern sector. This was attributed partly to the proximity of these locations to coal mines or coal dumps over extreme eastern locations. A decreasing trend in BC concentration was observed from west to east which could be attributed to similar reasons discussed in Section 4.1.
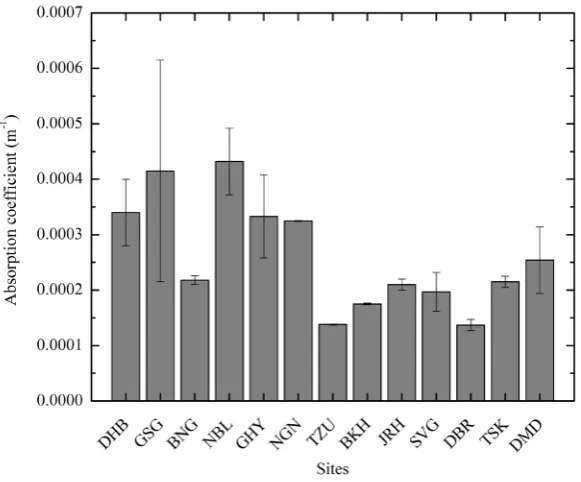
The aerosol absorption coefficient (βabs) was computed for 520 nm wavelength
and is shown in Figure 9. βabs was computed by measuring the attenuation
[image:15.595.230.521.450.691.2](ATN) of the incident light transmitted through the sample spot on a quartz fi-ber filter loaded in the Aethalometer. The absorption exponent was computed using the raw absorbance data recorded by Aethalometer. The absorption coeffi-cient provides an idea about the amount of particulate absorption in the atmos-phere and it is one of the critical parameter for radiative forcing calculations [53]. Absorption coefficient at 520 nm shows similar spatial variability along the BRV as that of the BC mass concentration indicating one to one relationship
DOI: 10.4236/jep.2018.94026 420 Journal of Environmental Protection
between the mass concentration and their absorbing properties. It has been seen in some of the earlier studies that aerosols emitted because of biomass/biofuel burning exhibit stronger absorption characteristics than those produced because of fossil fuel burning [54] [55]. The relative dominance of absorbing aerosol is evident over the locations in ES and CS than over the WS. The properties of aerosol absorption coefficient and absorption Angstrom exponent over the campaign sites has been discussed by Pathak et al. [52].
4.4. Aerosol Scattering Properties
The aerosol scattering coefficient (βsca) was computed using the Integrating
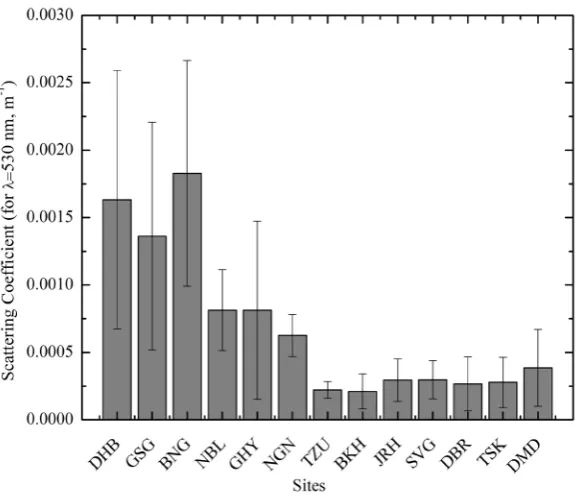
[image:16.595.229.520.445.693.2]Ne-phelometer data at 530 nm. Figure 10 shows the variation of aerosol scattering coefficient at 530 nm along the valley. The vertical lines on top of each bar represent ±1σ variation about the mean. The water-soluble inorganic species like sulfates, nitrates, etc. make very significant contribution to the scattering coeffi-cient [2]. These could arise from emissions associated mainly with combustion of fossil fuel, fertilizers, and some organic aerosols arising from biomass com-bustion [2]. The scattering coefficients over the WS locations are almost 7 - 8 times higher than that over ES and a few locations in CS. The highest value of 0.00183 ± 0.0009 is observed over BNG and lowest value of 0.00022 ± 0.0006 is observed over TZU. During the winter seasons, we see a lot of waste burning ac-tivities, such as burning agricultural fields, small scale forest fires, shrubs etc. in various parts of the valley and all these contribute significantly to the production of both scattering and absorbing type species in the atmosphere. Moreover dur-ing this season, aerosols which are either locally produced or transported from
DOI: 10.4236/jep.2018.94026 421 Journal of Environmental Protection
other regions are constrained within a shallow boundary layer having smaller ventilation coefficient and this causes their concentration to rise near the surface level [56]. The locations in the WS, being closer to the IGP and also large amount of biomass burning in this region causes higher scattering coefficient over the locations. Dust is another key parameter that gives higher scattering coefficient. The presence of large scale agricultural field and moderate level wind speed also adds to the overall scattering aerosol loading over the locations in WS and over some locations in CS. The similar trend observed for the absorption coefficient and scattering coefficient along the BRV, suggest same source of aerosol contributing to absorption and scattering.
The Atmosphere contains simultaneous presence of both scattering and ab-sorbing type aerosols with contrasting effect in aerosol radiative forcing [42]. The single scattering albedo (SSA, ω0) which is the ratio of scattering to
extinc-tion coefficient of aerosols, provide important informaextinc-tion on relative potential of the aerosol in cooling or warming of the atmosphere. The knowledge of single scattering albedo is very crucial as small error in its magnitude can produce large difference in the estimated values of aerosol radiative forcing [57]. The magni-tude of ω0 considered as an index for the relative dominance of scattering with
respect to absorbing type of aerosols, which can range from 0 (purely absorbing) to 1 (purely scattering). Ganguly et al. [55] have shown that for the same aerosol optical depth (AOD) and mass loading over Bay of Bengal, atmospheric forcing by aerosols is very sensitive to ω0. Over land areas, knowledge of ω0 becomes
even more critical and any small change in its value can have larger impact re-sulting from flux changes within and below the aerosol layer such as differential heating rates, changes in atmospheric stability and cloud formation [58]. In this particular study, we have estimated the single scattering albedo of aerosols from the ratio of scattering coefficient at 0.53 µm using Nephelometer and its sum with the absorption coefficient at 0.52 µm measured using Aethalometer. Meas-ured values of scattering coefficient are associated with some angular truncation loss which is an inherent and unavoidable problem for all Nephelometers [59]. Taking into account all possible sources of error, overall uncertainty in the esti-mated value of ω0 during the present study is around 8%. Figure 11 shows the
variation of ω0 along the BRV with vertical lines on top of each bar representing
±1σ variation about the mean.
The lowest value of ω0 was found to be at BKH in CS having value of 0.55 ±
DOI: 10.4236/jep.2018.94026 422 Journal of Environmental Protection Figure 11. Mean value of single scattering albedo over the measurement locations. The vertical bars represent one standard deviation on both sides.
trend depicted by the scattering coefficient and absorption coefficient along the BRV. The net aerosol loading over the WS is of course significantly high along with high SSA, high βabs, and βsca than that over the ES and CS
4.5. Aerosol Radiative Forcing
The radiative effect due to aerosol-radiation interactions also known as direct radiative forcing (RF) is the change in radiative flux caused by the combined scattering and absorption of radiation by anthropogenic and natural aerosols. The RF requires knowledge of the spectrally varying aerosol extinction coeffi-cient, single scattering albedo, and phase function, which can in principle be es-timated from the aerosol size distribution, shape, chemical composition and mixing. Short wave aerosol radiative forcing ranging from 0.25 - 4.0 µm is cal-culated using the Santa Barbara DISORT Atmospheric Radiative Transfer (SBDART) model [37]. The forcing was calculated for all the stations separately where data were collected during the campaign. The optical properties (that are not available, but required for RF calculation like phase function, asymmetry parameter, etc.) obtained from Optical properties of Aerosol and Cloud (OPAC) [61] model outputs and were used as input for the SBDART model. The model generated AODs at five wavelengths (at 380 nm, 440 nm, 500 nm, 936 nm and 1020 nm) were validated with the measured AOD obtained using Microtops Sunphotometer, and those outputs of OPAC for which root mean square error is minimum between observed and measured values were used for computation of radiative forcing
DOI: 10.4236/jep.2018.94026 423 Journal of Environmental Protection
[image:19.595.214.536.450.706.2]taken care by using combination of different surface types for each site. With this methodology, radiative forcing estimates were made for Top of the Atmos-phere (TOA, 100 km for the present case), AtmosAtmos-phere (ATM), and Surface (SUR)
Figure 12 shows TOA, ATM, and SUR level radiative forcing for all the loca-tions along the campaign trail. High atmospheric forcing of the order of 54 Wm−2 was observed over GSG and NBL in the WS and the lowest radiative
forc-ing of 29.91 Wm−2 was found over SVG in ES. The RF at ATM level is positive
for all locations with a gradual decrease in RF as we move from west to east along the BRV. The pattern is similar to that observed by AOD and BC concen-tration along the BRV. The radiative forcing was found to be reducing at the rate of 3.08 Wm−2 per degree longitude along the Brahmaputra valley as we move
from west to east.
The positive forcing arises due to the absorption of radiation by significantly larger concentration of black carbon in the atmosphere over all sites. The TOA RF also is positive for all locations except the GHY and JRH, which are the two major urban locations along the BRV. Significant contribution of absorbing aerosols to lower atmospheric warming over different parts of NE region of In-dia has also been reported by Gogoi et al.[62]. Pathak et al. [63] have reported that atmospheric forcing due to composite aerosols over Imphal (a valley loca-tion south of DMD in NE region of India) was 25.1 Wm−2 at, over Shillong
(another hilly station south of GHY) was 31.6 Wm−2 and over Agartala (an
ur-ban station in Tripura state) was 56.2 Wm−2. The global mean clear-sky ARF at
the TOA and the surface are however found to be negative [64].
DOI: 10.4236/jep.2018.94026 424 Journal of Environmental Protection
5. Summary and Conclusions
The first ever land campaign along the BRV was conducted during February 3 to March 2, 2011 along the western to eastern corridor of the Brahmaputra River valley in Assam. The campaign revealed significant regional heterogeneity in aerosol physical and optical properties along the BRV. The short wave aerosol radiative forcing computed using SBDART model also displayed regional varia-bility. The summaries of major observations are mentioned in Table 1.
The following conclusions are drawn based on the observations and analysis of the data:
• The AOD, BC, PM, scattering coefficient, and absorption coefficient are higher over the western sector of the BRV than over the central and eastern sector. Distinct spatial heterogeneity with a continual decrease in the values of most of the parameters was observed as we travelled from west to east along the BRV. Eastern locations are distinctly less polluted compared to the western and middle Assam locations.
• Surface level aerosols in BRV are dominated by PM2.5 throughout the BRV. The BC has significant contribution in total aerosol loading in all stations. • The coarse mode aerosols probably are of similar density along the valley.
The difference in AOD along the valley is because of variation in fine mode aerosols. The low curvature in ln AODλ vs ln λ and high AOD suggest
bi-modal distribution. There is a dominance of coarse mode particles over the ES and fine mode particles over the WS locations as observed by analyzing the Angstrom exponent computed using different wavelength pairs.
[image:20.595.52.541.468.726.2]• The analysis of AOD, BC, and PM suggest significant presence of vertically
Table 1. Summary of physical and optical properties of aerosol along the BRV.
Name of
Station (500 nm) AOD AE (α) (µg·mPM10 −3) (µg·mPM2.5 −3) BC (µg·m−3) coefficient Scattering coefficient Abs SSA
DBH 0.69 ± 0.12 1.07 ± 0.04 26.8 ± 3.2 25.1 ± 2.5 17.12 ± 3.0 0.00163 0.00034 0.83 ± 0.09 GHG 0.86 ± 0.12 0.98 ± 0.05 24.4 ± 8.8 21.7 ± 9.7 17.76 ± 6.3 0.00136 0.00042 0.77 ± 0.1 BNG 0.95 ± 0.07 1.05 ± 0.05 39.9 ± 4.2 37.4 ± 4.1 13.35 ± 1.7 0.00183 0.00022 0.89 ± 0.05 NBL 1.03 ± 0.10 1.08 ± 0.07 53.7 ± 4.75 51.8 ± 3.1 22.5 ± 4.05 0.00081 0.00043 0.65 ± 0.07 GHY 0.61 ± 0.16 1.14 ± 0.03 37.8 ± 12.6 35.5 ± 12.7 17.09 ± 5.4 0.00081 0.00033 0.71 ± 0.06
NGN NA NA 29.8 ± 3.7 26.6 ± 3.1 15.38 ± 4.1 0.00063 0.00033 0.66 ± 0.06
DOI: 10.4236/jep.2018.94026 425 Journal of Environmental Protection
distributed aerosol over the extreme western locations, which could have large contribution from transported aerosol from IGP.
• The locations in the western part of the valley are high both in absorption coefficient and scattering coefficient. The difference being more for the scat-tering coefficient manifests into higher single scatscat-tering albedo over the western locations. The sources of absorbing and scattering aerosols are probably the same along the valley.
• Northwesterly surface wind direction travelling along the IGP causes higher aerosol over the entire valley and most significantly over the western sector of the valley.
• The radiative forcing shows the highest surface level forcing over the western locations and the same was continually decreasing as we move from west to east along the valley. Higher BC aided positive forcing at atmospheric level was observed throughout the valley.
Acknowledgements
The campaign was carried out with partial support under ISRO-GBP ARFI project. The authors are thankful to Space Physics Laboratory, Trivandrum for their support in procuring instruments under the project and to Prof P K Bhuian, Centre for Atmospheric Sciences, Dibrugarh University for sharing their instruments during the campaign. The authors are also thankful to NCEP/NCAR for providing the synoptic wind plots.
References
[1] Andreae, M.O., Jones, C.D. and Cox, P.M. (2005) Strong Present-Day Aerosol Cooling Implies a Hot Future. Nature, 435, 1187-1190.
https://doi.org/10.1038/nature03671
[2] Charlson, R.J., Schwartz S.E., Hales J.M., Cess Jr., R.D., Coakley, J.A., Hansen, J.E. and Hofmann, D.J. (1992) Climate Forcing by Anthropogenic Aerosols. Science, 255, 423-430. https://doi.org/10.1126/science.255.5043.423
[3] Hansen, J., Sato, M. and Ruedy, R. (1997) Radiative Forcing and Climate Response.
Journal of Geophysical Research: Atmospheres, 102, 6831-6864. https://doi.org/10.1029/96JD03436
[4] Lohmann, H. and Feichter, J. (2005) Global Indirect Effects: A Review. Atmospheric Chemistry and Physics, 5, 715-737.
[5] Haywood, J. and Boucher, O. (2000) Estimates of the Direct and Indirect Radiative Forcing Due to Tropospheric Aerosols: A Review. Reviews of Geophysics, 38, 513-543. https://doi.org/10.1029/1999RG000078
Forc-DOI: 10.4236/jep.2018.94026 426 Journal of Environmental Protection ing by Atmospheric Aerosols to Aerosol Size and Composition. Journal of Geo-physical Research: Atmospheres, 100, 739-754. https://doi.org/10.1029/95JD02119 [8] Stocker, T.F., Qin, D., Plattner, G.K., Tignor, M., Allen, S.K., Boschung, J., Nauels,
A., Xia, Y., Bex, V. and Midgley, P.M. (2014) Climate Change 2013: The Physical Science Basis. Contribution of Working Group I to the Fifth Assessment Report of the Intergovernmental Panel on Climate Change, Cambridge University Press, Cambridge, UK, New York, 1535 p.
[9] Kaufman, Y.J., Tanre, D., Dubovik, O., Karnieli, A. and Remer, L.A. (2001) Absorp-tion of Sunlight by Dust as Inferred from Satellite and Ground-Based Remote Sens-ing. Geophysical Research Letters, 28, 1479-1482.
https://doi.org/10.1029/2000GL012647
[10] Chakrabarty, R.K., Garro, M.A., Wilcox, E.M. and Moosmuller, H. (2012) Strong Radiative Heating Due to Wintertime Black Carbon Aerosols in the Brahmaputra River Valley. Geophysical Research Letters, 39, L09804.
https://doi.org/10.1029/2012GL051148
[11] Gustafsson, O., et al. (2009) Brown Clouds over South Asia: Biomass or Fossil Fuel Combustion? Science, 323, 495-498. https://doi.org/10.1126/science.1164857 [12] Menon, S., Hansen, J., Nazarenko, N. and Luo, Y.F. (2002) Climate Effects of Black
Carbon Aerosols in China and India. Science, 297, 2250-2253. https://doi.org/10.1126/science.1075159
[13] Rajput, P., Sarin, M. and Kundu, S.S. (2013) Atmospheric Particulate Matter (PM2.5), EC, OC, WSOC and PAHs from NE-Himalaya: Abundances and Chemical Characteristics. Atmospheric Pollution Research, 4, 214-221.
https://doi.org/10.5094/APR.2013.022
[14] Moorthy, K.K., Satheesh, S.K., Babu, S.S. and Dutt, C.B.S. (2008) Integrated Cam-paign for Aerosols, Gases and Radiation Budget (ICARB): An Overview. Journal of Earth System Science, 117, 243-262. https://doi.org/10.1007/s12040-008-0029-7 [15] Gogoi, M.M., Moorthy, K.K., Babu, S.S. and Bhuyan, P.K. (2009) Climatology of
Columnar Aerosol Properties and the Influence of Synoptic Conditions: First-Time Results from the Northeastern Region of India. Journal of Geophysical Research:
Atmospheres, 114, D08202. https://doi.org/10.1029/2008JD010765
[16] Gogoi, M.M., Pathak, B., Moorthy, K.K., Bhuyan, P.K., Babu, S.S., Bhuyan, K. and Kalita, G. (2011) Multi-Year Investigations of Near Surface and Columnar Aerosols over Dibrugarh, North-Eastern Location of India: Heterogeneity in Source Impacts.
Atmospheric Environment, 45, 1714-1724. https://doi.org/10.1016/j.atmosenv.2010.12.056
[17] Pathak, B., Kalita, G., Bhuyan, K., Bhuyan, P.K. and Moorthy, K.K. (2010) Aerosol Temporal Characteristics and Its Impact on Shortwave Radiative Forcing at a Loca-tion in the North East of India. Journal of Geophysical Research: Atmospheres, 115, D19204. https://doi.org/10.1029/2009JD013462
[18] Choudhury, B., Saikia, M., Devi, M. and Barbara, A.K. (2013) A Comparative As-sessment of Aerosol Optical Properties over Guwahati through Lidar and Satellite Observation. International Journal of Engineering Sciences & Management, 3, 121-138.
[19] Devi, M., Barbara, A.K., Saikia, M., Choudhury, B. and Sarmah, H. (2012) Micro Pulse Lidar: A Tool for Analyzing Interactive Relation between Aerosol and Cloud Formation. International Journal of Engineering Sciences & Management, 2, 245-256.
DOI: 10.4236/jep.2018.94026 427 Journal of Environmental Protection the Climate Forcing and Effects of the Great Indo-Asian Haze. Journal of Geophys-ical Research: Atmospheres, 106, 371-398. https://doi.org/10.1029/2001JD900133 [21] Moorthy, K.K., Babu, S.S. and Satheesh, S.K. (2005) Aerosol Characteristics and
Ra-diative Impacts over the Arabian Sea during Inter-Monsoon Season: Results from the ARMEX Field Campaign. Journal of the Atmospheric Sciences, 62, 192-206. https://doi.org/10.1175/JAS-3378.1
[22] Bergstrom, R.W., Schmidt, K.S., Coddington, O., Pilewskie, P., Guan, H., Livings-ton, J.M., Redemann, J. and Russell, P.B. (2010) Aerosol Spectral Absorption in the Mexico City Area: Results from Airborne Measurements during MILAGRO/INTEX B. Atmospheric Chemistry and Physics, 10, 6333-6343.
[23] Jeong, M.J., Tsay, S.C., Ji, Q., Hsu, N.C., Hansell, R.A. and Lee, J. (2008) Ground-Based Measurements of Airborne Saharan Dust in Marine Environment during the NAMMA Field Experiment. Geophysical Research Letters, 35, L20805. https://doi.org/10.1029/2008GL035587
[24] Moorthy, K.K. (2010) ARFI and ICARB: Overview. Proceedings of the Project Re-view Meeting, 9-10 June 2010.
[25] Christopher, S.A., Johnson, B., Jones, T.A. and Haywood, J. (2009) Vertical and Spatial Distribution of Dust from Aircraft and Satellite Measurements during the GERBILS Field Campaign. Geophysical Research Letters, 36, L06806.
https://doi.org/10.1029/2008GL037033
[26] Jacob, D.J., Crawford, J.H., Maring, H., Clarke, A.D., Dibb, J.E., Emmons, L.K., Ferrare, R.A., Hostetler, C.A., Russell, P.B., Singh, H.B., Thompson, A.M., Shaw, G.E., McCauley, E., Pederson, J.R. and Fisher, J.A. (2010) The Arctic Research of the Composition of the Troposphere from Aircraft and Satellites (ARCTAS) Mission: Design, Execution, and First Results. Atmospheric Chemistry and Physics, 10, 5191-5212.
[27] Martin, S.T., Andreae, M.O., Artaxo, P., Baumgardner, D., Chen, Q., Goldstein, A.H., Guenther, A., Heald, C.L., Mayol-Bracero, O.L., McMurry, P.H., Pauliquevis, T., Poschl, U., Prather, K.A., Roberts, G.C., Saleska, S.R., Silva-Dias, M.A., Sprack-len, D.V., Swietlicki, E. and Trebs, I. (2010) Sources and Properties of Amazonian Aerosol Particles. Reviews of Geophysics, 48, RG2002.
https://doi.org/10.1029/2008RG000280
[28] Kulmala, M., Asmi, A., Lappalainen, H.K., et al. (2011) General Overview: European Integrated Project on Aerosol Cloud Climate and Air Quality Interactions (EUCAARI)—Integrating Aerosol Research from Nano to Global Scales. Atmos-pheric Chemistry and Physics, 11, 13061-13143.
[29] Nakajima, T., Yoon, S.C., Ramanathan, V., Shi, G.Y., et al. (2007) Overview of the Atmospheric Brown Cloud East Asian Regional Experiment 2005 and a Study of the Aerosol Direct Radiative Forcing in East Asia. Journal of Geophysical Research:
Atmospheres, 112, D24S91. https://doi.org/10.1029/2007JD009009
[30] Rahul, P.R.C., Bhawar, R.L., Ayantika, D.C., Panicker, A.S., Safai, P.D., Tharaprab-hakaran V., Padmakumari, B. and Raju, M.P. (2014) Double Blanket Effect Caused by Two Layers of Black Carbon Aerosols Escalates Warming in the Brahmaputra River Valley. Scientific Reports, 4, Article No. 3670.
https://doi.org/10.1038/srep03670
DOI: 10.4236/jep.2018.94026 428 Journal of Environmental Protection [32] Pathak, B., Bhuyan, P.K., Biswas, J. and Takemura, T. (2013) Long Term Climatol-ogy of Particulate Matter and Associated Microphysical and Optical Properties over Dibrugarh, North East India and Inter-Comparison with SPRINTARS Simulations.
Atmospheric Environment, 69, 334-344.
[33] Hansen, A.D.A., Rosen, H. and Novakov, T. (1984) The Aethalometer—An Instru-ment for the Real-Time MeasureInstru-ment of Optical Absorption by Aerosol Particles.
Science of the Total Environment, 36, 191-196. https://doi.org/10.1016/0048-9697(84)90265-1
[34] Nair, V.S., Moorthy, K.K., Alappattu, D.P., Kunhikrishnan, P.K., George, S., Nair, P.R. and Babu, S.S. (2007) Wintertime Aerosol Characteristics over the Indo-Gangetic Plain (IGP): Impacts of Local Boundary Layer Processes and Long-Range Trans-port. Journal of Geophysical Research: Atmospheres, 112, D13205.
https://doi.org/10.1029/2006JD008099
[35] Weingartner, E., Saathoff, H., Schnaiter, M., Strit, N., Bitnar, B. and Baltensperger, U. (2003) Absorption of Light by Soot Particles: Determination of the Absorption Coefficient by Means of Aethalometers. Journal of Aerosol Science, 34, 1445-1463. https://doi.org/10.1016/S0021-8502(03)00359-8
[36] Morys, M., Mims III, F.M., Hagerup, S., Anderson, S.E., Baker, A., Kia, J. and Wal-kup, T. (2001) Design, Calibration, and Performance of MICROTOPS II Hand-Held Ozone Monitor and Sun Photometer. Journal of Geophysical Research: Atmos-pheres, 106, 14573-14582. https://doi.org/10.1029/2001JD900103
[37] Ricchiazzi, P., Yang, S., Gautier, C. and Sowle, D. (1998) SBDART: A Research and Teaching Software Tool for Plane-Parallel Radiative Transfer in the Earth’s Atmos-phere. Bulletin of the American Meteorological Society, 79, 2101-2114.
https://doi.org/10.1175/1520-0477(1998)079<2101:SARATS>2.0.CO;2
[38] Dubovik, O., Holben, B.N., Eck, T.F., Smirnov, A., Kaufman, Y.J., King, M.D., Ta-nre, D. and Slutsker, I. (2002) Variability of Absorption and Optical Properties of Key Aerosol Types Observed in Worldwide Locations. Journal of the Atmospheric Sciences, 59, 590-608.
https://doi.org/10.1175/1520-0469(2002)059<0590:VOAAOP>2.0.CO;2
[39] Eck, T.F., Holben, B.N., Reid, J.S., Dubovic, O., Smirnov, A., O’Neill, N.T., Slutsker, I. and Kinne, S. (1999) Wavelength Dependence of the Optical Depth of Biomass Burning, Urban, and Desert Dust Aerosols. Journal of Geophysical Research: At-mospheres, 104, 31333-31349. https://doi.org/10.1029/1999JD900923
[40] Angstrom, A. (1929) On the Atmospheric Transmission of Sun Radiation and on Dust in the Air. Geografiska Annaler, 11, 156-166. https://doi.org/10.2307/519399 [41] Pathak, B., Bhuyan, P.K., Gogoi, M.M. and Bhuyan, K. (2012) Seasonal
Heterogene-ity in Aerosol Types over Dibrugarh-North-Eastern India. Atmospheric Environ-ment, 47, 307-315. https://doi.org/10.1016/j.atmosenv.2011.10.061
[42] Ganguly, D., Jayaraman, A. and Gadhavi, H. (2006) Physical and Optical Properties of Aerosols over an Urban Location in Western India: Seasonal Variabilities. Jour-nal of Geophysical Research: Atmospheres, 111, D242007A06.
https://doi.org/10.1029/2006JD007392
[43] Cachorro, V.E., Vergaz, R., Martin, M.J., De Frutos, A.M., Vilaplana, J.M. and De la Morena, B. (2002) Measurements and Estimation of the Columnar Optical Depth of Tropospheric Aerosols in the UV Spectral Region. Annales Geophysicae, 20, 565-574.
Proper-DOI: 10.4236/jep.2018.94026 429 Journal of Environmental Protection ties of Aging Smoke Particles in Brazil. Journal of Geophysical Research: Atmos-pheres, 104, 27473-27489. https://doi.org/10.1029/1999JD900833
[45] Kaskaoutis, D.G. and Kambezidis, H.D. (2006) Checking the Validity of the Angstrom’s Formula with Spectral Data of Direct-Beam Irradiance Obtained in Athens, Greece. Atmospheric Research, 79, 67-87.
https://doi.org/10.1016/j.atmosres.2005.05.001
[46] Eck, T.F., Holben, B.N., Dubovic, O., Smirnov, A., Slutsker, I., Lobert, J.M. and Ra-manathan, V. (2001) Column-Integrated Aerosol Optical Properties over the Mal-dives during the Northeast Monsoon for 1998-2000. Journal of Geophysical Re-search: Atmospheres, 106, 28555-28566. https://doi.org/10.1029/2001JD000786 [47] Eck, T.F., Holben, B.N., Dubovic, O., Smirnov, A., Goloub, P., Chen, H.B.,
Chate-net, B., Gomes, L., Zhang, X.Y., Tsay, S.C., Ji, Q., Giles, D. and Slutsker, I. (2005) Columnar Aerosol Optical Properties at AERONET Sites in Central Eastern Asia and Aerosol Transport to the Tropical Mid-Pacific. Journal of Geophysical Re-search: Atmospheres, 110, D06202. https://doi.org/10.1029/2004JD005274
[48] O’Neill, N.T., Eck, T.F., Holben, B.N., Smirnov, A., Dubovik, O. and Royer, A. (2001) Bimodal Size Distribution Influences on the Variation of the Ångström De-rivatives in Spectral and Optical Depth Space. Journal of Geophysical Research:
Atmospheres, 106, 9787-9806. https://doi.org/10.1029/2000JD900245
[49] Pedrós, R., Martinez-Lozano, J.A., Utrillas, M.P., Gomez-Amo, J.L. and Tena, F. (2003) Column-Integrated Aerosol, Optical Properties from Ground-Based Spec-troradiometer Measurements at Barrax (Spain) during the Digital Airborne Imaging Spectrometer Experiment (DAISEX) Campaigns. Journal of Geophysical Research:
Atmospheres, 108, 4571-4587. https://doi.org/10.1029/2002JD003331
[50] Kaskaoutis, D.G., Kambezidis, H.D., Hatzianastassiou, N., Kosmopoulos, P.G. and Badarinath, K.V.S. (2007) Aerosol Climatology: Dependence of the Angstrom Ex-ponent on Wavelength over Four AERONET Sites. Atmospheric Chemistry and Physics, 7, 7347-7397. https://doi.org/10.5194/acpd-7-7347-2007
[51] Schuster, G.L., Dubovik, O. and Holben, B.N. (2006) Angstrom Exponent and Bi-modal Aerosol Size Distributions. Journal of Geophysical Research: Atmospheres, 111, D07207. https://doi.org/10.1029/2005JD006328
[52] Pathak, B., Borgohain, A., Bhuyan, P.K., Kundu, S.S., Sudhakar, S., Gogoi, M.M. and Takemura, T. (2014) Spatial Heterogeneity in Near Surface Aerosol Characte-ristics across the Brahmaputra Valley. Journal of Earth System Science, 123, 651-663. https://doi.org/10.1007/s12040-014-0431-2
[53] Bond, T.C., Doherty, S.J., Fahey, D.W., et al. (2013) Bounding the Role of Black Carbon in the Climate System: A Scientific Assessment. Journal of Geophysical Re-search: Atmospheres, 118, 5380-5552. https://doi.org/10.1002/jgrd.50171
[54] Kirchstetter, T.W., Novakov, T. and Hobbs, P.V. (2004) Evidence That the Spectral Dependence of Light Absorption by Aerosols Is Affected by Organic Carbon. Jour-nal of Geophysical Research: Atmospheres, 109, D21208.
https://doi.org/10.1029/2004JD004999
[55] Ganguly, D., Jayaraman, A., Gadhavi, H. and Rajesh, T.A. (2005) Features in Wave-length Dependence of Aerosol Absorption Observed over Central India. Geophysi-cal Research Letters, 32, L13821. https://doi.org/10.1029/2005GL023023
[56] Krishnan, P. and Kunhikrishnan, P.K. (2004) Temporal Variations of Ventilation Coefficient at a Tropical Indian Station Using UHF Wind Profiler. Current Science, 86, 447-451.
Sin-DOI: 10.4236/jep.2018.94026 430 Journal of Environmental Protection gle-Scattering Albedo and Radiative Forcing of Various Aerosol Species with a Global Three-Dimensional Model. Journal of Climate, 15, 333-352.
https://doi.org/10.1175/1520-0442(2002)015<0333:SSAARF>2.0.CO;2
[58] Ackerman, A.S., Toon, O.B., Stevens, D.E., Heymsfield, A.J., Ramanathan, V. and Welton, E.J. (2000) Reduction of Tropical Cloudiness by Soot. Science, 288, 1042-1047. https://doi.org/10.1126/science.288.5468.1042
[59] Heintzenberg, J. and Charlson, R.J. (1996) Design and Applications of the Integrat-ing Nephelometer: A Review. Journal of Atmospheric and Oceanic Technology, 13, 987-1000. https://doi.org/10.1175/1520-0426(1996)013<0987:DAAOTI>2.0.CO;2 [60] Tripathi, S.N., Dey, S., Tare, V. and Satheesh, S.K. (2005) Aerosol Black Carbon
Ra-diative Forcing at an Industrial City in Northern India. Geophysical Research Let-ters, 32, L08802. https://doi.org/10.1029/2005GL022515
[61] Hess, M., Keopke, P. and Schult, I. (1998) Optical Properties of Aerosols and Clouds: The Software Package OPAC. Bulletin of the American Meteorological So-ciety, 79, 831-844.
https://doi.org/10.1175/1520-0477(1998)079<0831:OPOAAC>2.0.CO;2
[62] Gogoi, M.M., Babu, S.S., Moorthy, K.K., Bhuyan, P.K., Pathak, B., Subba, T., Chutia, L., Kundu, S.S., Bharali, C., Borgohain, A., Guha, A., De, B.K., Singh, B. and Chin, M. (2017) Radiative Effects of Absorbing Aerosols over Northeastern India: Obser-vations and Model Simulations. Journal of Geophysical Research: Atmospheres, 122, 1132-1157. https://doi.org/10.1002/2016JD025592
[63] Pathak, B., Subba, T., Dahutia, P., Bhuyan, P.K., Moorthy, K.K., Gogoi, M.M., Babu, S.S., Chutia, L., Ajay, P., Biswas, J., Bharali, C., Borgohain, A., Dhar, A., Guha, A., De, B.K., Banik, T., Chakraborty, M., Kundu, S.S., Singh, S.B. and Sudhakar, S. (2015) Aerosol Characteristics in North-East India Using ARFINET Spectral Opti-cal Depth Measurements. Atmospheric Environment, 125, 461-473.
https://doi.org/10.1016/j.atmosenv.2015.07.038