http://www.scirp.org/journal/ce ISSN Online: 2151-4771
ISSN Print: 2151-4755
DOI: 10.4236/ce.2018.95049 Apr. 20, 2018 675 Creative Education
Evaluation of the “e-Daftar” System
Using the Technology Acceptance
Model (TAM)
Rohaila Mohd Rosly, Fariza Khalid
Faculty of Education, Universiti Kebangsaan Malaysia, Bangi, Malaysia
Abstract
Diverse management information systems have been developed to meet or-ganisations’ needs and fulfil their strategic management functions. These in-clude NIOSH, which uses e-Daftar: a training-related information manage-ment system developed by the Information Technology Division of NIOSH. This study aims to measure the level of acceptance of the e-Daftar system among NIOSH employees, and its effectiveness. The Acceptance Technology Model (TAM), with the independent variables of perceived usefulness (PU), perceived ease of use (PEOU), and attitude towards using (ATU) is the basis of analysis. This study is a descriptive survey using a quantitative approach. A total of 180 participants were involved, comprising NIOSH staff who use the e-Daftar system, and 126 samples, obtained using the Krejcie and Morgan methods, were analysed. Questionnaires were distributed online using the Question Pro application, and analysed using the Statistical Package for Social Science (SPSS) v23.0. The results show that the perception of ease of use has a significant relationship with attitudes to the use of the e-Daftar system. In ad-dition, regression test results indicate that the perception of usefulness and perceived ease of use has a positive effect on attitudes to the use of e-Daftar, and perceived ease of use is the most significant predictor of attitudes toward consumption. In conclusion, the use of e-Daftar is very effective for the pur-pose of information management training when the level of user acceptance of the system is high. This study is expected to provide suggestions for im-provements to existing applications, as well as reference material for future research.
Keywords
Management Information Systems, Technology Acceptance Model (TAM), Ease of Use, Usefulness
How to cite this paper: Rosly, R. M., & Khalid, F. (2018). Evaluation of the “e- Daftar” System Using the Technology Ac-ceptance Model (TAM). Creative Educa-tion, 9, 675-686.
https://doi.org/10.4236/ce.2018.95049
Received: February 5, 2018 Accepted: April 17, 2018 Published: April 20, 2018
Copyright © 2018 by authors and Scientific Research Publishing Inc. This work is licensed under the Creative Commons Attribution International License (CC BY 4.0).
http://creativecommons.org/licenses/by/4.0/
DOI: 10.4236/ce.2018.95049 676 Creative Education
1. Introduction
Management information systems (MIS) are a crucial part of information and data management across the globe, as they have an impact that can affect the smooth operation of an organisation as a whole. The management information system has a huge impact on an organisation’s productivity and effectiveness in terms of the implementation of daily tasks and decision-making processes
(Al-Adaileh 2009). With the use of an MIS, information management and
stor-age are safe and effective, which will facilitate the maintenance process (Said,
Haruzuan, Suhaimin, & Marini, 2010) in addition to enhancing the effectiveness
of customer service and organisation (Chowdhury et al. 2013).
Efficient data management is an element of an organisation’s competitive strategy (Hasan, Shamsudin, & Aziati, 2013). Most organisations fail to see the importance of implementing the management of training records despite the fact that systematic information management could determine the resiliency and competitiveness of an organisation (Aziz, Yusof, & Asma’Mokhtar, 2011). The importance of creating a systematic information management system has an impact on a country, including educational institutions. The National Institute of Occupational Safety and Health (NIOSH), a training institute that provides training services and consultancy, disseminates information and conducts re-search in the field of occupational safety and health, has taken the initiative to develop a training management system known as e-Daftar, in line with the elec-tronic government policy.
For every organisation, the acceptance of innovation proves to be a challeng-ing and dauntchalleng-ing task (Khalid et al., 2014). Management information systems are normally limited to accounting systems, adequate skills to manage the sys-tem and preparation to use the syssys-tem. With the acceptance of technology the method of work in an organisation will be altered, as technological changes often affect the activity of work and the needs for users with different skills.
The Technology Acceptance Model (TAM) introduced by Davis (1989)
elaborates on the acceptance and effectiveness of a technology system based on three (3) constructs, namely perceived usefulness (PU), perceived ease of use (PEOU) and attitude toward using (ATU). This study aims to identify the rela-tionships and effects of the perceived usefulness, perceived ease of use and atti-tudes toward the use of the NIOSH e-Daftar system.
2. Management Information Systems in Malaysia
Medan & Ningsih (2010) defines a system as an element that is interconnected to
form a unity, and it is created to achieve a specific target and objective. Patterson
(2005)defines a Management Information System (MIS) as a system that
organisa-DOI: 10.4236/ce.2018.95049 677 Creative Education
tions and institutions around the world, including Malaysia. The implementa-tion of MIS in instituimplementa-tions involves the process of collecting data, processing, storing, and delivering relevant information for the purpose of managing work more efficiently and effectively within the organisation.
In Malaysia, the use of MIS was pioneered by the Malaysia Central Electricity Board (Lembaga Letrik Malaysia—LLM) for its accounting and payroll system in 1965. This was followed by the Malaysia Tax Return Agency (Jabatan Hasil
Dalam Negeri—LHDN), which used a statistical information processing system,
and was followed by other organisations. The goal and purpose of these diverse MIS are the same: namely, managing data, information and resources to im-prove work performance, efficiency and productivity within an organisation
(Salleh, 2014). Hence, as Malaysia strives towards becoming a high-income
country, emphasising innovation is crucial, as it could help the country to be-come a competitive nation (Shairil & Hasnah, 2013). Among the management information systems used in Malaysia are Human Resource Information Man-agement Systems (Sistem Maklumat Pengurusan Sumber Manusia—HRMIS), Polytechnic Information Management Systems (Sistem Maklumat Pengurusan
Politeknik—SMPP), Students Database Applications (Aplikasi Pangkalan Data
Murid—APDM), and others.
In the context of management information systems at NIOSH, the e-Daftar system was developed as a platform for information management for courses conducted at NIOSH. It supports data storage, systematic sharing of information and increased efficiency. It is run on local network that allows internal users to access any course-related information quickly and accurately.
2.1. e-Daftar System
e-Daftar is a training management information system that manages and stores data related to NIOSH courses and relevant information about participants. It was developed by the Information Technology Division (ITD), which aims to fa-cilitate the process of managing all data and information centrally. NIOSH also recognises the importance of the development of e-Daftarand information shar-ing, as this can improve the efficiency of daily tasks and the safekeeping and re-cording of information. From the perspective of administration and manage-ment, it can help and educate consumers, especially NIOSH staff, to master the use of technology and the data management process in a more orderly and effi-cient manner. The functions and features contained in the e-Daftar system are as follows:
1) Centralised and scheduled management of courses.
2) Preparation of reports and statistics for management purposes. 3) Increased efficiency through accurate and quick review of information. 4) Centralised certificate management.
5) Integrated modules.
ap-DOI: 10.4236/ce.2018.95049 678 Creative Education
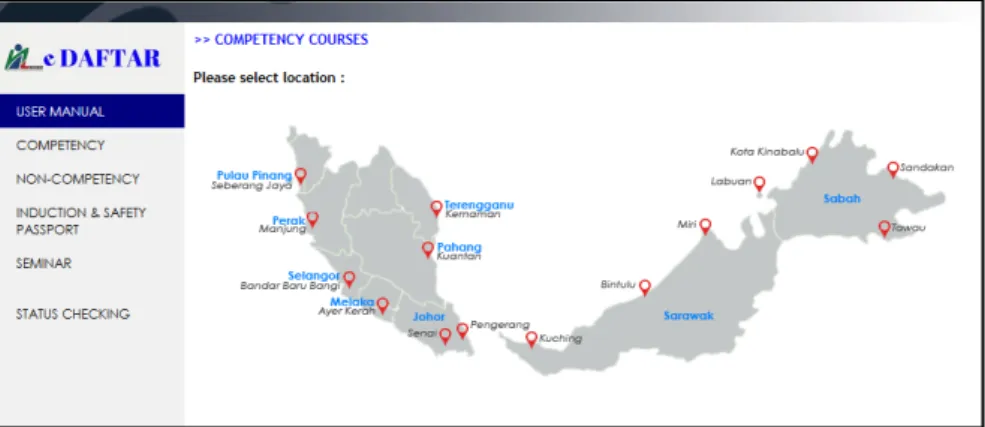
plication software from Lotus Designer (Figure 1). The programming language is composed of Lotus script, JavaScript and html. Users of e-Daftar comprise support staff who are directly involved with the training participants. The system consists of several modules, as follows:
1) Course Scheduling Module: schedules a list of courses according to type and location.
2) Participant Registration Module: allows the coordinator to manage partici-pants’ information, either through online registration or walk-in (Figure 2).
3) Facilitator Assessment: facilitates performance evaluation of trainers. 4) E-Quotation: allows the coordinator to issue quotations for the relevant course according to specifications.
5) Reports and Statistics: supports reports management and retrieval of statis-tics.
6) Printing: issues various course-related letters.
7) Results checking: allows participants to review their assessment results
(Figure 3).
8) Certification: manages certificate issuance centrally.
Figure 1. e-Daftar System
(source: http://intranet.niosh.com.my/ikkpn/kalendarkursusV2.nsf/).
DOI: 10.4236/ce.2018.95049 679 Creative Education Figure 3. Result Checking
(source: http://intranet.niosh.com.my/exam/semakan.nsf/).
2.2. Technology Acceptance Model (TAM)
The Technology Acceptance Model (TAM) was developed by Davis (1989) and augmented by Venkatesh et al. (2003) as shown in Figure 4. TAM was adapted from the Theory of Reasoned Action (TRA) Model, which was introduced by
Ajzen & Fishbein (1980). TAM is often used in research involving information
technology systems and to assess their effectiveness for the users. Therefore, this study is constructed based on TAM, which includes a) perceived usefulness (PU), b) perceived ease of use (PEOU), and c) attitudes towards using (ATU).
Davis (1989) defines perceived ease of use as an individual’s view of the ease
of use of a specific system, i.e. whether it is easy to understand and not difficult to learn. In this study, people do not need a lot of effort in terms of time and en-ergy in studying the use of e-Daftar.
Perceived usefulness is defined as “the extent to which the person believes that using a particular system would enhance the performance of the individual”
(Davis, 1989). In this study, the intended internal users find the use of e-Daftar
beneficial, especially in terms of increasing productivity and working more effi-ciently. Attitudes toward using is defined by Davis (1989) as the positive or negative feelings of people who use the system. Attitudes towards using in the context of this study will assess internal consumer attitudes to using the e-Daftar app and whether they are open to it or otherwise.
DOI: 10.4236/ce.2018.95049 680 Creative Education
Figure 4. Technology Acceptance Model (TAM) (source:
Davis, 1989).
Ha1: There is a significant relationship between perceived ease of use,
per-ceived usefulness and attitudes towards using e-Daftar.
Ha2: Perceived ease of use has a positive impact on users’ attitudes towards
using e-Daftar.
Ha3: Perceived usefulness has a positive impact on users’ attitudes towards
us-ing e-Daftar.
3. Methodology
This study used a descriptive research method to develop a quantitative design regarding the relationship between the three constructs using TAM. Structured questionnaires were the main research instrument in this study. According to Cheung (2014), structured questionnaire is a document that consists of a set of standardized questions with a fixed scheme, which specifies the exact wording and order of the questions, for gathering information from respondents.The re-searchers choose to use a questionnaire to obtain information from a large number of respondents. The cost of developing a questionnaire is cheap, and the time required is much shorter than that needed for an experimental study
(Gill-ham, 2008). The study was focused on NIOSH’s head quarters located in Bandar
BaruBangi, Selangor, and its regional offices located in Johor, Malacca, Penang, Terengganu, Pahang and Sabah and Sarawak.
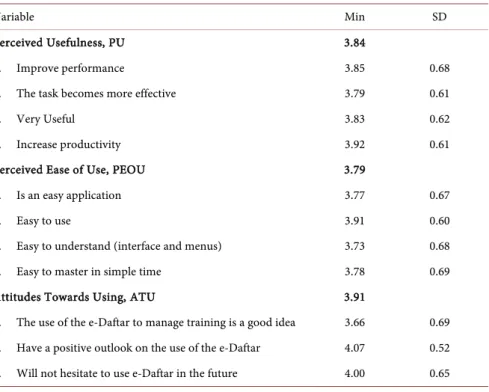
The study’s population consisted of NIOSH support staff who use e-Daftar, totalling 180 people. The population was derived using a sampling approach de-veloped by Krejcie & Morgan (1970), and a total of 126 questionnaires were col-lected and analysed using the Statistical Package for Social Science (SPSS) ver-sion 23.0. All the questions were adapted from TAM’s founders, but were refined to suit the study’s requirements. Respondents’ evaluations were based on five-point Likert scale: 1 = strongly disagree, 2 = disagree, 3 = neutral, 4 = agree, 5 = strongly agree. The questionnaire was the main instrument used to obtain quantitative results from the respondents, and online distribution was used as a technique to collect the data. For each of the constructs studied, there are several items perceived to be suitable as a questionnaire. All of these questions are adapted from the founders of Theory and Model but are processed according to the suitability of this study. Table 1 shows items based on constructs that have been identified.
DOI: 10.4236/ce.2018.95049 681 Creative Education Table 1. Structured questionaire by Construct.
Variable Min SD
Perceived Usefulness, PU 3.84
1. Improve performance 3.85 0.68
2. The task becomes more effective 3.79 0.61
3. Very Useful 3.83 0.62
4. Increase productivity 3.92 0.61
Perceived Ease of Use, PEOU 3.79
1. Is an easy application 3.77 0.67
2. Easy to use 3.91 0.60
3. Easy to understand (interface and menus) 3.73 0.68
4. Easy to master in simple time 3.78 0.69
Attitudes Towards Using, ATU 3.91
1. The use of the e-Daftar to manage training is a good idea 3.66 0.69 2. Have a positive outlook on the use of the e-Daftar 4.07 0.52 3. Will not hesitate to use e-Daftar in the future 4.00 0.65
Table 2 shows that the level of reliability is 0.74 to 0.85, which exceeds the
benchmark level of reliability of 0.70, as proposed by Hair (2010). This indicates a high level of reliability. The interpretation of data linkage analysis for this study was based on a proposal by Cohen (1988), as shown in Table 3.
4. Research Findings
A total of 126 NIOSH employees were involved in this study. The findings focus on the demographic, analysis and effect relationship between the three con-structs used. Table 4 shows the descriptive data for the respondents.
The Impact of Perceived Ease of Use and Perceived Usefulness on
Users’ Attitudes towards Using e-Daftar
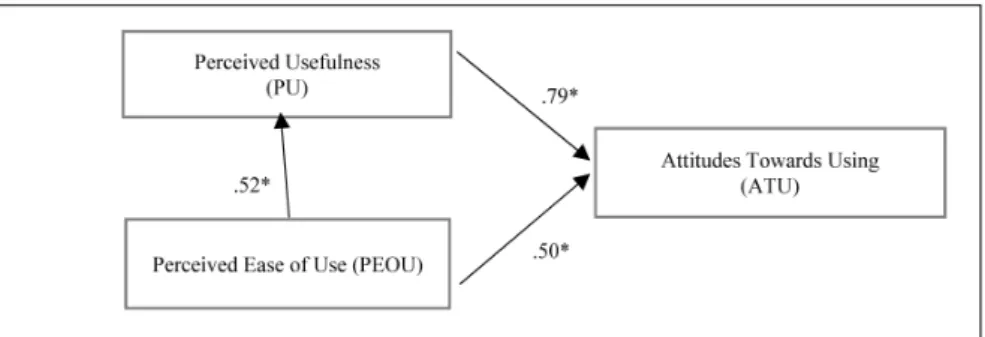
To test Ha1, a Pearson correlation test was carried out to analyse the relationship
between variables of perceived usefulness and perceived ease of use with regard to e-Daftar. A summary of the correlation for all constructs using Pearson cor-relation is shown in Figure 5.
As seen in Figure 5, the Pearson correlation between perceived usefulness (PU), perceived ease of use (PEOU) and attitudes towards using (ATU) shows that there is significant and positive correlation between the three variables tested. Therefore, Ha1is accepted. To test Ha2 and Ha3, a multiple regression test
DOI: 10.4236/ce.2018.95049 682 Creative Education Table 2.Reliability test of the instrument.
Variable No of Item Alpha Cronbach (α)
Perceived Ease of Use, PEOU 4 0.74
Perceived Usefulness, PU 4 0.81
Attitudes Towards Using, ATU 3 0.85
Table 3. Interpretation.
r, value Interpretation
±0.10 to 0.29 Low
0.30 to 0.49 Average
0.50 to 1.00 High
Table 4. Interpretation
Category Frequency %
Gender Male 59 46.80
Female 67 53.20
Age 20 - 29 years 59 46.80
30 - 39 years 67 53.20
Work experience
1 - 5 years 51 40.50
6 - 10 years 64 50.80
Over 10 years 11 8.70
Location Headquarters 61 48.40
Regional Office 65 51.60
Table 5. Impact of perceived usefulness and perceived ease of use on attitudes towards the use of e-Daftar.
Model Sum Square df Square Mean F Sig
Regression 165.46 2 82.73 98.44 0.000
Residual 103.363 123 0.840
Total 268.82 125
a. Constant: perceived ease of use and perceived usefulness b. Dependent Variable = attitude toward using.
between the independent variables (perceived ease of use and perceived useful-ness) and the dependent variable (attitudes towards using). Based on the results, as much as 61% of the variation (R2) in attitudes towards consumption is af-fected by predictor variables (perceived ease of use and perceived usefulness). A total of 39% of the variation cannot be explained by this model. This means that there are factors beyond the control of the researchers.
DOI: 10.4236/ce.2018.95049 683 Creative Education Figure 5. The relationship between the constructs of TAM in the use of the e-Daftar.
Table 6. ANOVA test.
Model β SE t Sig
Constant 2.21 0.77 2.84 0.005
Perceived usefulness 0.11 0.05 2.06 0.041
Perceived ease of use 0.50 0.04 10.71 0.000
a. Constant: perceived ease of use and perceived usefulness.
results of the ANOVA test show that the relationship between the predictors (perceived ease of use and perceived usefulness) was significant (p < 0.05) with the F (2123) = 98.44, p < 0.05. Therefore, Ha2 and Ha3are accepted.
Table 7 describes the significance of the influence of perceived ease of use and
perceived usefulness on attitudes towards consumption.
Regarding Table 7, perceived ease of use as an independent variable was found to have a significant influence on attitudes towards the use of the use of e-Daftar (β = 0.50, p = 0.00). This shows that perceived ease of use is the most significant predictor of attitudes towards using e-Daftar among employees of NIOSH, although clearly both predictors have a coefficient value with a signifi-cant influence on attitudes towards consumption. This means that the higher the perceived ease of use of e-Daftar, the higher its perceived usability. Logically, if the system is easier to use, it will be more beneficial to use. The regression results show that the linear equations that can be developed to predict attitudes toward the use of the e-Daftar system are as follows:
Y = 2.21 + 0.11X1 + 0.50X2
where Y = attitudes towards using, the constant = 2.21, X1 = perceived useful-ness, and X2 = perceived ease of use. This means an increase of 1 unit of per-ceived usefulness will result in attitudes towards using increasing by 0.11 units, and if the perceived ease of use increases by 1 unit, the attitude towards using will increase by 0.50 units.
5. Discussions
DOI: 10.4236/ce.2018.95049 684 Creative Education Table 7. The significance of the influence of perceived usefulness and perceived ease of use on attitudes towards the use of e-Daftar.
Model R R2 R2 adjusted
1 0.78 0.61 0.60
show that the relationship between perceived ease of use (PEOU) and perceived usefulness (POU) is significant with regard to attitudes towards using (ATU), with values of r = 0. 50, p < 0.05 and r = 0. 77, p < 0.05. This supports the origi-nal development of TAM by Davis et al. (1989) and Venkatesh et al. (2003), and studies conducted by Sages et al. (2012), Cheng et al. (2013)and Isaac (2015).
When people feel that the e-Daftar system is easy to use, they assume that it will be very beneficial for their daily tasks. This perception also works in reverse, in that if a user feels the benefits of using e-Daftar while performing their tasks, they will automatically feel that it is easy to use. This statement is supported by
Muntianah et al. (2012) and Zakaria & Khalid (2016), who state thatthe easier a
user feels it is to use a technology, the greater the benefits received by the user. Therefore, to prevent users rejecting a system, the system must be easy to use without the need for extra effort that is burdensome (Miftah & Wulandari,
2015).
Through a multiple linear regression test (see Table 6), the value of the beta coefficient of perception of ease of use is higher than the beta coefficient of the perception of usefulness. This shows the influence of perceived ease of use on at-titudes towards using is stronger than the influence of perceived usefulness. This finding is consistent with the results of a study conducted by Chen et al. (2012)
and Putra et al. (2015). This means that the easier the e-Daftar system is to use,
the greater the usefulness of the system, and the main factor in its being well-received is due to its ease of use. “Ease” refers to the system being easy to learn, while usability refers to increased efficiency and ease of work.
6. Conclusion
em-DOI: 10.4236/ce.2018.95049 685 Creative Education
phasise the acceptance of applications based on the TAM through this study.
References
Ajzen, I., & Fishbein, M. (1980). Understanding Attitudes and Predicting Social Behavior. Al-Adaileh, M. R. (2009). An Evaluation of Information Systems Success: A User
Perspective—The Case of Jordan Telecom Group. European Journal of Scientific Research, 37, 226-239.
Aziz, N. U. A., Yusof, Z. M., & Asma’Mokhtar, U. (2011). Aplikasi ICT dalamPengurusan Rekod: Kajian Kesdalam Jabatan Kerja Raya Malaysia. Jurnal Teknologi Maklumatdan Multimedia, 10, 21-33.
Chen, H. H., Lee, M. C., Wu, Y. L., Qiu, J. Y., Lin, C. H., Tang, H. Y., & Chen, C. H. (2012). An Analysis of Moodle in Engineering Education: The TAM Perspective. 2012 IEEE International Conference on Teaching, Assessment and Learning for Engineering (TALE) (pp. H1C-1).
Cheng, Y. M., Lou, S. J., Kuo, S. H., & Shih, R. C. (2013). Investigating Elementary School Students’ Technology Acceptance by Applying Digital Game-Based Learning to Envi-ronmental Education. Australasian Journal of Educational Technology, 29, 96-110.
https://doi.org/10.14742/ajet.65
Chowdhury, M. S. A., Yunus, M., Bhuiyan, F., & Kabir, M. R. (2013). Impact of Human Resources Information System (HRIS) on the Performance of Firms: A Study on Some Selected Bangladeshi Banks. Proceedings of 9th Asian Business Research Conference,
Dhaka.
Cohen, J. (1988). Statistical Power Analysis for the Behavioural Sciences (2nd. Ed). Hills-dale, NJ: Erlbaum.
Davis, F. D. (1989). Perceived Usefulness, Perceived Ease of Use, and User Acceptance of Information Technology. MIS Quarterly, 13, 319-340.
https://doi.org/10.2307/249008
Destiana, I., & Salman, A. (2015). The Acceptance, Usage and Impact of Social Media among University Students. e-BANGI, 10, 58.
Gillham, B. (2008). Developing a Questionnaire. A & C Black.
Hair (2010). Multivariate Data Analysis: A Global Perspective. London, Upper Saddle River, NJ: Pearson Education.
Hasan, Y., Shamsuddin, A., & Aziati, N. (2013). The Impact of Management Information Systems Adoption in Managerial Decision Making: A Review. The International Scien-tific Journal of Management Information Systems, 8, 10-17.
Khalid, F., Joyes, G., Ellison, L., & Daud, M. D. (2014). Factors Influencing Teachers’ Lev-el of Participation in Online Communities. International Education Studies, 7, 23-32. https://doi.org/10.5539/ies.v7n13p23
Krejcie, R. V., & Morgan, D. W. (1970). Determining Sample Size for Research Activities.
Educational and Psychological Measurement, 30, 607-610. https://doi.org/10.1177/001316447003000308
Medan, P. P. B. S., & Ningsih, D. G. (2010). Perancangan Sistem Informasi Data Simpan. Miftah, D., & Wulandari, H. (2015). The Effect Analysis of Cognitive and Personal
Inten-tion in Using Internet Technology: An Indonesian Student Case Study. In Proceeding of International Conference on Accounting Studies (pp. 57-63).
DOI: 10.4236/ce.2018.95049 686 Creative Education (TAM). (Studi Kasus Pada Kegiatan Belajar Mahasiswa Fakultas Ilmu Administrasi Universitas Brawijaya Malang). Profit, 6, 88-113.
Patterson, A. (2005). Information Systems—Using Information, Learning and Teaching Scotland.
Putra, M. A., Winarno, W. W., & Hantono, B. S. (2015). Analisis Penerimaan Pengguna Dengan Technology Acceptance Model (TAM) Pada Mobile Pusat Layanan Internet Kecamatan (MPLIK) Di Kabupaten Tapanuli Selatan. Semnasteknomedia Online, 3,
3-4.
Said, M. N. H., & Suhaimin, I. M. (2010). Pembangunan Sistem Pengurusan Maklumat Pelajar (pp. 1-8).
Salleh, M. A. M. (2014). Online Communication Satisfaction towards the Use of Inter-net-Based Information Management Systems: A Study at Four Research Universities in Malaysia. Malaysian Journal of Communication, 30, 29-42.
https://doi.org/10.17576/JKMJC-2014-30SI-03
Shairil, I. T., & Hasnah, A. (2013). Penerimaan pengguna terrhadap kaedah pembayaran elektronik. Jurnal Ekonomi Malaysia, 47, 3-12.
Venkatesh, V., Morris, M. G., Davis, G. B., & Davis, F. D. (2003). User Acceptance of In-formation Technology: Toward a Unified View. MIS Quarterly, 27, 425-478.
https://doi.org/10.2307/30036540
Yunastiti, F. I., & Baridwan, Z. (2014). Penerimaan Individu Terhadap Sistem Informasi-Berbasiskomputer: Pendekatan Modified Technology Acceptance Model (TAM). Jur-nalIlmiah Mahasiswa FEB, 2.