The User Experience Questionnaire and
the impact of early information processing
Bachelor-thesis by Svenja Polst
University of Twente
First Supervisor: Dr. Martin Schmettow Second Supervisor: Msc. Inga Schwabe
Department: Human factors and engineering psychology Faculty: Behavioural Science
Acknowledgments
Abstract
Abbreviations
HCI Human Computer Interaction HQ hedonic quality
PT prototypicality
UEQ user experience questionnaire UX user experience
Contents
1 Introduction ... 6
1.1 Judging user experience ... 6
1.1.1 Aesthetic and usability ... 7
1.1.2 The user experience questionnaire ... 8
1.2 Cognitive processes underlying judgments ... 9
1.3 The study by Tuch et al. (2012) and replications of it ... 12
1.4 Hypotheses ... 14
2 Method ... 17
2.1 Participants ... 17
2.2 Design ... 17
2.3 Material ... 17
2.3.1 Items ... 17
2.3.2 Stimuli ... 19
2.3.3 Computer ... 19
2.3.4 Procedure ... 19
2.4 Data analysis ... 20
3 Results ... 20
4 Discussion ... 26
4.1 UEQ and the cognitive models ... 26
4.2 UEQ in comparison to similar studies ... 27
4.3 Prototypicality and visual complexity ... 30
4.4 Limitations ... 31
4.5 Future research ... 33
5 Conclusion ... 34
6 References ... 36
Appendix A ... 40
Appendix B ... 41
Appendix C... 42
1
Introduction
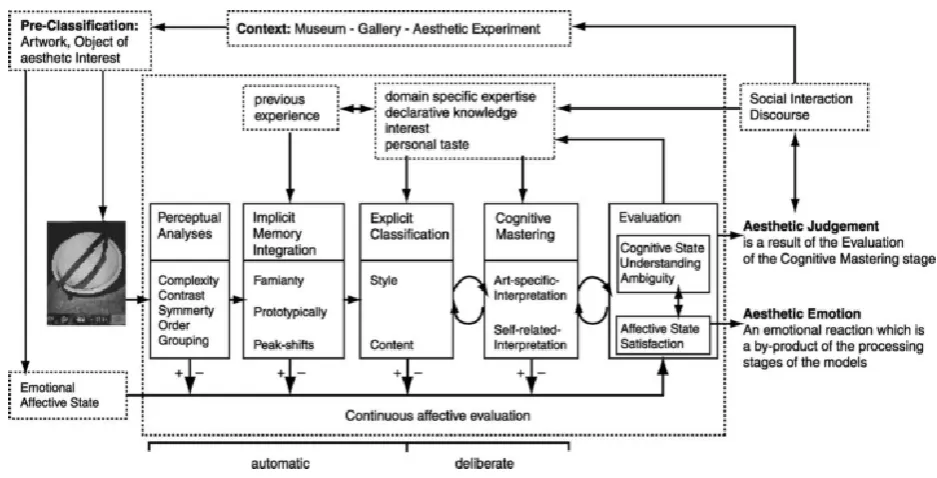
People use the World Wide Web as a source of primary information. While searching information, users visit multiple websites. Within seconds the user decides whether to stay on a site or to continue searching the web. The user may stay when he has a positive first impression (Tuch, Presslaber, Stöcklin, Opwis, & Bargas-Avila, 2012). Thus, creating a good first impression is essential in human-computer interaction (HCI). However there is little time to do this. Research by Papachristos and Avouris (2011) claims that 500ms are sufficient to make a judgment about novelty, credibility, visual appeal and perceived usability. Lindgaard, Fernandes, Dudek, and Brown (2006) state that even 50 ms are enough to judge visual appeal. But some authors of these studies, researching user experience (UX), are not taking the important distinction between perception and judgment into account. This may affect the validation of their studies. The information-processing model demonstrates the difference; the perception of an object is processed at different cognitive stages finally leading to the judgment of an object (Leder, Belke, Oeberst, & Augustin, 2004a). The cognitive processes are not fully understood so far. The fluency model by Schmettow and Nazareth (2014) is a good contribution to the research about perceiving and judging websites. They found that the ease of processing the perception of a website influences the judgment of it. Tuch et al. (2012) also take the distinction between perception and judgment seriously. By basing their experiment on the model by Leder et al. (2004), they not only found that judgments on aesthetic are possible at a presentation time of 17ms, but also that prototypicality and visual complexity influence the judgment. We replicate this study by judging the User Experience Questionnaire (UEQ). This questionnaire unifies different constructs of UX. The objective is to learn more about the cognitive processes that influence the judgments on UEQ at the early information-processing stages and to find out to what extend the judgments on UEQ are in line with the fluency model. The results can be used to design websites according to the cognitive processes rather than superficial judgments.
1.1
Judging user experience
1.1.1 Aesthetic and usability
When rating usability, it is important to distinguish between objective usability and judged usability. In the literature, judged usability is mostly equivalent to perceived usability. For example, in the study “What is beautiful is usable” (Tractinsky, Katz, & Ikar, 2000) participants were assigned to one of the three conditions- low, medium or high aesthetics. After that, all participants had to perform the same tasks, but the actual usability was manipulated for a part of them. This was done by extending the system delay and hindering the operation of some buttons. Surprisingly, the results indicate that the judged usability was influenced by the aesthetics of the website, but not by the actual usability. The importance of distinguishing usability from judged usability is also recognized by other researchers (Chawda, Craft, Cairns, Heesch, & Rüger, 2005; Lindgaard & Dudek, 2003). Our own study focuses on judged rather than objective usability.
Furthermore, the study by Tractinsky et al. (2000) demonstrates how superficial the conclusions are. A beautiful website will lead to higher judged usability, but Tractinsky et al. (2000) do not report which factors yield a beautiful website. This information is needed to improve or design a website. Beauty, also referred to as ‘aesthetic’, ‘visual appeal’, and ‘attractiveness’ (Tuch et al., 2012), is one of most critical factors with regard to first impression (Thielsch, Blotenberg, & Jaron, 2013). Tractinsky and his colleagues asked the participants to rate aesthetic without specific instructions or splitting the construct into various items. Despite the existence of instructions how to objectively measure aesthetics by means of 14 criteria (Ngo, Teo, & Byrne, 2003). Some of the criteria equal the following factors which are said to influence the judgment of web-aesthetics; the factors are economy, unity, simplicity (Altaboli & Lin, 2011), visual complexity, and prototypicality (Tuch et al., 2012).
The latter two are part of the information-processing model of aesthetic and will play a key role in our research (Leder, Belke, Oeberst, & Augustin, 2004b). Therefore they will be described in more detail.
models for company websites, online shops, and news portals. Prototypicality (PT) is of importance for web design because high PT not only results in higher judgment of aesthetics (Tuch et al., 2012), but also influences the judgment on the credibility (Schmettow & Kuurstra, 2013), perceived usability (Nazareth & Schmettow, 2014) and hedonic quality (Schmettow & Boom, 2013). ”Hedonic Quality (HQ) is a subjective measure of the users’ perceived quality, such as originality or innovativeness, seemingly having no direct relationship with the task related goals themselves.”(Schmettow & Boom, 2013,p.6).
There are different definitions of visual complexity. For this paper, it is not important to refer to one specific definition, but to give a general impression what visual complexity (VC) is about. According to Deng & Poole (2010) there are two dimensions of visual complexity. The first one is the visual diversity of website elements such as text and graphics, the second one is visual richness, or the amount of detail. Another definition is as follows: “The main factors that affect visual complexity of a Web page are the types of elements that are presented and the diversity, density, and positioning of the elements.”(Harper, Michailidou, & Stevens, 2009, p.16). When the diversity and density of the elements of a website are high, the website is rated as visually complex, otherwise, it is rated as visually simple (VS). To be more precise, a large number of images, visible links, words and sections the website is divided in causes high visual complexity (Michailidou, Harper, & Bechhofer, 2008). In contrast to PT, visual complexity does not have an effect on the judgement of credibility (Schmettow & Kuurstra, 2013), but there is an effect on hedonic quality (Schmettow & Boom, 2013) and perceived usability (Nazareth & Schmettow, 2014). In these studies high VC lead to lower judgments of aesthetic. Other studies found a negative impact as well. Firstly, the website is rated by users as less pleasurable and more arousing than low complexity. Secondly, the startpage of a website is not remembered as well as a simple one. Thirdly, the reaction time in a visual search task is longer (Tuch, Bargas-Avila, Opwis, & Wilhelm, 2009). Both constructs have influences on the judgement of aesthetics but taken together they have an even greater impact (Tuch et al., 2012). More precisly, high PT and low VC result in higher judgments on beauty (Tuch et al., 2012).
1.1.2 The user experience questionnaire
für Online-shops’ (UFOS) and IsoMetrics (Christophersen, 2006), System Usability Scale (SUS) (Bangor, Kortum, & Miller, 2008), and the Software Usability Measurement Inventory (SUMI) (Cavallin, Martin, & Heylighen, 2007). In the last years, research in HCI made a shift from focusing mainly on usability to taking the broader concept of user experience (UX) into account. Measuring usability is not sufficient to understand the big picture of a user’s interaction with a product. An attempt to measure more than usability is made by SUMI, which includes one subscale to measure emotional aspects (Laugwitz, Held, & Schrepp, 2008a). Hassenzahl (2001) suggests taking some other constructs into account to measure user experience (UX).
Laugwitz, Held, and Schrepp (2008) based their perception of UX on Hassenzahl’s theoretical framework. Thus, UX contains hedonic quality, ergonomic quality, and attractiveness of a product. Based on this definition Laugwitz and colleagues developed the user experience questionnaire (UEQ). Hedonic quality equals the dimension ‘design quality’ of UEQ, ergonomic quality is often called perceived usability in literature, and attractiveness overlaps with the construct of beauty. In contrast to earlier questionnaires, this questionnaire combines, all of the following benefits: It “allows a quick assessment done by end users covering a preferably comprehensive impression of user experience. It should allow the users to express feelings, impressions, and attitudes that arise when experiencing the product under investigation in a very simple and immediate way.” (Laugwitz et al., 2008, p.64). Furthermore, UEQ is available on the internet free of charge and therefore available to a broad public.
1.2
Cognitive processes underlying judgments
are passed through there are two outputs, aesthetic judgment and aesthetic emotion. The last one is a by-product of all stages and not of relevance for Tuch and his colleagues (2012) as well as for our own study.
Figure 1. Model of information-processing by Leder et al. (2004)
In the first stage, the perceptual analysis is made by a judgment of complexity, contrast, symmetry, order, and grouping. In the second stage, prototypicality, the peak-shift phenomenon and familiarity play a decisive role. The last one means that people prefer something which is familiar to them through repetition. That is, when people are repeatedly exposed to a stimulus they prefer this stimulus over others which they were not exposed to. This phenomena is called “mere-exposure” (Zajonc, 1968) and appears even if the stimulus is presented subliminally (Zajonc, 2001).
On the basis of existing literature (Leder, Carbon, & Ripsas, 2006), the information-processing stage model could be extended by adding timescales (Schmettow & Kuurstra, 2013). The first stage ‘perceptual analysis’ happens in less than 17ms, the second stage ‘implicit memory integration’ within 17-33ms, ‘explicit classification’ in less than one second, and ‘cognitive mastering’ in 1-10 seconds. With this in mind, it is possible to control the information processing.
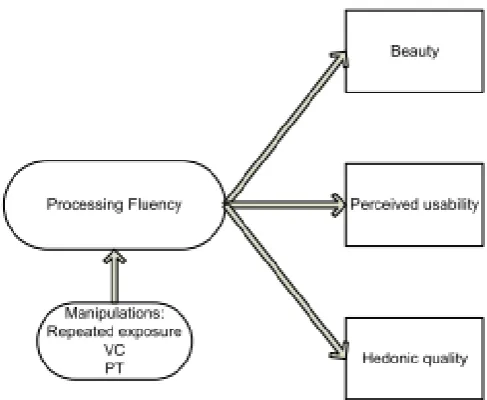
contrast to other researchers such as Hassenzahl and Monk (2010). Hassenzahl and Monk (2010) said that ‘goodness’ is a mediator variable between beauty and judged usability. “Goodness is the overall evaluation (the value) of a product in a given context.” (Hassenzahl & Monk, 2010, p.238). Schmettow and Nazareth (2014) criticized the finding among others because Hassenzahl and Monk assume that higher cognition is involved. However, Schmettow and Boom (2013) found that higher cognition is not needed in judging aesthetic. Therefore Schmettow and Nazareth suggested a new approach which is also expressed in the title of their study, namely “The fluency effect as the underlying variable for judging beauty and usability”. They designed the fluency model (figure 2) on the basis of the dual-processing theory and the fluency effect.
Figure 2. The fluency model by Schmettow and Nazareth (2014)
assumption of the fluency effect is that fluency evokes an affective response which the participants cannot distinguish from their positive affect to the object at hand which results in a higher judgment of the object (Reber, Schwarz, & Winkielman, 2004). Schmettow and Nazareth (2014) tested this model by breaking the fluency effect. This was done by asking a part of the participants to use criteria for their judgement, in other words by bringing them in a system 2 state. The researchers compared the difference in correlation between usability, beauty and hedonic quality for the two groups. The correlation should be weaker if the fluency effect is broken. This was the case, thus, fluency is a mediator variable for HQ, perceived usability and visual appeal.
1.3
The study by Tuch et al. (2012) and replications of it
Tuch et al. (2012) conducted two studies which both rely on the information-processing model by Leder et al. (2004). The focus of their research is on the unconscious processes influencing the judgement of aesthetic. Therefore the focus is on the first and second stage of the model. Prototypicality and visual complexity (see section 1.1.1) were chosen to represent the two stages. In both studies the participants had to judge the aesthetic of websites which differed in degree (low, medium, high) of visual complexity and prototypicality. The studies looked alike but in the second study the presentation time of the stimuli was adjusted and the medium VC condition was removed. The stimuli were screenshots of unfamiliar company websites because people have a mental model how such a website should look like for this type of website (Roth et al., 2010). This is also true for news portals and online shops, but the amount of available websites is larger for company websites. The websites were selected in a subjective way according to criteria such as language. The number of company websites for the experiment by Tuch et al. (2012) was reduced to 120 after some pre-tests were done. The pre-tests included the rating of the websites on prototypicality and visual complexity. The respondents had to judge the statements “‘I think this website is of high visual complexity” and “This website looks like a typical company website” (Tuch et al., 2012, p. 800). Because the medium VC condition was removed for the second study, there remained 80 websites.
test the hypotheses: the test persons were assigned to one of the three conditions: 50ms, 500ms, or 1000ms presentation time (respectively 17ms, 33ms, and 50ms in the second study). After the presentation of the website a mask was shown for 50ms. The participants then had to rate the aesthetic of all websites on a visual analogue scale. The anchors of that scale were ‘ugly’ and ‘beautiful’. The scale was analysed by converging the scores to a scale with a range of nine. Thereafter, an ANOVA was done. The results corroborate that PT and VC are influencing aesthetic judgements and therefore the first impression of a website. The mentioned hypothesis was also found to be true in the second study. More precisely, low complexity and high prototypicality result in a high rating of aesthetics.
This experiment was the basis for the studies done by Schmettow and Kuurstra (2013) and Schmettow and Boom (2013). They reproduced the experiment with some changes. Firstly, the presentation time was 17ms, 33ms, 500ms, and 5000ms and every participant had to give ratings at each presentation times. Secondly, the medium conditions of PT and VC were removed resulting in just 76 websites. Thirdly, the participants did not have to judge the aesthetics of the website, but rather some items regarding credibility (Schmettow & Kuurstra, 2013) and hedonic quality (Schmettow & Boom, 2013). Furthermore, in these studies, the focus was on the explained variance shared between final judgment and the ms-conditions. The study about HQ found, that the effect of VC on the explained variance of final judgment was strongest at 17ms (Schmettow & Boom, 2013). However the effect of PT on the final judgment (after 5000ms) on HQ was constant in all presentation time conditions, which does not fit into the model. The results of the study about credibility do not fit well either. Schmettow and Kuurstra (2013) found a strong effect of PT on the final judgment, but no significant effect of VC. A proposed explanation is that the judgment of credibility differs from the judgment of aesthetic.
This demonstrates that further research such as our own study is needed to learn more about the early information processing stages and the role of PT and VC. We will replicate the experiment by Schmettow and Boom (2013) and Schmettow and Kuurstra (2013) but with regard to the user experience questionnaire. Our first research question is:
R1: To what extend is the judgment on UEQ influenced by the early
The user experience questionnaire overlaps with the scales measured in the fluency model study by Schmettow and Nazareth (2014). Hedonic quality is similar to the category ‘design quality’, perceived usability resembles ‘use quality’, and attractiveness overlaps with beauty but measures a more general impression as well. UEQ differs from the previous research about the fluency model because more scales and items were used allowing a more thorough impression of user experience. Furthermore, in the fluency model study no time conditions were used.
R2: To what extend is the judgment on UEQ in line with the fluency model?
If the judgment on UEQ is in line with the fluency model, it would stress the fact that fluency should play an important role in web-design, especially with regard to the first impression of a website (see Schmettow and Nazareth (2014) for possible design applications).
1.4
Hypotheses
In answering both of the research questions, it is important to distinguish between the different scales of UEQ because the analysis of UEQ is done with regard to the scales. This is also of relevance if someone chooses particular scales of UEQ, for instance the scales belonging to the dimension design quality
Design quality
We expect the judgments on the novelty scale to be strongly influenced by prototypicality. The items belonging to this scale are ‘usual-leading edge’ and ‘inventive-conventional’. It seems logical that users have a prototype in mind of a usual website because they otherwise would not know what usual means.
The judgments on the scale stimulation are expected to be mainly influenced by visual complexity. Visually complex websites evoke a higher heart rate and more arousal (Tuch et al., 2009). The heart rate was measured with an EMG device, but arousal was measured by the SAM scale, a tool for the participant to report his state of arousal. In our own study, the participants give their opinion on a scale, too. For that reason, we expect similar results.
Use quality
We expect the judgments on the scale efficiency to be mainly influenced by visual complexity. Efficiency is represented in UEQ by items such as ‘efficient-inefficient’ and ‘organized- cluttered’. The second pair of items can be tested by a visual search task. In the study by Tuch et al. (2009), the participants had to complete such a search task, but not for the purpose of testing efficiency. The instruction was to search for an asterisk on the startpage of a website. The search time was longer when the visual complexity of the website was high.
Judgments on dependability will probably be highly influenced by prototypicality. This scale is represented by items such as ‘predictable- unpredictable’ and ‘meets expectations- does not meet expectations’. Prototypicality is exactly about predictions and expectation.
The judgments on the scale perspicuity will probably correlate with VC. If one looks at the pair of items “complicated-easy” and “clear-confusing”, the connection becomes more obvious. These items fit well with the definition of VC.
Attractiveness
both variables influencing aesthetic. For that reason we expect both of them to influence this scale.
To sum it up, the following hypotheses will be tested:
H1: High PT will lead to higher judgments on novelty and dependability than low VC and low PT at the 50ms, 500ms, and unlimited condition
H2: Low VC (=high VS) will lead to higher judgments on stimulation, efficiency and perspicuity than high PT and high VC at the 50ms, 500ms, and unlimited condition
H3: High PT and low VC will both lead to equally high judgments on attractiveness at the 50ms, 500ms, and unlimited condition
As mentioned, PT and VC taken together can have an even stronger effect (Schmettow & Boom, 2013; Tuch et al., 2012). Therefore, it will be tested if:
H4: There is an interaction effect of PT and VC on the judgment of the scales of UEQ with regard to the time conditions
We are not only interested in the influence of PT and VC on the judgment of UEQ but also if the information processing model is applicable for the judgment on UEQ. The studies by Schmettow and Boom (2013) and Schmettow and Kuurstra (2013) both found that the judgments get closer to the final judgment (5000ms) when the presentation time rises. We also want to test this.
H5: When the presentation time rises (starting with 17ms) the judgments get closer to the final judgement
2
Method
2.1
Participants
Forty persons (70% women) participated in the experiment, 23 of them German and 17 Dutch. The youngest of them was 19 years old, the oldest 57 years (M= 26years; SD=8,82). Most of the participants were psychology students (62.5%) who could receive 0.75 credits (=45minutes) of the test person system of the university. The other participants were majoring in different studies or have a job. The participants were using the internet at average of 11,31 years (SD=3,14) and for at least seven years. Four participants received education in web-design for example, as part of the study industrial design.
2.2
Design
There are three independent variables: prototypicality (high/low), visual complexity (high/low), and duration of presentation, which vary within one subject. Little changes were made in comparison to the studies done by Schmettow and Kuurstra (2013) and Schmettow and Boom (2013). The 33ms condition was replaced by 50ms and the 5000ms condition was replaced by a unlimited- time condition. In the unlimited condition the scale and website were presented simultaneously. That results in four different presentation times, namely 17ms, 50ms, 500ms, and unlimited time.
2.3
Material
2.3.1 Items
The experiment was a combination of two bachelor theses. Therefore two different kinds of items were used. The other thesis written by Lisa Tieman investigated the influence of the early information processing on the judgment of statements regarding the technology acceptance model (TAM). This thesis deals with the bipolar items of the user experience questionnaire.
transformed into a questionnaire with a seven stage scale to choose between bipolar adjectives. There were two versions of the questionnaire differing in the order and polarity of the items. The questionnaires were then given to students and SAP experts and completed by 153 participants total. Finally, the questionnaire was divided into two subsets, the first one containing all items related to perceived attractiveness and the second one containing the remaining items, to execute a factor analysis. The factor of the first subset explaining 60% of the observed variance is called attractiveness and is represented by six items in the final questionnaire. From the second subset, five factors called stimulation, novelty, efficiency, perspicuity, and dependability emerged. The four items with the highest loading of each scale explaining 70% of the variance in the data were used for the final version of the questionnaire.
To sum it up, UEQ consists of 26 items belonging to six dimensions which can be divided in three dimensions. The dimensions are attractiveness, design quality (stimulation, novelty), and use quality (efficiency, perspicuity, dependability). The questionnaire was originally written in German but Laugwitz et al. (2008) made an English version (appendix B), too. UEQ is also currently available in seven more languages, but the quality is not assured for all of them.
Due to limited time in the experiment, just 16 pairs of items of the UEQ were chosen for the experiment (appendix A).The items were chosen on the basis of the loading they had on the mentioned factor-analysis executed to determine the dimensions of UEQ. All items of the dimension ‘attractiveness’ were chosen because the loading was not reported by Laugwitz et al. (2008). All other categories are represented by the two pairs of items which have the highest loading.
procedure, the Dutch version of the questionnaire was given to a Dutchman, who speaks German fluently, for a final check.
2.3.2 Stimuli
The screenshots of the websites were almost the same as in the study of Schmettow, Kuurstra, and Boom (2013). They had chosen 76 screenshots of the original 120 screenshots selected by Tuch et al. (2012). Tuch et al. (2012) selected the websites by some criteria such as language but in a subjective manner. Afterwards they validated and reduced the selection by doing a pre-test. In our experiment 66 screenshots of websites were used.
2.3.3 Computer
The experiment took place in a small room at the university because of the required computer hardware. The room was equipped with a LG E2210 monitor. This kind of monitor was necessary to present stimuli for a very short (i.e. 17 ms). The resolution was set to 1680x1050 pixels. The experiment was programmed with psychopy version 1.79.1, a program available on the internet free of charge.
2.3.4 Procedure
[image:19.595.72.529.537.654.2]Before the experiment starts, the test persons are asked to give information about their gender, age, course of study, duration of internet usage, and education in web design. Then they received some general instruction about the experiment such as to judge the websites intuitively. When there had been no more questions, the experiment started. Depending on their native language, the test persons are presented with Dutch or German instructions and items.
Figure 3. procedure of the experiment
At first, there are some exercise trials to allow the participants to become familiar with the use of the sliding scale. After that the real trials start. There are four blocks with short breaks in between. The blocks differ in presentation time, starting with 17ms and ending
exercise trials 17 50 ms ms
500 ms judgments
Instruction1 Instruction2
2
with the no-time-limit condition. In each block the participants had to judge the screenshots of the 66 websites. A single trial consists of showing a random screenshot of a website, then a mask and after that the presentation of a random statement or a pair of bi-polar items which has to be judged on a sliding scale. Only in the final judgment, when there is no time limit, is the scale presented simultaneously with the website. The experiment lasts about 30 minutes.
2.4
Data analysis
The analysis of the data was done with IBM SPSS Statistics 21. Before starting with the analysis, the variable VC was reversed to visual simplicity (VS) which is the same as low VC. This was done to simplify the analysis and interpretation because we expected VC to correlate negatively with the scales. Furthermore the variables VS, PT, response and response unlimited were z-standardized. In general, researchers are used to sorting their data in SPSS by participant. In our study the data were sorted by observation. That means from each observation, the value of PT and VS, the number of participant, the condition (17ms, 50ms, or 500ms), the item, the stimulus, the response (judgment of item at 17ms, 50ms, or 500ms), and the response of the unlimited condition were registered. The analysis consisted of two parts. The first part was about the influence of PT and VS on the judgments. A linear mixed model was used to test if PT and VS correlate with the condition and scales (see appendix D for SPSS syntax). We had a look at the interaction with the items as well.
The second part analyses the assumptions concerning the information processing model. A linear mixed model was used, as well (see appendix D). It tested what the effect of the final judgment is on the responses while differentiating between conditions and scales. The advantages of this type of analysis are that observations do not have to be independent and the model can deal with repeated measurements (Field, 2009).
3
Results
Table 1
Interaction between presentation time and VS and PT
Parameter Estimate Sig. 95% Confidence Interval
Lower Bound Upper Bound
[17ms] * zVS .017 .39 -.02 .06
[50ms] * zVS -.009 .63 -.05 .03
[500ms] * zVS -.014 .48 -.05 .02
[unlima] * zVS -.018 .37 -.06 .02
[17ms] * zPT .024 .22 -.01 .06
[50ms] * zPT -.027 .17 -.07 .01
[500ms] * zPT -.038 .06 -.08 .00
[unlima] * zPT -.051 .01 -.09 -.01
a. Unlim= unlimited time condition
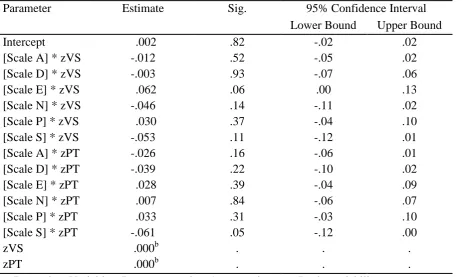
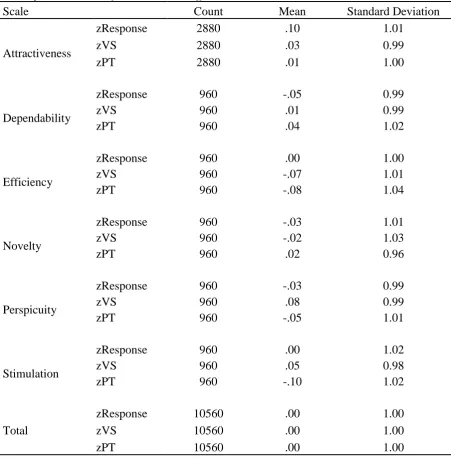
[image:21.595.71.534.445.722.2]Table 2 shows that no influence of PT and VS on the judgments was found with regard to the scales. Table 3 shows the means and standard deviations belonging to table 2. The means of zResponse relating to the scales indicate that attractiveness (M= 0.10) was scored highest, followed by efficiency (M=-0.00) and stimulation (M=0.00). Perspicuity and novelty are also scored even high (M=-0.03), and dependability received the lowest scores (M=-0.05).
Table 2
Estimates of Fixed Effects of Scale x zPT and Scale x zVS a
Parameter Estimate Sig. 95% Confidence Interval
Lower Bound Upper Bound
Intercept .002 .82 -.02 .02
[Scale A] * zVS -.012 .52 -.05 .02
[Scale D] * zVS -.003 .93 -.07 .06
[Scale E] * zVS .062 .06 .00 .13
[Scale N] * zVS -.046 .14 -.11 .02
[Scale P] * zVS .030 .37 -.04 .10
[Scale S] * zVS -.053 .11 -.12 .01
[Scale A] * zPT -.026 .16 -.06 .01
[Scale D] * zPT -.039 .22 -.10 .02
[Scale E] * zPT .028 .39 -.04 .09
[Scale N] * zPT .007 .84 -.06 .07
[Scale P] * zPT .033 .31 -.03 .10
[Scale S] * zPT -.061 .05 -.12 .00
zVS .000b . . .
zPT .000b . . .
a. Dependent Variable: zResponse; scales: A= attractiveness, D=dependability, E=efficiency, N= novelty, P= perspicuity, S= stimulation
Table 3
Descriptive Statistics of the interaction effect between Scale x PT and Scale x VS
Scale Count Mean Standard Deviation
Attractiveness
zResponse 2880 .10 1.01
zVS 2880 .03 0.99
zPT 2880 .01 1.00
Dependability
zResponse 960 -.05 0.99
zVS 960 .01 0.99
zPT 960 .04 1.02
Efficiency
zResponse 960 .00 1.00
zVS 960 -.07 1.01
zPT 960 -.08 1.04
Novelty
zResponse 960 -.03 1.01
zVS 960 -.02 1.03
zPT 960 .02 0.96
Perspicuity
zResponse 960 -.03 0.99
zVS 960 .08 0.99
zPT 960 -.05 1.01
Stimulation
zResponse 960 .00 1.02
zVS 960 .05 0.98
zPT 960 -.10 1.02
Total
zResponse 10560 .00 1.00
zVS 10560 .00 1.00
zPT 10560 .00 1.00
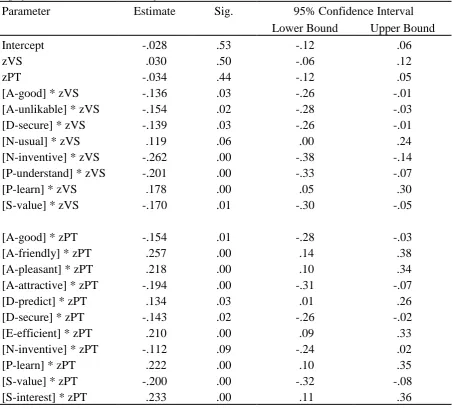
Table 4
Significant interaction (α=.10) of PT and VS with itemsa
Parameter Estimate Sig. 95% Confidence Interval
Lower Bound Upper Bound
Intercept -.028 .53 -.12 .06
zVS .030 .50 -.06 .12
zPT -.034 .44 -.12 .05
[A-good] * zVS -.136 .03 -.26 -.01
[A-unlikable] * zVS -.154 .02 -.28 -.03
[D-secure] * zVS -.139 .03 -.26 -.01
[N-usual] * zVS .119 .06 .00 .24
[N-inventive] * zVS -.262 .00 -.38 -.14
[P-understand] * zVS -.201 .00 -.33 -.07
[P-learn] * zVS .178 .00 .05 .30
[S-value] * zVS -.170 .01 -.30 -.05
[A-good] * zPT -.154 .01 -.28 -.03
[A-friendly] * zPT .257 .00 .14 .38
[A-pleasant] * zPT .218 .00 .10 .34
[A-attractive] * zPT -.194 .00 -.31 -.07
[D-predict] * zPT .134 .03 .01 .26
[D-secure] * zPT -.143 .02 -.26 -.02
[E-efficient] * zPT .210 .00 .09 .33
[N-inventive] * zPT -.112 .09 -.24 .02
[P-learn] * zPT .222 .00 .10 .35
[S-value] * zPT -.200 .00 -.32 -.08
[S-interest] * zPT .233 .00 .11 .36
a. Dependent Variable: zResponse; A= attractiveness, D=dependability, E=efficiency, N= novelty, P= perspicuity, S= stimulation; abbreviations of items do not indicate polarity
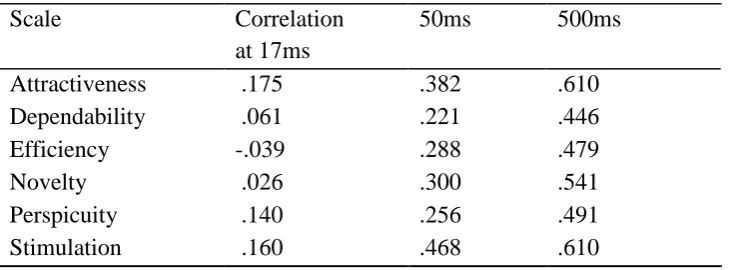
Table 5
Correlations of the final judgment with the responses
Scale Correlation
at 17ms
50ms 500ms
Attractiveness .175 .382 .610
Dependability .061 .221 .446
Efficiency -.039 .288 .479
Novelty .026 .300 .541
Perspicuity .140 .256 .491
Stimulation .160 .468 .610
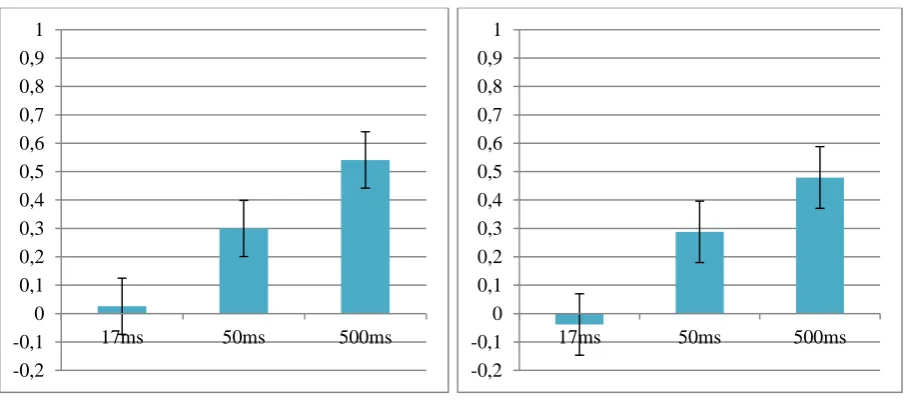
Figure 4a. Attractiveness Figure 4b. Dependability
Figure 4c. Perspicuity Figure 4d. Stimulation
Figure 4e.Novelty Figure 4f. Efficiency
-0,2 -0,1 0 0,1 0,2 0,3 0,4 0,5 0,6 0,7 0,8 0,9 1
17ms 50ms 500ms
-0,2 -0,1 0 0,1 0,2 0,3 0,4 0,5 0,6 0,7 0,8 0,9 1
17ms 50ms 500ms
-0,2 -0,1 0 0,1 0,2 0,3 0,4 0,5 0,6 0,7 0,8 0,9 1
17ms 50ms 500ms
-0,2 -0,1 0 0,1 0,2 0,3 0,4 0,5 0,6 0,7 0,8 0,9 1
17ms 50ms 500ms
-0,2 -0,1 0 0,1 0,2 0,3 0,4 0,5 0,6 0,7 0,8 0,9 1
17ms 50ms 500ms
-0,2 -0,1 0 0,1 0,2 0,3 0,4 0,5 0,6 0,7 0,8 0,9 1
[image:25.595.72.525.304.497.2] [image:25.595.71.526.540.744.2]4
Discussion
One question we try to answer with this study is to what extent UEQ is in line with the fluency model. To answer the question we made five assumptions about the influence of PT and VC on the judgment of UEQ. As the results reveal there is no evidence of an influence on the scales. There is only an influence at some of the items but the correlation is inconsistent within the scales. Therefore, no support for the assumptions was found. The assumption about the increase of correlation relating to presentation time is the only one which could be proven to be true. All in all, the results do not agree with our expectations as formulated in the assumptions. In the following, the findings will be discussed in context to the information-processing model (figure 1) and to the fluency model (figure 2) and by this the research questions will be answered. Thereafter the results will be compared to similar studies. Then prototypicality and visual complexity are discussed in more detail. The limitations will be described and suggestions for future research will be presented at the end.
4.1
UEQ and the cognitive models
millisecond conditions and admitted that the colours influenced their judgment. Maybe looking longer at the website, the effect of colour on the judgment even increases. Current literature states that chromatic colours and blues result in higher judgments of web-aesthetic (Hall & Hanna, 2004) but also that there is no difference in the judgment of aesthetic if the website is coloured or in greyscale (Schmettow & Overkamp, 2013).
The other research question was about the fluency model (figure 2). The assumption was that if PT is high and VC is low, the judgment on UEQ is influenced by fluency. This was not the case. However the information-processing finished quickly which implies the use of system 1 even at the conscious time conditions. System 1 assumes that prototypes are used to process information. Because this was not the case for the judgment of the scales, other variables had to be used. A variable, which might have influenced the judgment, is mere exposure but this variable was not tested for in our experiment. To sum it up, there are no indications that the judgment on UEQ is in line with the fluency model. Further research is needed to find out if fluency actually plays no a role at all in judging UEQ.
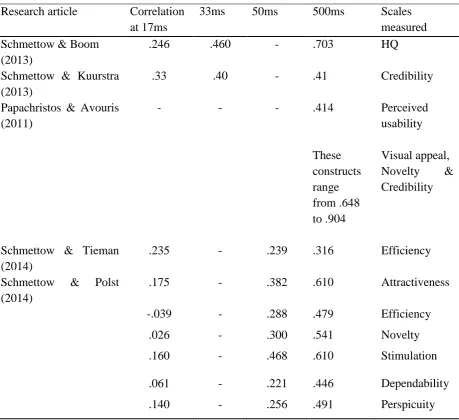
4.2
UEQ in comparison to similar studies
Table 6 shows the result of other studies, that also correlated the judgments at short presentation times with the one of an unlimited time condition. Our own results were added, as well. The procedure in the study by Papachristos and Avouris (2011) was similar to the one in our experiment, but the analysis was done by looking at the correlation between the mean ratings of the websites. That means instead of sorting the judgments by observation, as in our study, they sorted the judgments by website. Furthermore, for a part of the results they do not mention which explained variance belongs to which scale. The experiment in study by Schmettow and Tieman (2014) was exactly the same as in our study because it was conducted together as described in the section method.
are bigger differences in explained variances between the time conditions than in the other studies except for the judgement on HQ.
Table 6
Overview of studies correlating responses of different presentation times with the one
without time limit
Research article Correlation
at 17ms
33ms 50ms 500ms Scales
measured Schmettow & Boom
(2013)
.246 .460 - .703 HQ
Schmettow & Kuurstra (2013)
.33 .40 - .41 Credibility
Papachristos & Avouris (2011)
- - - .414 Perceived
usability These constructs range from .648 to .904 Visual appeal,
Novelty &
Credibility
Schmettow & Tieman (2014)
.235 - .239 .316 Efficiency
Schmettow & Polst
(2014)
.175 - .382 .610 Attractiveness
-.039 - .288 .479 Efficiency
.026 - .300 .541 Novelty
.160 - .468 .610 Stimulation
.061 - .221 .446 Dependability
.140 - .256 .491 Perspicuity
investigated the explained variance of visual appeal. The scale attractiveness overlaps partly with visual appeal. In our study the correlation coefficient of attractiveness is .610, thus lower than in the study by Papachristos and Avouris (2011). Efficiency was measured by Schmettow and Tieman (2014) by judging the statement “This website seems efficient; Completely disagree/agree”. In our experiment, efficiency was measured by judging bipolar items. Contrary to expectations the correlation coefficients of both studies differed significantly. In our experiment, there was no correlation at 17ms whereas in the other study a coefficient of .235 was found. At 50ms the correlation in our study is .288 which is slightly higher than when judging the statement, and at 500ms the correlation is even .479, which is notably higher than in the other study. As a reminder, the experiment and the test persons were exactly the same. For that reason it is surprising that the explained variances of the judgments were so different. One explanation could be that people in general perform badly at judging efficiency without actively using the website. In an experiment by Ilmberger and colleagues (2008), the judgments on the usability dimension of UEQ did not differ between two groups after watching a demonstration of a website, although, for one group the website had low usability and for the other group the website had high usability. This does not mean that no one is able to judge efficiency at such a short time. Maybe experts are able to do so. They can namely use system 1 for judgments where other people need system 2 for (Kahneman et al., 2002). To sum it up, some of the scales such as the one belonging to use quality are in line with previous research but other scales such as efficiency are contradicting to other research. There is an indication that the way of measuring the judgments could cause the contradicting findings.
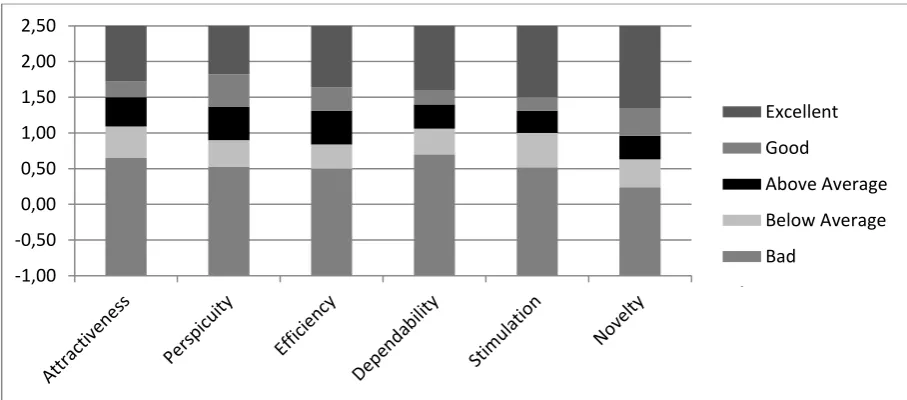
Figure 5. benchmark for the judgment on UEQ provided by SAP
Designers that will do the effort to evaluate their product by using UEQ are expected to are experienced in web-design and therefore their products are of a relative good quality. In our study, there were some websites chosen that are not of high quality. Furthermore we did not distinguish between the websites. It could be that there are some judgments of websties which are perfectly in line with figure 5.
4.3
Prototypicality and visual complexity
In this study, no interaction of prototypicality and visual complexity with the judgments of the scales was found. There was no interaction with the different presentation times as well. Some items correlated with PT and VS, but the correlation was sometimes negative and contrasting to other items of the scale. Thus, in contrast to the study by Tuch et al. (2012) and Schmettow and Boom (2013), prototypicality and visual complexity were not good representatives of the first and second stage of the model by Leder et al. (2004). A possible explanation for that could be that the argumentation of the assumptions is wrong. We based the assumptions on the items of UEQ and the study by Tuch et al. (2009). When comparing the study by Tuch et al. (2009) with our own there are just minor differences between the stimuli such as the usage of news and science related websites. The selection criteria of the stimuli were almost the same. Major differences are apparent in the procedure. In the study by Tuch et al. (2009) the participants had to do a visual search task. Maybe this aspect makes the conclusions we drew for two of the scales too abstract and therefore wrong. The most of the assumptions, we made, are based on the items. Two of them used in our experiment are identical and some others have almost the same meaning as items used in the studies by
-1,00 -0,50 0,00 0,50 1,00 1,50 2,00 2,50
Excellent
Good
Above Average
Below Average
Schmettow and Nazareth (2014) and by Schmettow and Boom (2013). In these studies an effect of PT and VC was found. Five out of the ten non-used items (appendix B) are identical with the one by Schmettow and Nazareth (2014) or Schmettow and Boom (2013). For example, the non-used items of perspicuity (‘complicated-easy’; ‘clear-confusing’) are exactly the same as in the study by Schmettow and Nazareth (2014). Even if not all equal or similar items were used in our experiment, the overlapping presumes similarities between the measured scales. For that reason, similar results could have been expected in both studies, but according to the results, this is not the case. An explanation could be that the used items are not sufficient enough to represent a scale. On the other hand, in this study, the items with the highest loading in the factor analysis executed by Laugwitz and colleagues (2008) were used assuming that these are the best representatives of a scale. To sum it up, it is unlikely that our assumptions are totally wrong. Consequently there has to be some other reason why the expected effect of PT and VC was not found. We expected that the findings would resemble the one by Schmettow and Boom (2013) and Schmettow and Kuurstra (2013) as well. They indicated that PT influences the judgment on credibility and hedonic quality and VS influences the judgment on hedonic quality. Comparing the method of these studies with our own study, the computers, location, stimuli, procedure and so on were the same. Exceptions are only the items which were about hedonic quality and credibility and the presentation times which was 5000ms instead of unlimited. When comparing the participants, some differences are apparent with regard to age and education in web-design but these differences relate to just a few participants and can therefore not account for the results. All in all, no good cause can be found that can explain why PT and VC had no influence. Maybe the unknown cause can also explain why VS did not influence the final judgment in the study by Schmettow and Kuurstra (2013).
4.4
Limitations
their judgment. When the presentation time was a bit longer, pictures could be recognized, according to participants. All in all, most participants reported that the experiment was not very interesting, but that it did not take much effort. They indicated that half an hour is tolerable, but if the experiment lasted longer, it would be boring and they would get fatigued.
There are some limitations regarding the experiment. Firstly, the stimuli themselves were judged subjectively on prototypicality and visual complexity. That means no criteria such as the number of images and sections (Michailidou et al., 2008) were used. The stimuli were originally selected by Tuch and his colleagues (2012) in a subjective manner. They were validated afterwards as described in section 1.3. Each website was rated by at least 14 participants. You can debate whether if 14 people are enough to even out individual differences. According to the interactionist perspective of beauty, a judgment not only depends on the object but also on the characteristics of the perceiver (Moshagen & Thielsch, 2010). We stated in the introduction that there are underlying components of aesthetic but that does not mean that every person rates a website in the same way. Maybe judging aesthetic (like: this website looks beautiful) differs from judging the components of aesthetic (like: the website looks prototypical). A study comparing the objective (based on Ngo et al., 2003) and subjective (based on VisA WI) measurement of components of aesthetic found a significant correlation between the two ways of measurement (Altaboli & Lin, 2011). That means the tested components such as simplicity can be tested by objective or subjective measurements. Two implications have to be mentioned: prototypicality was not investigated in the study and the study was done in the context of aesthetics and may therefore not be used to generalise other concepts. To sum it up, it is difficult to estimate if the subjective selection is a limitation on the experiment.
watching how to use it versus having just a short look at it. Actually, Ilmberger and collegues (2008) found that the judgments on UEQ were different after actively using a website and watching how to use it. Therefore the difference between active use and screenshot is expected to be even bigger.
Thirdly, only the effect of PT and VC was researched. No examination or control for other variables which might have an effect on the judgment took place. As the fluency model states, mere exposure has an effect on HQ, perceived usability and beauty, too. Moreover other variables of the first and second stage of the information-processing model by Leder et al. (2004) were not taken into account even as other aspects like colour.
Fourthly, the findings are limited by the circumstances of the experiment. Thus, when someone wants to generalize the findings, it has to be taken into consideration that the experiment took place under controlled conditions. The everyday use of the websites will probably differ because the user will not use exclusively company websites, and the age of the users is more various. The expertise in web-use and -design can lead to different use behaviour (Chevalier & Kicka, 2006) and therefore maybe to different findings. Experts are maybe better at making reliable judgments at short presentation times because experts can use system1 instead of the slow information-processing as in system 2 (Kahneman et al., 2002). That means they are able to make reliable judgments when novices are not able to.
4.5
Future research
underlying variables could be extracted which explain the difference in judgments between the information-processing stages. Eye-tracking cannot only be used for broadening the range of knowledge about information-processing, but also to diminish a weakness of UEQ in future research. As discussed, the reliability of efficiency is controversial. To cancel this out, the path of eye-movement can be measured to give information about distracting features of a website, the place where people expect a certain button and about other things. A clear path to the searched feature would reflect high efficiency.
As discussed in section 4.4, there was no control for other variables in our research. Further research is needed to predict and cancel out the influence of variables such as colour or mood. The participants’ mood influences the judgment of perspicuity, efficiency, and dependability significantly (Ilmberger et al., 2008). For that reason, the mood should be measured when replicating the experiment. This is necessary to be sure about the influences of PT and VC. Furthermore, research is required to test why PT and VC had no influence on the judgments; for example, by diminishing the influence of the limitations or by comparing the judgments on the website which were used by Schmettow and Nazareth (2014) and also in our own study. Maybe by doing so a variable emerges which accounts for the different results. This could extend the knowledge about the information-processing model and the fluency model. Future research could not only investigate the reason why no influence was found but also modify variables such as the type of website. Mental models namely exist for online shops and news websites, too (Roth et al., 2010).
As discussed in section 4.2, the way of presenting an item seems to influence the judgment dramatically. Many studies use just one statement or pair of bipolar items to represent a construct. Some studies present all items at the same time and others just one item after each website. These are all variables which could account for differences in judgment. For that reason, future research is needed to gain knowledge about the influence of the way of presentation on the judgment of the items.
5
Conclusion
and low VC should result in a fluent processing of a website according to the fluency model. Therefore, there is no evidence that the judgment on UEQ is influenced by fluency. The findings fit partly with the information-processing model by Leder et al. (2004). Prototypicality and visual complexity are not playing a role in the early information-processing stages when judging UEQ. However, our study shared with the model and other replications that the judgments at the ms-conditions correlate with the final judgment and that the correlation increases when presentation time rises. Comparing our studies with similar studies revealed that the degree of correlation varies between the studies for at least some scales. An explanation could be that judging items result in different judgments than judging a statement.
6
References
Altaboli, A., & Lin, Y. (2011). Objective and subjective measures of visual aesthetics of website interface design: the two sides of the coin. Human-Computer Interaction. Design and Development Approaches, 35–44. Retrieved from
http://link.springer.com/chapter/10.1007/978-3-642-21602-2_4
Aranyi, G., van Schaik, P., & Barker, P. (2012). Using think-aloud and psychometrics to explore users’ experience with a news Web site. Interacting with Computers, 24(2), 69– 77. doi:10.1016/j.intcom.2012.01.001
Bangor, A., Kortum, P. T., & Miller, J. T. (2008). An Empirical Evaluation of the System Usability Scale. International Journal of Human-Computer Interaction, 24(6), 574–594. doi:10.1080/10447310802205776
Cavallin, H., Martin, W. M., & Heylighen, A. (2007). How relative absolute can be: SUMI and the impact of the nature of the task in measuring perceived software usability. Ai & Society, 22(2), 227–235. doi:10.1007/s00146-007-0127-0
Chawda, B., Craft, B., Cairns, P., Heesch, D., & Rüger, S. (2005). Do “attractive things work better”? An exploration of search tool visualisations. Retrieved from
http://oro.open.ac.uk/29873/
Chevalier, A., & Kicka, M. (2006). Web designers and web users: Influence of the ergonomic quality of the web site on the information search. International Journal of Human-Computer Studies, 64(10), 1031–1048. doi:10.1016/j.ijhcs.2006.06.002
Christophersen, T. (2006). Usability im Online-Shopping : Entwicklung eines
Fragebogeninstrumentes ( ufosV2 ) unter Berücksichtigung formativer und reflektiver Messmodelle Mit einem Geleitwort von Prof . Dr . Udo Konradt Betriebswirtschaftliche Aspekte lose gekoppelter Systeme und. Christian-Albrechts-Universität zu Kiel.
Darwish, A., & Bataineh, E. (2013). Eye tracking analysis of browser security indicators. 1–6. Retrieved from http://ieeexplore.ieee.org/xpls/abs_all.jsp?arnumber=6454330
Deng, L., & Poole, M. (2010). Affect in Web Interfaces: A Study of the Impacts of Web Page Visual Complexity and Order. Mis Quarterly, 34(4), 711–730. Retrieved from
http://search.ebscohost.com/login.aspx?direct=true&profile=ehost&scope=site&authty pe=crawler&jrnl=02767783&AN=54990220&h=sW31pa8d+VDW3QUu0+b4LhG+5wjNeT ykc4CjIvgjEaH2+M2QGR43joVtl6NSkCDKTsDJ0D0e7TH2TZvtnRI6Zg==&crl=c
Harper, S., Michailidou, E., & Stevens, R. (2009). Toward a definition of visual complexity as an implicit measure of cognitive load. ACM Transactions on Applied Perception, 6(2), 1– 18. doi:10.1145/1498700.1498704
Hassenzahl, M. (2001). The effect of perceived hedonic quality on product appealingness.
International Journal of Human-Computer …, (May 2014), 37–41. doi:10.1207/S15327590IJHC1304
Hassenzahl, M., & Monk, A. (2010). The inference of perceived usability from beauty.
Human–Computer Interaction, 25(3), 235–260. doi:10.1080/073700242010500139 Hornbæk, K. (2006). Current practice in measuring usability: Challenges to usability studies
and research. International Journal of Human-Computer Studies, 64(2), 79–102. doi:10.1016/j.ijhcs.2005.06.002
Ilmberger, W., Schrepp, M., & Held, T. (2008). Cognitive Processes Causing the Relationship between Aesthetics and Usability (pp. 43–54). Retrieved from
http://dx.doi.org/10.1007/978-3-540-89350-9_4
Kahneman, D., Frederick, S., Gilovich, T., Griffin, D., Hertwig, R., Hilton, D., … Ullman-margalit, E. (2002). Heuristics of Intuitive Judgment: Extensions and Applications.
Cambridge University Press, 1–30.
Laugwitz, B., Held, T., & Schrepp, M. (2008a). Construction and evaluation of a user
experience questionnaire. HCI and Usability for Education and Work, 63–76. Retrieved from http://link.springer.com/chapter/10.1007/978-3-540-89350-9_6
Laugwitz, B., Held, T., & Schrepp, M. (2008b). Construction and Evaluation of a User Experience Questionnaire, 63–76.
Leder, H., Belke, B., Oeberst, A., & Augustin, D. (2004). A model of aesthetic appreciation and aesthetic judgments. British Journal of Psychology (London, England : 1953), 95(Pt 4), 489–508. doi:10.1348/0007126042369811
Leder, H., Carbon, C.-C., & Ripsas, A.-L. (2006). Entitling art: Influence of title information on understanding and appreciation of paintings. Acta Psychologica, 121(2), 176–98. doi:10.1016/j.actpsy.2005.08.005
Lindgaard, G., & Dudek, C. (2003). What is this evasive beast we call user satisfaction?
Interacting with Computers, 15(3), 429–452. doi:10.1016/S0953-5438(02)00063-2 Lindgaard, G., Fernandes, G., Dudek, C., & Brown, J. (2006). Attention web designers: You
have 50 milliseconds to make a good first impression! Behaviour & Information Technology, 25(2), 115–126. doi:10.1080/01449290500330448
Michailidou, E., Harper, S., & Bechhofer, S. (2008). Visual complexity and aesthetic
Moshagen, M., & Thielsch, M. T. (2010). Facets of visual aesthetics. International Journal of Human-Computer Studies, 68(10), 689–709. doi:10.1016/j.ijhcs.2010.05.006
Nazareth, D., & Schmettow, M. (2014). The fluency effect as the underlying variable for judging beauty and usability. University of Twente.
Ngo, D. C. L., Teo, L. S., & Byrne, J. G. (2003). Modelling interface aesthetics. Information Sciences, 152, 25–46. doi:10.1016/S0020-0255(02)00404-8
Oppenheimer, D. M. (2008). The secret life of fluency. Trends in Cognitive Sciences, 12(6), 237–41. doi:10.1016/j.tics.2008.02.014
Papachristos, E., & Avouris, N. (2011). Are First Impressions about Websites Only Related to Visual Appeal ? In P. Campos, N. Graham, J. Jorge, N. Nunes, P. Palanque, & M. Winckler (Eds.), Human-Computer Interaction – INTERACT 2011 (pp. 489–496). Lisbon, Portugal: Springer.
Poole, A., & Ball, L. J. (2006). Eye Tracking in Human-Computer Interaction and Usability Research : Current Status and Future Prospects. Ghaoui, C. Encyclopedia of human computer interaction (p.211-219). London: idea group reference
Reber, R., Schwarz, N., & Winkielman, P. (2004). Processing fluency and aesthetic pleasure: is beauty in the perceiver’s processing experience? Personality and Social Psychology Review : An Official Journal of the Society for Personality and Social Psychology, Inc,
8(4), 364–82. doi:10.1207/s15327957pspr0804_3
Roth, S. P., Schmutz, P., Pauwels, S. L., Bargas-Avila, J. a., & Opwis, K. (2010). Mental models for web objects: Where do users expect to find the most frequent objects in online shops, news portals, and company web pages? Interacting with Computers, 22(2), 140– 152. doi:10.1016/j.intcom.2009.10.004
Salimun, C., Purchase, H. C., Simmons, D. R., & Brewster, S. (2010). The effect of aesthetically pleasing composition on visual search performance. In Proceedings of the 6th Nordic Conference on Human-Computer Interaction Extending Boundaries - NordiCHI ’10 (p. 422). New York, New York, USA: ACM Press. doi:10.1145/1868914.1868963
Schmettow, M., & Boom, Q. (2013). Hedonic Quality: The Inference and perspective processing approach. University of Twente.
Schmettow, M., & Kuurstra, J. (2013). The influence of visual complexity and prototypicality on credibility judgments of websites. University of Twente.
Schmettow, M., & Overkamp, L. (2013). Beauty and Color in Human-Computer. Interaction An Implicit Measurement. University of Twente.
Thielsch, M. T., Blotenberg, I., & Jaron, R. (2013). User Evaluation of Websites: From First Impression to Recommendation. Interacting with Computers, 26(1), 89–102.
doi:10.1093/iwc/iwt033
Tractinsky, N., Katz, A. S., & Ikar, D. (2000). What is beautiful is usable. Interacting with Computers, 13(2), 127–145. doi:10.1016/S0953-5438(00)00031-X
Tuch, A. N., Bargas-Avila, J. a., Opwis, K., & Wilhelm, F. H. (2009). Visual complexity of websites: Effects on users’ experience, physiology, performance, and memory.
International Journal of Human-Computer Studies, 67(9), 703–715. doi:10.1016/j.ijhcs.2009.04.002
Tuch, A. N., Presslaber, E. E., Stöcklin, M., Opwis, K., & Bargas-Avila, J. a. (2012). The role of visual complexity and prototypicality regarding first impression of websites: Working towards understanding aesthetic judgments. International Journal of Human-Computer Studies, 70(11), 794–811. doi:10.1016/j.ijhcs.2012.06.003
Zajonc, R. B. (1968). Attitudinal effects of mere exposure. Journal of Personality and Social Psychology, 9(2, Pt.2), 1–27. doi:10.1037/h0025848
Appendix A
German Dutch Dutch German
(Durchschaubarheit)
Leicht zu lernen Makkelijk te leren Moeilijk te leren Schwer zu lernen
unverständlich onbegrijpelijk begrijpelijk Verständlich
(novelty)
Herkömmlich Gebruikelijk Nieuw
(in zijn soort)
neuartig
originell origineel conventioneel konventionell
(Stimulation)
wertvoll waardevol minderwaardig minderwertig
uninteressant oninteressant interessant interessant
(Verlässlichkeit)
unberechenbar onberekenbaar voorspelbaar voraussagbar
Sicher zeker onzeker unsicher
(Effizienz)
Schnell snel langzaam langsam
ineffizient inefficiënt efficiënt effizient
(Attraktivität)
erfreulich plezierig onplezierig unerfreulich
gut goed slecht schlecht
Abstoßend afstotelijk aantrekkelijk anziehend
unangenehm onprettig prettig Angenehm
Attraktiv attractief onattractief unattraktiv
Appendix B
Design Quality
Stimulation
valuable / inferior* boring / exiting
not interesting / interesting* motivating / demotivating
Novelty creative / dull
inventive / conventional* usual / leading edge* conservative / innovative
Use Quality
Efficiency fast / slow*
inefficient / efficient* impractical / practical organized / cluttered
Perspicuity
not understandable / understandable* easy to learn / difficult to learn* complicated / easy
clear / confusing
Dependability
unpredictable / predictable* obstructive / supportive secure / not secure*
meets expectations / does not meet expectations
Attractiveness
annoying / enjoyable*
good / bad*
unlikable / pleasing*
unpleasant / pleasant*
attractive / unattractive*
friendly / unfriendly*
*These items (in Dutch) were used
Appendix C
Estimates of Fixed Effects with significance levela
Parameter Estimate df
t
Sig. 95% Confidence Interval Lower
Bound
Upper Bound
Intercept .008652 36.74 0.39 .70 -.04 .05
[Scale A] * [17ms] *
zRespUnlim .175363 7838.82 5.87 .00 .12 .23
[Scale A] * [50ms] *
zRespUnlim .382819 7838.82 12.82 .00 .32 .44
[Scale A] * [500ms] *
zRespUnlim .609568 7838.82 20.42 .00 .55 .67
[Scale D] * 17ms] *
zRespUnlim .060785 7862.89 1.15 .25 -.04 .16
[Scale D] * [50ms] *
zRespUnlim .221117 7862.89 4.17 .00 .12 .33
[Scale D] * [500ms] *
zRespUnlim .445537 7862.89 8.40 .00 .34 .55
[Scale E] * [17ms] *
zRespUnlim -.038531 7842.90 -0.70 .49 -.15 .07
[Scale E] * [50ms] *
zRespUnlim .287720 7842.90 5.21 .00 .18 .40
[Scale E] * [500ms] *
zRespUnlim .479282 7842.90 8.67 .00 .37 .59
[Scale N] * [17ms] *
zRespUnlim .025925 7421.17 0.51 .61 -.07 .13
[Scale N] * [50ms] *
zRespUnlim .299758 7421.17 5.93 .00 .20 .40
[Scale N] * [500ms] *
zRespUnlim .540991 7421.17 10.69 .00 .44 .64
[Scale P] * [17ms] *
zRespUnlim .139555 7868.46 2.54 .01 .03 .25
[Scale P] * [50ms] *
zRespUnlim .255928 7868.46 4.66 .00 .15 .36
[Scale P] * [500ms] *
zRespUnlim .490922 7868.46 8.94 .00 .38 .60
[Scale S] * [17ms] *
zRespUnlim .160268 7445.68 3.06 .00 .06 .26
[Scale S] * [50ms] *
[Scale S] * [500ms] *
zRespUnlim .609904 7445,68 11.64 .00 .51 .71
a. Dependent Variable: zResponse; scales: A= attractiveness, D=dependability, E= efficiency, N= novelty, P= perspicuity, S= stimulation
Interaction between PT, VS and items (in detail)
Parameter Estimate Sig. 95% Confidence Interval
Lower Bound Upper Bound
Intercept -.028 .53 -.12 .06
[A-good] .256 .00 .13 .38
[A-unlikable] .132 .04 .01 .26
[A-friendly] -.205 .00 -.33 -.08
[A-pleasant] .102 .11 -.02 .23
[A-attractive] .285 .00 .16 .41
[A-enjoy] .163 .01 .04 .29
[D-predict] .039 .53 -.08 .16
[D-secure] -.070 .27 -.19 .05
[E-fast] -.087 .17 -.21 .04
[E-efficienct] .166 .01 .04 .29
[N-usual] -.235 .00 -.36 -.11
[N-inventive] .253 .00 .13 .38
[P-understand] -.026 .68 -.15 .10
[P-learn] .033 .60 -.09 .16
[S-value] .208 .00 .08 .33
[S-interest] -.200 .00 -.32 -.08
zVS .030 .50 -.06 .12
zPT -.034 .44 -.12 .05
[A-good] * zVS -.136 .03 -.26 -.01
[A-unlikable] * zVS -.154 .02 -.28 -.03
[A-friendly] * zVS .092 .14 -.03 .21
[A-pleasant] * zVS -.015 .82 -.14 .11
[A-atractive] * zVS -.024 .71 -.15 .10
[A-enjoy] * zVS -.017 .79 -.14 .11
[D-predict] * zVS .039 .54 -.09 .17
[D-secure] * zVS -.139 .03 -.26 -.01
[E-fast] * zVS .060 .35 -.07 .19
[E-efficient] * zVS .019 .76 -.10 .14
[N-usual] * zVS .119 .06 .00 .24
[N-inventive] * zVS -.262 .00 -.38 -.14
[P-understand] * zVS -.201 .00 -.33 -.07
[S-value] * zVS -.70 .01 -.30 -.05
[S-interest] * zVS .051 .42 -.07 .18
[A-good] * zPT -.154 .01 -.28 -.03
[A-unlikable] * zPT -.097 .15 -.23 .03
[A-friendly] * zPT .257 .00 .14 .38
[A-pleasant] * zPT .218 .00 .10 .34
[A-attractive] * zPT -.194 .00 -.31 -.07
[A-enjoy] * zPT .033 .61 -.09 .16
[D-predict] * zPT .134 .03 .01 .26
[D-secure] * zPT -.143 .02 -.26 -.02
[E-fast] * zPT -.086 .17 -.21 .04
[E-efficient] * zPT .210 .00 .09 .33
[N-usual] * zPT .089 .16 -.03 .21
[N-inventive] * zPT -.112 .09 -.24 .02
[P-understand] * zPT -.054 .38 -.18 .07
[P-learn] * zPT .222 .00 .10 .35
[S-value] * zPT -.200 .00 -.32 -.08
[S-interest] * zPT .233 .00 .11 .36
a. Dependent Variable: zResponse; A= attractiveness, D=dependability, E= efficiency, N= novelty, P= perspicuity, S= stimulation