Master Thesis
Business
Administration
© Ben van Dongen
(S1495275)
May, 2016
“A Restructuring Process”
Title
“A Restructuring Process: A case study on evaluating layout alternatives
for an OEM”
Date
May 23, 2016
Author
Name:
Ben van Dongen
Student number: S1495275
A thesis submitted for the degree of:
Master of Science
Business Administration
Track: Financial management
Educational Institution
University of Twente
Graduation Committee
1
steSupervisor:
Dr P.C. Schuur
2
ndSupervisor:
Ir. H. Kroon
Company Supervisor
"
Teamwork is the ability to work together toward a
common vision. The ability to direct individual
accomplishment toward organisational objectives.
It is the fuel that allows common people to attain
uncommon results."
Management summary
Problem definitionIn order to fulfil their ambition of becoming a more reliable original equipment manufacturer (OEM), the company has upgraded and optimised its production in recent years as much as possible given several restrictions. The company is producing what customers request, which aligns with the customer intimacy strategy. As their operations currently focus mainly on in-house production, their working methods correspondingly focus on engineer-to-order and make-to-stock. Both of these methods result in the proliferation of parts and focussing on one piece instead of the total costs of machines. The following other bottlenecks have been identified based on the company’s current working method and two production sites:
Transportation costs;
Other costs due (such as inventory cost, possibly incorrect cost prices and the actual cost of phantom parts);
Inefficiencies due to workflows within the existing layout; and
The customer order decoupling point.
In order to tackle such problems, the company was planning to move to a new facility. This study is therefore a limited greenfield optimisation project concerning the retrofitting of a new facility. The company’s management department also wished to increase the company’s output.
Central research question
The company’s target has been transformed into the following central research question for this thesis:
“How can the company’s production process be optimised by establishing an effective workflow for a new production facility?”
In short, the goal of this study is to design and implement an effective workflow by optimising the production process for a new production facility in a way that meets the requirements of all stakeholders. These requirements are not just physical and technical; they are financial as well.
Methods
The methods used for this research were derived from the literature. We chose different models for different purposes; in brief:
The action research approach was used to both guide the process of designing different layouts and implement the selected layout.
A modified version of the systematic layout planning procedure was used to solve the layout problem and served as the structure for the theoretical framework.
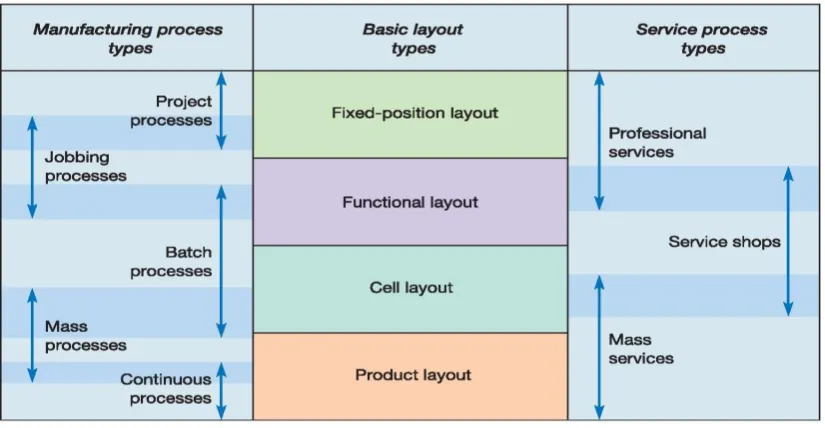
Because the company is an OEM with a high-variety and low-volume environment, a combination of the process and open-field layouts was identified as being best for routing the flow of materials.
The most suitable layout was implemented within the timeframe of this thesis by using five control factors as guidance (namely time, money, quality, information and organisation).
To determine the firm’s core competency, we applied the value disciplines model of Treacy and Wiersema (1997).
Different applicable key performance indicators (KPIs) were derived from the literature.
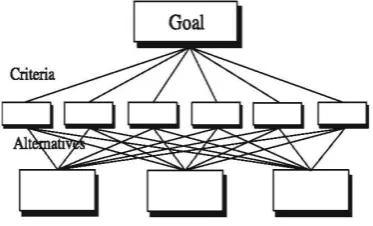
We modified the analytical hierarchy process to judge the layouts individually and tried to improve on them by designing a new alternative.
Results
The main conclusions of our research are as follows:
Out of the 28 layout alternatives we designed, 4 led to the greatest changes. We then compared these four based on different criteria (e.g., ease of future expansion and material-handling effectiveness). As layout alternative 4 (figure A) satisfied more selection criteria than the other alternatives, it was selected for implementation.
Before implementing the layout, we also designed a 3D model using the exact building and machine measurements.
Within the timeframe of this thesis, we were able to implement the most suitable layout for the company. Implementing a layout involves many different issues and problems, and the master builder must react to changes or disruptions in progress appropriately. Remaining flexible is key. We performed several tasks to ensure that the move to the new production facility would go smoothly; in particular, we:
o Explained the new layout to the company’s employees and stakeholders; o Moved the actual production facilities to the new facility;
o Undertook financial budgeting;
o Engaged, selected and supervised different subcontractors; and o Started to introduce change management for further research and
implementation.
Implementation was successfully completed at the end of January 2016 and the production facility is currently fully operational. As the shareholders, managers and employees are all pleased with the new production facility, workflows and
movement, we can conclude that the move (and thus the project) has been successfully implemented.
With regard to the implementation of the chosen layout, it should be noted that human aspects had a major influence on the project, especially the move to the new production facility. We created support for the move by keeping stakeholders, managers and employees informed about the project. After all, while management makes the decisions, employees can break them.
Recommendations
Based on the results of this study, we offer the following recommendations:
A balance between customer satisfaction and operational costs is always necessary. Instead of the current combined working methods, the company should apply the recommended make-to-order work method.
When combined with modular design and the standardisation of the production process, the recommended work method will lead among other things to cost reduction, the prevention of obsolete parts, increased machinery utilisation, improved flexibility and shorter lead times.
Daily activities should be monitored together with goals. We recommend using three KPIs to do so, namely: the rate of obsolete inventory, on-time production and
supplier fill rate.
Phase Action Actor
1 Apply the three recommended KPIs within the production process Management
2 Standardise different parts Engineering
3 Determine the actual core components Engineering
4 Improve the costs for phantom parts Operational manager
5 Apply the SCOR model to integrate the supply chain Operational manager
6 Further research for reducing inefficient work methods Operational manager
7 Further research on how to implement different optimisation techniques Operational manager
8 Introduce modular design for the machines produced Engineering
Roadmap
To facilitate the achievement of the aforementioned improvements, we propose the following roadmap to guide the company.
Preface
This thesis is written to satisfying a requirement for receiving my Master’s in Business Administration from the University of Twente. The research was performed over the course of eight months at the company. The goal of this research was to create an effective workflow by optimising the production process for a new the company production facility.
This work could not have been realised without the help of many people. I first want to thank the company for giving me the opportunity to write my thesis with them as well as for the experience of formulating, writing and implementing out my own thoughts. In addition, I want to thank all of the company’s employees for their cooperation, valuable contributions and proactive participation in conjunction with this project. I would particularly like to thank my colleagues for the help and advice they provided me on regular basis; I was grateful that they always made time to assist me.
Above all, my sincere gratitude goes to Peter Schuur, my supervisor at the University of Twente, for his guidance and feedback during my research. I also want to extend special thanks to my supervisor for answering all of my questions, providing support and taking the time to learn about the practical implementation of the move I was proposing. I additionally want to thank my second supervisor for his feedback and valuable contributions.
Last but not least, I thank my mother, sister, girlfriend, and other family and friends for their support throughout my research. The period may not have been completely pleasant for them, but I am very appreciative that they always stood by me.
This report is dedicated to my father who I wish was alive to share it.
Overall, I tried to fulfil the goal of this research with great enthusiasm; I hope this enthusiasm will be felt by all those who read this thesis.
Ben van Dongen
Table of contents
Management summary ... iii
Preface ... vii
Table of contents ... ix
Glossary ... xi
1 Introduction ... 1
1.1 Problem definition ... 1
1.2 Problem statement ... 2
1.2.1 Research objective ... 2
1.2.2 Main research question ... 2
1.2.3 Research sub-questions ... 2
1.2.4 Research scope ... 3
1.2.5 Deliverables ... 3
1.3 Project design ... 4
1.4 Research method ... 6
1.5 Report overview ... 7
2 Theoretical framework ... 9
2.1 Layout procedure ... 9
2.2 Input data and activities ... 12
2.2.1 Product design ... 12
2.2.2 Process design ... 12
2.2.2.1 Supply chain... 13
2.2.2.2 Supply chain management ... 13
2.2.2.3 SCOR model ... 14
2.2.2.4 Customer order decoupling point (CODP) ... 20
2.2.2.5 Core competency of the firm ... 22
2.2.3 Schedule design ... 23
2.3 Flow of materials ... 26
2.4 Activity relationship ... 27
2.5 Analytical analysis ... 29
2.5.1 Decision-making method ... 29
2.5.2 Optimisation techniques ... 31
2.6 Discussion of the theoretical framework ... 33
3 Description of the existing situation ... 35
3.1 The company’s core competency ... 35
3.2 Products ... 36
3.3 Markets ... 38
3.4 Production process in the existing situation ... 39
3.5 Layout of the existing layout ... 41
3.6 Performance in the existing situation ... 43
3.7 Bottlenecks in the existing situation ... 44
3.8 Summary of the existing situation ... 48
4 To-be situation at the company ... 49
4.1 Process factors at the company ... 49
4.2 Routing of the flow of materials in the to-be situation ... 50
4.3 Production process in the to-be situation ... 51
4.4 Performance in the to-be situation ... 52
4.5 Summary of the to-be situation ... 52
5 Layout selection ... 55
5.1 Requirements and restrictions ... 55
5.2 Practical limitations ... 55
5.3 List of criteria ... 57
5.4 General layout options ... 58
5.4.1 Number of departments ... 58
5.4.2 Practical limitations taken into consideration in the general layout ... 58
5.4.3 General layout options ... 59
5.5 Detailed layout ... 60
5.5.1 Required elements ... 60
5.5.2 Detailed layout alternatives and evaluations thereof ... 61
5.6 Discussion and evaluation of the layout alternatives ... 68
6 Layout implementation ... 69
6.1 The design cycle ... 69
6.2 Control factors for implementation ... 69
6.2.1 Time management ... 70
6.2.2 Money management ... 72
6.2.3 Quality management ... 72
6.2.4 Information and organisation management ... 72
6.3 Accomplishments and the 3D model ... 73
7 Recommendations and conclusions ... 75
7.1 Overall conclusions regarding the layout alternatives ... 75
7.2 Roadmap ... 76
7.3 Further research ... 77
References ... 78
Appendix 1: Organisation chart of the Group ... 87
Appendix 2: Codification of the SCOR Model ... 88
Appendix 3: Products information guide the company... 90
Appendix 4: Overview of variety within the Product E ... 91
Appendix 5: Proposed layout by Kiens (2013) ... 92
Appendix 6: Detailed overview of the space requirements ... 93
Appendix 7: Detailed overview of the layout alternatives ... 94
Glossary
AHP: Analytic hierarchy process
AR: Action research
ATO: Assemble-to-order
BOM: Bill of materials
BTO: Build-to-order
CODP: Customer order decoupling point
CRAFT: Computerized Relative Allocation of Facilities Technique CSP: Customer service processes
CTO: Configure-to-order
DFMC: Design for mass customization
DTO: Design-to-order
ETO: Engineer-to-order
FLING: Facility layout using interactive graphics FMS: Flexible manufacturing system
IFLAPS: Intelligent facilities layout planning and analysis system
KPIs: Key performance indicators
LM: Lean management
MCDM: Multi-criteria decision-making
MOCRAFT: Micro Computerized Relative Allocation of Facilities Technique MTO: Make-to-order
MTS: Make-to-stock MvB: Make vs. buy
OEM: Original equipment manufacturer OFP: Order fulfilment processes PDP: Product development processes QRM: Quick response manufacturing REL: Relationship diagram
SCC: Supply chain council SCM: Supply chain management
SCOR: Supply chain operations reference
SLP: Systematic layout procedure
TMQIO: Time, money, quality, information and organisation
WIP: Work in progress
1
Introduction
In the framework of completing my Master’s in Business Administration at the University of Twente, I performed research on designing an effective workflow by optimising the
production process for a new production facility at the company, which is located in the Netherlands. The company, which was founded in mid’ 90s as a family concern, has
developed into a specialised global manufacturer of machinery that focuses its activities on different industries. Its customers are transforming materials into more suitable forms (e.g., pellets) in order to create benefits such as size reduction (Al-Salem, Lettieri, & Baeyens, 2009; Mani, Tabil, & Sokhansanj, 2006; Obernberger & Thek, 2004; M. Thomas & van der Poel, 1996).
As part of the group (see appendix 1), the company currently specialises in creating maximum synergy among the different companies held by that group with the goal of strengthening turnkey group projects. The main activities of the company focus on the production machinery as well as on developing, engineering and servicing the equipment that the company supplies. For example, the company produces a press line (see figure 1.1 and figure 1.2). This is a combination of machinery, in which raw materials are the input and pellets (figure 1.3) are the output.
Developing and producing high-quality and reliable machinery enables the company to create customer benefits in multiple ways, such as by lowering energy consumption and maintenance requirements and increasing company yields. In addition, the company
transforms state-of-the-art technology into added value for its customer. With customers all over the world and a large established customer based, the company has become a
respected original equipment manufacturer (OEM).
1.1
Problem definition
In order to fulfil the ambition to become a reliable OEM, the company has upgraded and optimised its production in recent years as much as possible given several boundaries. Furthermore, the demand for machinery is still increasing. Currently the company has two production sites, which leads to inefficiency due to the constant transport of unfinished goods between both production sites and the assembly department. In addition, the main production building houses dated and dusty machinery that must be used on a manual and individual basis. All of the examples of inefficient production noted above are reflected in lead times, product quality and the quantity of finished products that the company assembles.
In order to tackle such inefficiency problems and achieve its ambitions, the company is planning to move to a new facility at [location] The management department also wishes to increase the company’s output by achieving an effective process in the new facility. It is thus mandatory that the company re-invent its production and logistic process. To remain
Figure 1.3: Different types of pellets
Figure 1.2: Installed production line in Germany
competitive, organisations need to be constantly increasing their customer service while reducing their operating costs (D. J. Thomas & Griffin, 1996). As custom working methods are a major factor and influence operating costs, it is important to define which working method creates an effective workflow and results in reduced operating costs.
1.2
Problem statement
This section describes the research objective, the main research question, the research sub-questions and both the scope and the deliverables of this thesis.
1.2.1 Research objective
The goal of this thesis is to design an effective workflow by optimising the production process for a new production facility while reflecting the requirements of all stakeholders (which are financial as well as physical and technical). Results can be measured through several factors, such as reduced operating costs, reduced lead times, higher quality products and increased annual machine production quantities. The research question and the purpose of this thesis contain multiple terms that leave room for speculation, including “effective workflow” and “layout”. It is essential to define each of these terms in order to answer the research question correctly and understand the purpose of this thesis. The definitions of these terms will be given in chapter 2 (theoretical framework).
1.2.2 Main research question
As stated in the introduction, the company’s target can be transformed into the following central research question:
“How can the company’s production process be optimised by establishing an effective workflow for a new production facility?”
1.2.3 Research sub-questions
In order to answer this question, it must be divided into different sub-questions. A distinction is made between the current situation (or as-is state) and the ideal future situation (or to-be state) (Wiele, Kok, McKenna, & Brown, 2001). The as-is situation mainly focuses on analysing the current situation at the company, while the to-be situation is derived from a literature review that is combined with a set of restraints and requirements identified from
stakeholders. Stakeholders are defined as key players who have great interest in this research and can influence its outcome significantly.
The sub-questions identified for this research are as follows:
1. What is the as-is situation at the company with respect to its production and logistic processes?
a. Within that process, what are the company’s activity priorities and where does the added value within these activities lie?
b. How does the current working method influence the actual operating costs? c. How does the company use supply chain management (SCM) in its
production and logistic process?
d. Which key performance indicators (KPIs) are used to measure the current production and logistic process and how are these KPIs currently
performing?
2. What are the main current bottlenecks within the process and how can they be improved?
a. Which general types of layout (route of the flow of materials) are applicable to the company within the parameters set by key stakeholders?
b. What work methods may produce an effective workflow and how do they influence operating costs?
c. Which KPIs can be used to measure an effective workflow in the production and logistic process?
4. How can the structural approach be applied within the new facility at the company while taking the wishes and restrictions of key stakeholders into account?
a. What are the main criteria for layout design In order to achieve efficiency in the production and logistic process?
b. What practical requirements and restrictions do key the company stakeholders demand?
c. Which techniques can be used to achieve an effective workflow by optimising efficiency in the production and logistic process?
d. How can these techniques be applied to the general layout in order to solve the inefficiency problem?
e. Which layout alternatives are suitable for the company and what are the pros and cons of each?
f. Which scientific research method can be used to select the most appropriate layout design for the company?
5. Given the parameters set by key stakeholders, what is the most suitable layout design for the company with an effective work method to minimise operating costs and which KPIs are useful for monitoring this outcome?
1.2.4 Research scope
This thesis focuses on designing an effective workflow by optimising the production process used at a new production facility. The research is a limited greenfield optimisation project, concerning the reconstruction of a new facility. The alternative to a greenfield is a
brownfield, which concerns restructuring an existing facility (K. Meyer & Estrin, 2001). This greenfield optimisation project has its limitations, given that it is limited to the facility that is located at [location]. the company became owner of the facility on July 3th 2015. The
effective workflow must fit this new building and should be sustainable for the next 10 years. In addition, the scope of this research had to be narrowed even more due to resource and time limitations. External factors such as customer demands are thus considered as ceteris paribus. The management department of the company wishes to increase the company’s output, which can be achieved by optimising the production process in the new production facility.
Consequences for the employees as a result of this research are not taken into account as considering these aspects may affect the process of designing an effective workflow. The condition of the company’s current machinery is analysed, which may influence the mapping of the layout. Technical product analysis is excluded from this research, which results in the assumption that products created and machines used by the company will not dramatically change in the near future.
1.2.5 Deliverables
The deliverables that result from answering this project’s main and sub-questions are summarised below.
2. Practical implementation of the new production environment that is suggested by this research. This include several tasks to move smoothly to new the production facility:
a. Explaining the new layout to the company’s employees and stakeholders; b. Moving the actual production facilities to the new facility;
c. Financial budgeting;
d. Engaging, selecting and supervising different subcontractors; e. Starting to introduce change management for further research and
implementation,
3. A useful and future-oriented working method that creates an effective workflow and results in near-minimum operating costs and that can be secured by monitoring essential KPIs.
This approach will be of great value to the organisation, as the report can be used as a guide for solving other facility layout problems.
1.3
Project design
The research framework model that is used to answer the main research questions is designed around visual steps (figure 1.4). For the sake of clarity, the model uses different coloured boxes. Furthermore, boxes with a red border contain the output of research. This project includes seven different phases:
Phase 1: Analysing the as-is situation in order to understand the company’s
production and logistic process. Also in this phase we analyse factors such as
SCM and working methods.
Phase 2: Identifying bottlenecks derived from the as-is state of the company. Besides, practical limitations defined by key stakeholders are taken into account (given that they affect the possible outcomes).
Phase 3: Exploring the theoretical background, which reveals layout criteria, possible working methods and KPIs and creates an effective flow whereby operational costs can be minimised.
Phase 4: Combining the bottlenecks, stakeholder wishes and theoretical background to create a structural approach for designing an effective flow within a new facility.
Phase 5: Carrying out a case study for the company, which enables the structural approach to be tested and an effective flow with minimal operation costs to be designed for the company. Multiple optimisation techniques can be used to improve the layout and solve the bottlenecks.
Phase 6: After analysing the alternatives and evaluating their pros and cons, designing a facility layout that features a working method and KPIs that can be used to monitor the production and logistic process.
Phase 7: Drawing conclusions, answering the main research question, discussing the results and making recommendations for further research.
1.4
Research method
Different types of research methods and data sources can be used to obtain the essential information described in the research framework (figure 1.4). It is not recommendable to narrow the methodology down to one specific research approach, as doing so it may put the quality of the research at risk. Applying a specific research approach to each of the subjects covered in the study’s sub-questions is a useful alternative. This study focuses on qualitative research rather than quantitative research. According to Strauss and Corbin (1990),
qualitative research can be defined as “any type of research that produces findings not arrived at by statistical procedures or other means of quantification” (p. 10). Techniques associated with qualitative research include observations and interviews (Strauss & Corbin, 1990). In addition, Patton (2014) notes that qualitative findings can be derived from in-depth interviews, written communications and direct observations. Qualitative research can be divided into three components. First, data need to be collected (several possible techniques may be used). Second, procedures need to be followed to organise data. Third, a report must be written (Strauss & Corbin, 1990). Based on the qualitative research approach and a combination of possible techniques, the current situation is analysed through a combination of in-depth interviews, direct observations and written documentation. As stated previously in the research framework, information from stakeholders can be collected using one or more of the possible qualitative data techniques.
This research uses the action research (AR) method, which should lead to action (Lewin, 1946). Lewin, who defined this term in the mid-1940s, suggested that research should help the practitioner. As AR combines practice with theory, it brings researchers and practitioners together (Avison, Lau, Myers, & Nielsen, 1999). This approach consequently takes action, which results in creating knowledge and possibly theories about that specific action (Coghlan & Brannick, 2014).
Figure 1.5 shows the AR cycle, which is also called the cycle of activities. At the beginning, a problem is diagnosed or the context and purpose are defined. Six different steps are then divided into problem diagnosis, action
intervention and evaluation (Avison et al., 1999; Coghlan & Brannick, 2014). As shown in the figure, the
researcher’s role is to monitor the entire cycle. Each AR cycle could eventually lead to a new cycle; it is even possible that a larger project consists of multiple smaller AR cycles (Avison et al., 1999; Coghlan & Brannick, 2014; Coughlan & Coghlan, 2002).
The role of the researcher consequently changes constantly within each AR cycle. The expertise of the researcher may be necessary in some instances, while the researcher can also be a participant. It is important to understand that the researcher should collaborate with stakeholders as well as with other participants (Berg, 2001). As Berg has suggested, constant interaction between the researcher and the different stakeholders is necessary throughout the project. It is important to maximise participation of these stakeholders by continuously sharing research results (Berg, 2001).
1.5
Report overview
In order to answer the central research question and related sub-questions, in chapter 2 we analyse different models derived from the literature. The purpose of this chapter is to select the models that are applied in subsequent chapters. Thereafter, chapter 3 analyses the company’s current situation and performance to identify important bottlenecks. This chapter also provides background information on the company that helps to clarify their core
competency, product marketing mix, production process and existing layout by using
2
Theoretical framework
This chapter presents the theoretical framework. The main purpose of this chapter is to select different models, which can be applied to this research. In order to design a structure for this chapter, different steps within the strategic layout planning (SLP) model are used as guidance. Therefore, section 2.1 will elaborate the layout procedure. Section 2.2 focuses on the input of data and activities, where information is gathered about the product, process and schedule design as all three affect the layout. The following section is the first step in the analysing phase of the SLP model and is named as the ‘flow of materials’. The purpose of this section is to define and map an effective flow. Next, the activity relationship is described in section 2.4 to actually map the routing of the flow of materials. As the aim is to reduce the influence of individual’s intuition on the layout procedure, section 2.5 discusses the analytical analysis. Finally, the last section will discuss the models which we choose to apply in this research.
2.1 Layout procedure
The placement of facilities within a plant area is referred to as the facility layout problem or layout design (Drira, Pierreval, & Hajri-Gabouj, 2007). It has been formally studied since the mid-1950s (Heragu, 2008) and has had a significant influence on productivity, lead times, work in process and operational costs (Drira et al., 2007). Heragu (2008) describes facility layout as an arrangement of departments that is intended to make products or provide services. Efficiency can be created by minimising movements of both people and resources between departments (Heragu, 2008). If layouts are not well-implemented, dramatic results such as inflexible operations, high lead-times, increased costs and over-long flow patterns can occur (Francis, McGinnis, & White, 1992; Slack, Chambers, & Johnston, 2010). Slack, Chambers and Johnston (2010) therefore define layout as “how [a company’s] transformed resources are positioned relative to each other and how its various task are allocated to these transforming resources" (p. 179). As the proposed definitions differ in detail, only the definition of Slack et al. (2010) is used in this thesis. This definition reflects a combination of workflows, work methods and the physical mapping of the various tasks to transform recourses.
Different layout procedures have been developed over time by different authors, such as Apple, Muther, Tompkins and Reed (Francis et al., 1992; Tompkins, White, Bozer, & Tanchoco, 2010). Their methods can be summarised as collecting data, analysing (flow) relationships and space requirements, designing layout alternatives, evaluating the performance of these alternatives and finally moving to implementation. The models they have proposed serve as a foundation for the current scientific literature. As described by Muther (1973), today’s SLP is a method that is recommended for facility layout design (Chase, Jacobs, & Aquilano, 2005; Heragu, 2008). This layout procedure, which was revised by Francis et al. (1992), is used as a framework for this thesis.
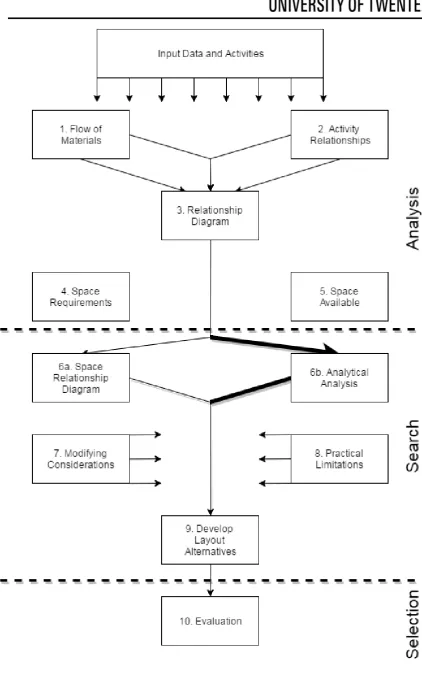
Unless stated otherwise, the model used in this research is based on the original approach of Muther (1973) and the modified SLP procedure proposed by Francis et al. (1992). The modified framework, which is shown in figure 2.1 (see page 11), can be divided into three phases: analysing the layout problem (steps 1 through 5), searching for design alternatives (steps 6 through 9) and selection of the layout (step 10).
can be used to construct a relationship (REL) diagram, which presents a picture of the collected data. Before a space relationship diagram can be constructed, the space
requirements and availability must be identified. This diagram is also a crude layout or layout plan, as modifying considerations and practical limitations are not taken into account. Step 6b was developed by Francis et al. (1992) in order to reduce the influence of individuals’ intuition on the traditional layout procedures. Layout alternatives can be developed once the space relationship diagram, analytical analysis, modifying considerations and practical limitations are all available. Finally, the layout alternatives must be evaluated in order to select the preferred design (which is mostly the best compromise between different objects). For example, objects are minimising costs, minimising production times and enhancing employee convenience. These objects still differ in each facility layout problem and hence need to be formulated as goals. As the new design is future orientated, expected future costs must be taken into account in the evaluation phase.
Nevertheless, identifying a new layout design is not the final phase in the research. The new layout must also be explained to appropriate employees in order to create the necessary support and acceptance of the new layout before it can be installed. The complete process of designing the layout is monitored and evaluated, and a redesign decision can sometimes occur. In summary, the design process is actually a cycle, whereby data input is necessary to create a layout design and implementation cannot be achieved without an organisation’s support. To illustrate the process, the following section focuses on the input of data and activities (as shown in figure 2.1, see next pages).
Discussion layout procedure
As stated in the research objective (1.2.1), terms as “layout” need to be defined in order to clarify the research goal. Therefore, the meaning of layout for this research is equal to the definition described by Slack et al. (2010). The definition does not only cover the physical mapping but includes workflows and work methods as well. All three subjects are essential for answering the research questions. In the sequel, we modify the SLP procedure to our purpose as it provides us guidance to solve the layout problem as well as to structure the theoretical framework. The reason for choosing this framework is the wide interpretation and the possibility to link other theories within this framework. In this thesis we split the SLP procedure in a theoretical part (e.g., input data and activities, flow of materials, activity relationships and analytical analysis) and a practical part (all other steps). Within the practical part most of these steps are used in section 5.5 (detailed layout).
2.2 Input data and activities
As stated in the previous section, it is necessary to identify input and data of activities as this influences the layout directly or indirectly. Therefore, it is essential to define definitions and derive models from literature for product, process and schedule design. The first section will elaborate on product design, as the form of the product influences the flow of operations. Section 2.2.2 identifies a set of operations established to produce the product, so called process design. Finally, section 2.2.3 provides us performance measurement tools in order to monitor the daily production process.
2.2.1 Product design
No commonly accepted definition for product design exists in the scientific literature (Luchs & Swan, 2011). Luchs and Swan suggest that form and function should be integrated into the term’s definition; they state that product design is “the set of properties of an artefact, consisting of the discrete properties of the form (i.e.,, the aesthetics of the tangible good and/or service) and the function (i.e.,, its capabilities) together with the holistic properties of the integrated form of function” (Luchs & Swan, 2011, p.12). A definition from Creusen (2011) suggests that “product design refers both the process and result of determining the physical execution and arrangement of the characteristics of a product offering. These characteristics refer to functionalities and physical appearance/form” (p.1). The form of the product can influence its functionality (Luchs & Swan, 2011) and thus the flow of operations. The design of the product also significantly affects the layout, both directly and indirectly. In addition, the sequence of operations directly influences the layout, while process design has an indirect effect on the layout (Francis et al., 1992).
2.2.2 Process design
According to Francis et al. (1992), process design is a set of operations that is established to produce a defined product. Central subjects within process design discussions include determining outsourcing and the operation time for components (Francis et al., 1992). Another definition for process is a “structured, measured set of activities designed to produce a specified output for a particular customer or market” (Davenport, 2013, p.5). In order to achieve a process’s goal, interaction between entities both within and outside of the company is necessary (Lin & Shaw, 1998). Several other classifications exist in relation to topic of the business process (Aguilar-Savén, 2004). The terms “core process” and “supportive process” are commonly used in the literature; the former describes an organisation’s primary process, while the latter has a supportive task in creating the circumstances required in order to undertake the core process. A possible third term is “management process”, which could be described as a supporting process (Davenport & Ould, as cited in Aguilar-Savén, 2004; Lin & Shaw, 1998). The core competency of firm is further elaborated in section 2.2.2.5 (core competency of the firm).
The set of operations to produce a defined product depends not only on in-house activities, but includes the activities out-side the company as well. Therefore, in subsection 2.2.2.1 the supply chain is defined. In order to manage these multiple relations, supply chain
management is introduced in section 2.2.2.2. This section provides us the possibility to choose a model in order to measure the supply chain performances. The Supply Chain Operations Reference recommended by several authors is briefly discussed in section 2.2.2.3. The model is a strategic planning tool, simplifying the complexity of supply chain
management. As other methodologies, in particular the customer order decoupling point (CODP) are integrated, it is necessary to define the term CODP. Because the process is
depending on the strategy a company chooses, the possible core competency of the firms are defined in paragraph 2.2.2.5.
2.2.2.1 Supply chain
To produce a specified output as Davenport (2013) has suggested in his definition of process, business and primary processes are integrated into supply chain networks (Cooper, Lambert, & Pagh, 1997; Lin & Shaw, 1998). Many other definitions for supply chain are also proposed in the literature. Stevens (1989) defines a supply chain as a “connected series of activities which is concerned with planning, coordinating and controlling material, parts and finished goods from suppliers to the customer” (p.3). This definition is almost the same as that of Towill (1996). A similar supply chain definition is also suggested by Beamon (1998): “an integrated process wherein a number of various business entities work together in an effort to: (1) acquire raw materials, (2) convert these raw material into specified final products, and (3) deliver these final product to retailers” (p.281). Stevens (1989) suggests that two types of flows exist within a supply chain, namely material and information flows. While the material flow goes forward, the information flow goes backward through the supply chain (Beamon, 1998; Stevens, 1989; Towill, 1996). It is important to manage both the forward-moving material flow and the backward-moving information flow (Shin, Collier, & Wilson, 2000). From the above definitions it is clear that the supply chain focuses on the supply and distribution side of an entity. The customer who consumes the product is always at the end of the supply chain (Wisner, Tan, & Leong, 2015). In order to fulfil the needs of the customer, companies are part of a large and complex supply chain system. The value chain focuses on flows as primary (internal) activities, while the supply chain focuses more on an enterprise’s demand side (Enarsson, 2006).
2.2.2.2 Supply chain management
Supply chain management refers to managing multiple relations between various business entities (Cooper et al., 1997). According to Cooper et al. (1997), SCM is “the integration of key business processes from end user through original suppliers that provides products, services and information that add value for customers and other stakeholders” (p.1). Similar definitions for SCM are suggested by Enarsson (2006) and Lambert (2008). Efficiency and effectiveness management of the supply chain improves value for the customer (Lee & Billington, 1992) and results in the company achieving a sustainable competitive advantage (Ellinger, 2000).
are possible increases in both market share and sales (Fergueson, as cited in Shepherd & Günter, 2011).
All of these advantages of the supply chain can be measured by supply chain performance, which provides an understanding of how the supply chain works, how the chain can be influenced the and how to improve its performance (Chen & Paulraj, 2004; Shepherd & Günter, 2011; Wisner et al., 2015). While performance measurement is widely discussed in the literature, it is rarely defined. Neely, Gregory and Platts (2005) therefore propose defining it as “the process of quantifying the efficiency and effectiveness of action” (p.1229). The research of Shepherd and Günter (2011) highlights well-known performance measurement models, such as the performance measurement matrix (Keegan, Eiler, & Jones, 1989) and the balanced scorecard (Kaplan & Norton, 2010). The authors criticise these different models and share their own analyses. Examples of the limitations they identify are failing to answer a fundamental question about what competitors are actually doing, the lack of strategic focus and encouraging short-termism (Alsyouf, 2006; Neely et al., 2005; Shepherd & Günter, 2011). Furthermore, the balanced scorecard has not integrated the extended value chain (Alsyouf, 2006). Different authors and studies have confirmed these notable limitations and therefore suggest the need for new methods to measure supply chain performance (Shepherd & Günter, 2011).
The limitations revealed by Neely et al. (2005), Alsyouf (2006) and discussed by Shepherd and Günter (2011), Chen and Paulraj (2004) add up to supply chain performance have a limited focus. Different authors have tried to develop balanced performance
measurement systems over time. The Supply Chain Operations Reference (SCOR) developed by the Supply Chain Council (SCC) in 1996 has emerged as the most popular (Huan, Sheoran, & Wang, 2004; Shepherd & Günter, 2011; Wisner et al., 2015).
2.2.2.3 SCOR model
Unless stated otherwise, this section is based on Huan et al. (2004); the SCC, as cited in Lambert, García-Dastugue and Croxton (2005); the SCC (2010); Shepherd and Günter (2011); Agami (2012); and Wisner et al. (2015).
The SCOR model, which is schematically illustrated in figure 2.2, is a cross-functional framework that spans all customer interactions, physical material transactions and market interactions. Several authors recognise that while the model does not describe every activity or business process specifically, it does focus on three process levels. Furthermore, if an organisation wants to apply the model, it must undertake improvement extension (level 4).
Three techniques integrated into one approach
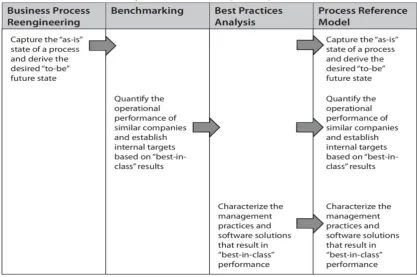
The SCOR model is a cross-functional framework that is orientated around three core components of a business process (table 2.1), each of which captures in detail the as-is state of a process and analyses the desired to-be state. The three components are as follows:
Process reengineering: Process reengineering techniques are used to analyse the current state of a process and compare it with the to-be state. Business process templates for plan, source make, deliver and return are useful for determining the to-be state.
Benchmarking: Target values for operation performance metrics are used to determine the to-be state of the process.
[image:29.595.106.524.298.575.2] Best practices analysis: This entails identifying successful management practices and software solutions that are similar to those that top-performing companies have implemented. A best practices analysis is a roadmap for implementation to achieve the to-be state.
Table 2.1: Cross-functional business process reference model (SCC, 2010)
The SCOR performances
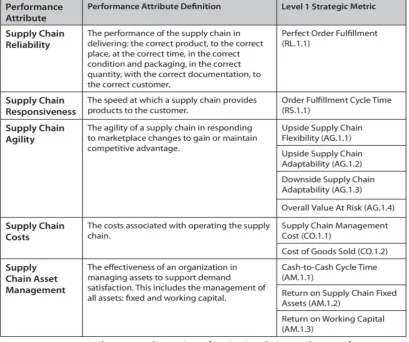
The performance section of SCOR is an important part of the model. The standard metrics that are used to describe process performance are defined, as are the strategic goals. As noted before, the as-is state of a company must be captured first. Depending on the depth of the analysis, process elements, categories and types are then compared with the best-in-class competitors (which is also called benchmarking). The SCOR model uses two types of elements to assess performance: performance attributes and metrics (see appendix 2). Performance attributes themselves cannot be measured; they only express a strategy direction and are actually a group of metrics. The model is based on five attributes that are divided into two groups (see table 2.2): customer focused and internal driven. While
Level I strategic metrics are associated with the performance attributes and measure the ability of a supply chain to achieve the chosen performance attributes (table 2.2), while level II performance metrics can explain improvements or gaps in level I on a more detailed manner. Level III explains the level II metrics by in depth defining the performance metrics. The metrics are coded according to the performance attributes, where RL indicates reliability, RS is responsiveness, AG is agility, CO is costs and AM is asset management. A number is added to indicate the level, which is followed by a unique identifier. For instance, RL.1.1 represents “perfect order fulfilment” and is a level I metric within the reliability performance attribute, while RS.3.17 is a level III metric for responsiveness that explains the level II metrics (delivery retail cycle time, coded as RS.2.4).
[image:30.595.107.517.245.587.2]
Table 2.2: Performance attributes with definitions and metrics (SCC, 2010)
A company can precisely measure how it is performing in relation to these performance attributes. Comparing its performance with the best-in-class firm and looking at different metrics also enables it to analyse gaps and identify possible improvements.
The five management processes
Now that the performance section of the SCOR has been clarified, its process section can be explained. The process section contains pre-defined descriptions for business activities that most companies undertake. This model is actually a strategic planning tool that companies commonly use to simplify the complexity of SCM. By integrating the process of supplier delivery with the buyer’s source, links in the supply chain are arises (figure 2.2). The overall process can be separated into five standard building blocks:
source-make-deliver and return) and sits on top of the supply chain. Within the planning process, resources are aligned in order to fulfil delivery.
Source: This is the processing of acquiring materials, goods and services in order to fulfil planned and actual demand.
Make: This involves transforming sourced materials, goods and services into a finished state in order to fulfil planned and actual demand. The process can be categorized as MTS, make-to-order (MTO) or ETO.
Deliver: This entails providing the finished materials, goods or services to fulfil planned and actual demand. It includes order, transportation and distribution management for the product processed in the “make” step.
Return: This final stage involves receiving products that customers return or returning materials to a supplier for a variety of reasons (such as defects or replacement goods). Return is linked to customer satisfaction.
The three product types
As noted above, the SCC incorporated different classifications into the SCOR model to facilitate a systematic approach to its use. The model defines three categories, which are then used within the five process categories.
Stocked product: In this inventory-driven process, products are made before a customer order arrives and are thus already available before they are requested.
MTO: In this process, which is customer order driven, products are made for a specific customer order. Alternatives to MTO are build-to-order (BTO), assemble-to-order (ATO) and configure-to-assemble-to-order (CTO).
ETO: In this customer requirement-driven process, products are specially designed and manufactured based on the requirements of a specific customer. An alternative ETO is design-to-order (DTO).
The three levels of analysis and one implementation level
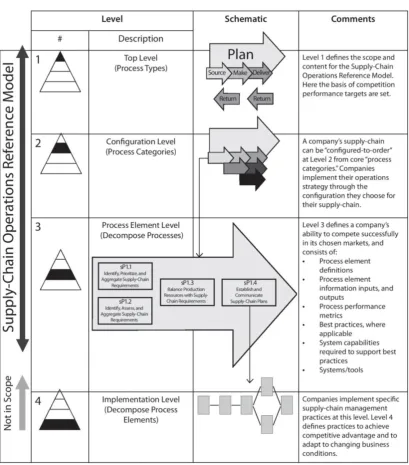
The SCOR model contains four standardised levels of process details that become
successively more detailed (figure 2.3, see next page). Each of these standard building blocks is implemented in four levels of details. Levels II and III are more supporting metrics for level I.
Level I: This top level deals with the appropriate process categories. The scope and content for the supply chain are selected based on competition performance attributes.
Level II: The second level is also known as the configuration level and describes process types with process categories. The execution and planning processes are defined as material flows. In this level companies implement their operation strategy.
Level III: This lowest level of the analysis within the scope of the SCOR model is the process element level. The inputs, outputs and process flows are defined with
specific tasks for the process categories that are formulated in level II. Simply put, the ability of firm to successful compete in the defined markets is measured. Process elements are defined with the information inputs and outputs. Specific performance measures and best practices can also be identified within this level.
Figure 2.3: Overview of the four different levels of the SCOR model (SCC, 2010)
It is clear that the SCOR model uses characteristics that other authors have used in their models. According to Olhager (2010), this model is relevant to the CODP. Efficient upstream operations are applicable for the CODP, while market-responsive studies can be used for downstream operations. Furthermore, different process types are possible in level II
depending on the influence of CODP. Other authors suggest to combine the SCOR model and the CODP. The CODP influences the execution process, regardless of if it is MTO or MTS (Immawan, ., Arkeman, & Maulana, 2015; Persson & Araldi, 2009). The CODP is further elaborated below.
Furthermore, E stands for enable elements, which are associated with a process element. For example, sEP stands for enable plan and sEM for enable make. These codifications fall within the first levels of SCOR (see appendix 2). The element process manages the information and relations within the planning and execution process.
Within the second level of the SCOR, a number is added to the codification used in the first level. This level indicates if the product is a stocked product (1), MTO (2) or ETO (3) in terms of source, make and deliver. For example, sS1 stands for source stocked product and sD3 for deliver ETO product. With the development of SCOR, the SCC codes the
configurations of the execution and plan process in order to ensure a structural approach. Within these configurations, related process can be analysed. For example, when companies produce to stock (sM1), it is most likely that they also deliver stocked product (sD1). In addition, when a supplier delivers stocked product, customers mostly use the source stocked product (sS1) configuration. Different processes are therefore related to each other within these configurations, although combining multiple configurations remains possible within the supply chain.
During the third-level analyses, a new number can be add to the second-level number in order to add more information. For example, sS1.4 means transfer products within the source stocked product, while sM1.4 means package in MTS. As noted before, the inputs, outputs and process flows are defined with specific tasks for the process categories that are formulated in level II. For example MTS (sM1) can thus describe several elements in this part of the execution process.
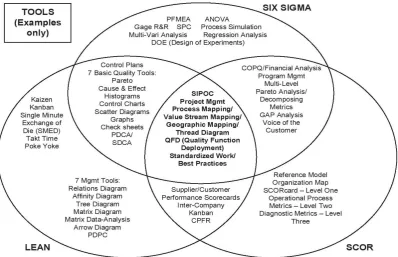
[image:33.595.113.512.505.762.2]As noted previously, SCOR serves as a standardized structural approach for evaluating supply chains in an efficient and effective way. Methodologies such as six sigma and lean management (LM) are related to SCOR, this model introduces different concepts that both of these methodologies use to eliminate waste and reduce variability. The focus of SCOR lies on transactional areas (such as customer service and sales) as well as on traditional processes. Furthermore, only SCOR can be used to measure an organisation’s business impact. Because of the relationship between the three methodologies, improvement teams will probably use all of them. As a result it is possible to conclude that similar tools can be used to serve different methodologies. A selection of these tools is presented in figure 2.4.
In addition to these tools, several authors suggest that SCOR recognise four different models in particular, namely:
Business scope diagram: A tool to set up the scope for a project or organisation.
Geographic map: A tool that highlights complexity or redundancy by describing material flows in a geographic context.
Thread diagram: A tool that can be used to describe high-level process complexity or redundancy. Its focus is specifically on process connectivity in level II and it can be classified as a material flow diagram.
Workflow or process models: These tools are especially used to analyse information, material and workflows in level III. These models highlight interaction between systems, people and information within an organisation or between entities. Within this research, the workflow or process models and the thread diagram are used in particular to gain a better understanding of the process within the company. Other tools are less important in this study, but it is helpful to keep in mind that they are useful for analysing the SCOR model. Optimisation techniques can be used to create an effective and efficient workflow. As mentioned above, LM, six sigma and SCOR may share similar tools. Which of these optimisation methodologies is used will be discussed in section 2.5.2 (optimisation techniques).
2.2.2.4 Customer order decoupling point (CODP)
It is becoming clear that SCOR can be related to other methodologies, such as LM, six sigma and the CODP. Level II of the SCOR model can be influenced by the CODP, as it is applicable for efficient upstream operations within the supply chain (Immawan et al., 2015; Persson & Araldi, 2009). Within the supply chain, success depends on the end customer. Definitions for concepts such as customer satisfaction and market requirements are crucial for a new supply chain strategy. Finding a balance between customer satisfaction and driving costs is largely difficult for an organisation. Supply chain performance tries to match supply with demand (Christopher & Towill, 2001; Olhager, 2010).
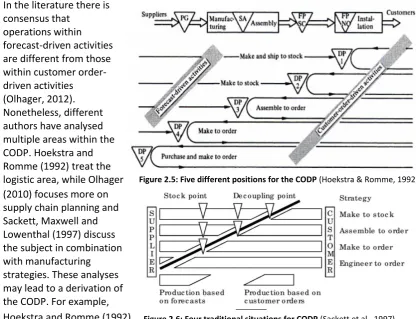
According to Martin and Towill (2000), a problem in the supply chain is that entities within it are mostly forecast driven. The real demand of the customers is only partially visible, due to the multiple levels of inventory in a chain. The CODP is a point in the supply chain that customers can reach. It is also where the market “pull” meets the upstream “push” (Martin & Towill, 2000). Hoekstra and Romme (1992) define the decoupling point as the separation between the planning part of the supply chain and the customer-order activities. At the CODP, the product is specifically tied to a customer order (Olhager, 2010).
In this respect, a distinction is drawn between the supply chain and company perspectives. Within the supply chain perspective, typically only one CODP is positioned for the whole supply chain. Within the company perspective, the CODP is positioned within the firm’s production process. However, in the latter it remains possible that the CODP is positioned more upstream (i.e., toward the supplier side) or downstream (i.e., toward the demand side) within the supply chain (Olhager, 2010, 2012).
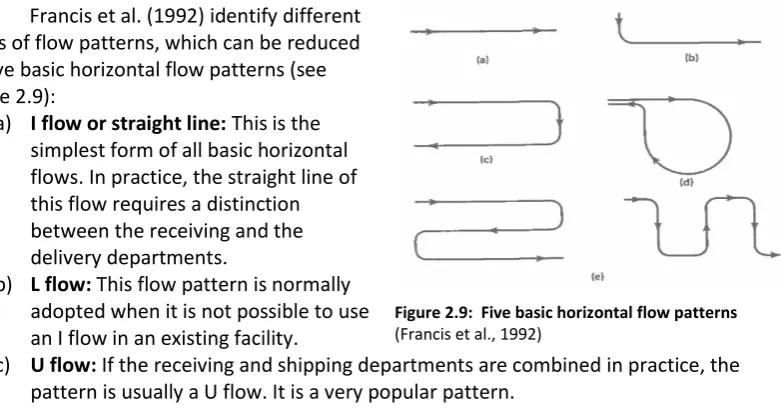
In the literature there is consensus that
operations within forecast-driven activities are different from those within customer order-driven activities (Olhager, 2012). Nonetheless, different authors have analysed multiple areas within the CODP. Hoekstra and Romme (1992) treat the logistic area, while Olhager (2010) focuses more on supply chain planning and Sackett, Maxwell and Lowenthal (1997) discuss the subject in combination with manufacturing strategies. These analyses may lead to a derivation of the CODP. For example, Hoekstra and Romme (1992)
use five different situations, while Olhager (2012) reduce the CODP to three positions. According to Wikner and Rudberg (2007), however, the traditional CODP still contains four typical situations. Different authors have characterised the traditional CODP over time, including Wortmann, Muntslag and Timmermans (1997); Sackett et al. (1997); Porter, Little, Peck and Rollins (1999); Wikner and Rudberg (2007); and Stadtler and Kilger (2015). As shown in figure 2.6, the typology of the traditional CODP defines the following situations:
MTS: The demand and production in this manufacturing process is based on forecasts; it is also called PLAN (see the SCOR model). As customers have a limited influence, the product is available before it is requested.
ATO: Components of the product are manufactured based on a forecast and are mostly temporarily stored in a warehouse as a buffer to decrease lead times. Customers have more influence on the product as it is configured to a range of available specifications. Lead times depend on the availability of the components.
MTO: Manufacturing begins after a customer order is receive, although only raw materials must be purchased given that customers order standard products.
[image:35.595.103.520.87.406.2] ETO: This manufacturing process includes standard products; modifications and customisation are only possible upon request. This process is thus customer order driven and customers have a high degree of influence on the manufactured product (Porter et al., 1999; SCC, 2010).
Figure 2.5: Five different positions for the CODP (Hoekstra & Romme, 1992)
There is a difference between inventory-driven and order-driven production. The turning point is influenced by the CODP. A balance needs to be found between stock holding and customer responsiveness. The relationship between the four possible positions, production volume and the amount of stocks held can be found in figure 2.7. According to Berry and Hill as cited in Olhager (2012), an MTS approach should be followed for standard products with high volume per period, while an MTO approach should be used for special products with low volumes. Srivastava, Shervani and Fahey (1999)
also note that products should follow a modular design when a company uses an MTO strategy.
According to Porter et al. (1999), in practice production processes in manufacturing firms do not fit just into one specific class. Processes could cross the boundaries of the theoretical descriptions and thus reflect a combination of multiple positions (Porter et al., 1999; Wikner & Rudberg, 2007).
2.2.2.5 Core competency of the firm
As global competition grows, manufacturing industries in Europe are fighting to leave their competitors behind (Jovane, Westkämper, & Williams, 2008). Defining a company’s core competency could help it to create long-term competitive advantages (Chase et al., 2005). Nevertheless, the structure of manufacturing has changed in recent years, and operations are more concentrated on niches and customisation in order to create higher profitability. Products have become customer-specific and variants are increasing as a result. The
complexity of the products is also increasing, as are product development costs (Jiao, Ma, & Tseng, 2003; Jovane et al., 2008). Highly skilled workers employed by European
manufacturing firms have a great influence in these structural changes. Nonetheless, transforming to customised production remains a challenge for most manufacturing firms (Jovane et al., 2008).
The key to success within the global competitive market is to design and make high quality products that are manufactured at minimum costs and in a short time frame (Jiao et al., 2003). Jiao et al. suggest that OEM-based industries can generate premium revenues by customising high value-added products and services. However, a balance needs to be found between customer satisfaction and cost savings. This could be accomplished through design for mass customization (DFMC), which entails basing product design on product families and not on individual products. The result would be that products are not developed from scratch for each individual but that several product variants are created (Jiao et al., 2003). Firms also need to break through traditional boundaries, and support from different departments (e.g., marketing, sales, distribution and services) is necessary to apply mass customisation (Jiao et al., 2003). The product, the process and the supply chain network should be designed in a module manner in order to create effective mass customisation (Chase et al., 2005). As the structure of manufacturing has changed over time, a trend to outsource activities that were previously done in-house has developed. Today the main focus of companies is their core activities (McIvor & Humphreys, 2004). As such a fundamental question for a company’s strategy arises: the company needs to decide what it will make and what it will buy, which is the so-called the make vs. buy (MvB) decision. This question is traditionally answered by financial criteria (e.g., if a supplier can produce a component with the same quality against lower costs) (Platts, Probert, & Cáñez, 2002). Non-financial factors
influence the MvB as well. According to Tallman and Fladmoe-Lindquist (2002), these non-financial factors are called the capability perspective. Unique internal resources and
capabilities and the ability to apply them can also result in competitive advantage (Tallman & Fladmoe-Lindquist, 2002).
As previously mentioned, it is important that a firm defines its competency in order to differentiate itself from its competitors. In this connection, Treacy and Wiersema (1997) discuss three value disciplines that a company could choose as a strategy (Chase et al., 2005; Treacy & Wiersema, 1997):
Operational excellence: When this strategy is chosen, a company focuses on a combination of quality, price and ease of purchase for its customers that none of its competitors can match. Examples of companies that focus on operational excellence are Dell Computers and McDonald’s.
Product leadership: When a company focuses on product leadership, it pushes its products into the unknown. These designs are usually untried before and become highly desirable for the customers. Intel and Sony are examples of companies that use these strategies.
Customer intimacy: A company that focuses on customer intimacy tries to create a relationship with individual customers. It knows what the customers want and who they are.
Nowadays researchers have added another strategy to the traditional three strategies, customer experience management. This approach is a process-oriented satisfaction idea and measures the entire experience concerning a product or a company (Schmitt, 2010). In summary, a company chooses its own core competency in order to achieve competitive advantage. As each value discipline demands different operating processes, the company needs to answer the MvB question in order to stay on track.
2.2.3 Schedule design
Within schedule design, a firm needs to have a strategy in relation to the market forecast, production demand and production rate. This strategy depends on the product marketing mix and the required production rate. Schedule design still influences the layout, as it affects both machinery occupancy and the production schedule (Francis et al., 1992). The
aforementioned strategy needs to be monitored by the firm. This includes monitoring daily activities and aligning them with strategic objectives, both of which can be done using performance measurement tools.
Parmenter (2010), Cox, Issa and Ahrens (2003) define similar definitions for KPIs are a performance measurement tool created for an organisation (Chae, 2009). According to Parmenter (2010), there are four types of performance measurement:
Key result indicators, which tell how a firm has done something and are a result of many actions. As such they give information about the direction in which things are moving, but not on how to improve the results. Examples of KRIs include net profit before tax, return on capital employed and customer satisfaction.
Performance indicators tell a firm what to do. They align teams within an organisation and ally them with the organisation’s strategy. It is important to understand that PIs are nonfinancial and complement KPIs. Examples include late deliveries to key customers, sales calls organised for the coming weeks and the number of employees suggestions implemented in a quarter.
KPIs tell a firm what to do in order to dramatically increase performance.
In a practical side note, Parmenter (2010) observes that many of the performance measures that are applied in enterprises reflect a mix of the four types (which he believes is
inappropriate).
As noted before, an organisation can measure both itself and the complete supply chain. Using these performance measurements reveals how the supply chain works, how the organisation can influence the chain and how it can improve the chains performances (Chen & Paulraj, 2004; Shepherd & Günter, 2011; Wisner et al., 2015). Chen and Paulraj (2004) divide supply chain performance into financial, operational and time-based performance, which is reiterated by Wisner, Tan and Leong (2015). Economic performance indicators are useful for measuring the fulfilment of a firm’s financial goals, and factors that influence financial measurement are more likely orientated outside of the company. In contrast, operational performance reflects the effectiveness and efficiency of a company’s process. It includes quality, flexibility, delivery speed and cost. Examples of time-based performance are lead-time, delivery speed, product development and customer responsiveness.
Performance measurement can vary between departments within an entity. Table 2.3 shows typical function-based
measurements and related goals for the relevant departments. A disadvantage of pure function-based measurement could be that individuals tend to improve their own department performance, which results in conflicts with organisational goals (Lapide, 2000). Co-operation is thus necessary between departments as well as between organisations in the supply chain. As such the focus of supply chain
performance lies on the
integrated supply chain instead of individual supply chain entities (Chen & Paulraj, 2004).
While the SCOR model also includes a performance section, it does not offer a way in which to measure performance attributes. It instead sets a strategy direction for the
company using five represented attributes (see table 2.2) (Huan et al., 2004; Lambert et al., 2005; SCC, 2010; Shepherd & Günter, 2011; Wisner et al., 2015). Chae (2009) also discusses potential KPIs for the four processes within the SCOR model. A distinction is only drawn between primary and secondary KPIs (see figure 2.8).
Table 2.3: Typical function-based measurements and related goals