A Thesis Submitted for the Degree of EngD at the University of Warwick
http://go.warwick.ac.uk/wrap/36740
This thesis is made available online and is protected by original copyright. Please scroll down to view the document itself.
S
IMULATION
S
EBASTIANO
D. G
IUDICE
I
NNOVATION
R
EPORT
T
HE
U
NIVERSITY
O
F
W
ARWICK
S
CHOOL OF
E
NGINEERING
WMG
Abstract
Sound Quality engineering (SQE) is a discipline that should be embedded within Noise Vibration and Harshness (NVH) engineering. Its purpose is to tailor and enhance a vehicle’s sound in order for it to meet and / or exceed the customers’ expectations of the car and of the brand. NVH engineers need to use the opinions of customers, key decision makers in the organisation and those of their colleagues to set objective NVH targets for new vehicles. Their opinions are captured through jury evaluations.
Interactive simulation is a new approach to presenting sounds to a jury. It enables assessors to evaluate existing and concept cars generated in real time and before the manufacture of physical prototypes. This document summarises the research carried out for the EngD research programme. Its aim was to develop methodological approaches for setting up evaluations using interactive simulation, optimise its data capture and analysis capabilities and provide insight, to NVH engineers, into how assessors evaluate sound quality.
The first stage of the research involved benchmarking how the interactive simulation tool was being used by its developers, and how NVH targets are set within an OEM. This provided the foundation upon which to build the new methodology. The benchmark was compared against methodological approaches used in experimental psychology and in other sensory perception practices. This identified that principles for the design of evaluations had not been considered and appropriate statistical analysis techniques were not being implemented. Therefore it was not possible to ensure if the differences observed in the results were significant or not. It also became apparent that as each assessor was free to drive vehicles however they wished, the NVH engineers would not be able to link the assessor’s subjective impressions with the acoustical stimuli used to form an opinion. This was due to the lack of observational methods that could be applied. In addition, the use of this form of interactivity was novel compared to the approaches available before the introduction of the simulation. Therefore it was not yet understood how it could influence the outcome of the evaluations.
An iterative approach was adopted to develop both tools and methods. Following the benchmarking stages, experimental design principles were implemented and a structured briefing method was formulated for the first time. These contributed to the overall methodologies and were also used to ensure the studies conducted as part of this research programme were free from experimental biases. This stage was followed by identifying a statistical analysis framework which can be used to study the assessors’ subjective impressions. These contributions enable the NVH engineer to understand if the differences observed between sounds are significant or not.
The next phase was to understand how to best capture subjective opinions. Recommendations for this were based on the purpose of the evaluation. For the benchmarking stages of the NVH target setting process, many cars are often evaluated and therefore the duration of the evaluation can be a concern. However, the desired level of accuracy of the results is not as high as it is for the validations stages, upon which key engineering decisions are based, and also fewer cars are evaluated. Taken together it was possible to recommend the use of scaled interfaces for the benchmarking stages and the paired comparison method for the validation stages. The former takes less time to complete than the latter, which is however more accurate. The data capture capabilities were further enhanced through the development of a driver observation module; this enabled the assessor’s assessment strategies to be recorded. The data collected provided insight into how assessors drove with the aid of new visualisation and analysis techniques developed.
Given the availability of these new methods and tools it was then possible to use the simulator to observe the influence of interactivity on the outcome of the evaluation. This demonstrated that assessment strategies can vary depending on the question asked to the assessor. The study indicated that assessors associated the refinement character of a car with driving conditions other than those presented to them in traditional evaluations.
Acknowledgement.
I would like to thank a number of people for the help and support that they have given me throughout the EngD programme.
First of all I would like to thank WMG for providing me with the opportunity to be part of this research programme. I would like to thank in particular my mentor Professor Paul Jennings, for his guidance and encouragement, Dr Andy McGordon for taking the time to review my work and Mr Diego Sánchez-Repila, for his support in developing the tools presented in this document. I also would like to acknowledge the UK Engineering and Physical Sciences Research Council for supporting the research through the Warwick Innovative Manufacturing Research Centre and the EngD programme.
I would like to thank Mr Roger Williams, and Mr Mark Allman-ward from Sound Evaluations Ltd, for their continual involvement in the research. Without them I would have not been able to complete the doctorate. I would also like to thank Dr Garry Dunne from J&LR for providing much needed insight into the processes implemented within their NVH team.
Declaration
I confirm that the work contained in this document is my own unless otherwise stated
Contents Page
1. Introduction to the Innovation Report ...9
1.2. Aims...10
1.3. The approach ...11
1.4. The EngD Portfolio...11
1.5. Structure of this Innovation Report ...15
2. Sound Quality Engineering...16
2.1. Sound Quality ...16
2.2. Sound Quality Engineering...19
2.3. NVH Target Setting...20
2.4. Target Sound Generation...22
2.5. Jury Evaluations...25
2.5.1. Paired Comparison ...25
2.5.2. Rank Order ...26
2.5.3. Rating Scales ...26
2.5.4. Semantic Differential...26
2.5.5. Magnitude Estimation ...26
2.5.6. Interviews ...27
2.6. Evaluation Environments ...27
2.7. Interactive NVH Simulation...29
2.7.1. Other simulators...32
2.7.2. Validation of Interactive NVH simulators. ...33
2.7.3. Target setting using interactive NVH simulation...34
2.7.4. Methodologies for interactive simulations. ...35
3. How People Make Decisions ...40
3.1. Introduction ...40
3.2. Decision Making...40
3.3. Decision making in jury evaluations...41
3.4. Research areas...42
4. Assessors’ Perception of Sound Quality Evaluations using Interactive Simulation. 45 4.1. Introduction. ...45
4.2. Assessor engagement. ...45
4.2.1. Briefing: ...46
4.2.2. Equipment set-up: sensitivity adjustments...46
4.2.4. Perception: Willingness to return for future evaluations ...49
4.3. Summary ...49
5. Experimental Procedures for Sound Quality Evaluations in the Interactive NVH Simulator ...51
5.1. Introduction ...51
5.2. Experimental design...51
5.3. Data capture methods for interactive simulation ...52
5.4. Classification of the IS method ...52
5.5. Data analysis methods ...53
5.5.1. Level of data...53
5.5.2. Normality ...55
5.5.3. Statistical Analysis Framework...55
5.7. Qualifiers...59
5.7.1. Numerical outputs ...59
5.7.2. Independent measurement per verbal descriptor...60
5.7.3. Relative assessment...60
5.7.4. Verbal descriptors ...60
5.8. Differentiators...60
5.8.1. interactivity: “Listen Again” Function ...60
5.8.2. Accuracy ...61
5.8.3. Duration ...61
5.8.4. Ease of choice (from the assessors’ perspective) ...61
5.9. Using the criteria...61
5.10. Methodology ...63
5.11. Results...63
5.11.1. Number of reshuffles ...63
5.11.2. Range of scores ...64
5.11.3. Duration ...65
5.11.4. Accuracy ...65
6. Influence and Exploitation of Interactivity in Sound Quality Evaluations...68
6.1. Interactivity...68
6.2. Stimuli. ...69
6.3. Capturing Driver Behaviour ...71
6.3.1. Driver Observation Module ...73
6.3.2.1. Engine speed vs. Road speed...76
6.3.2.2. Acceleration vs. Time...77
6.3.2.3. Overlapping ...77
6.3.2.4. Data Separation...78
6.3.2.5. Cutting...78
6.3.2.6. Overlapping ...78
6.3.2.7. Display...78
6.3.2.8. Overlapping approach...79
6.3.3. Interpreting the results ...81
6.5. Influence of interactivity on Sound Quality evaluations. ...83
6.6. New data for decision making...86
6.7. Summary of Chapter...89
7. Discussion & Recommendations...90
7.1. Discussion ...90
7.1.1. How do assessors engage and perceive the simulator and the task? ...91
7.1.2. How to design experiments...91
7.1.3. How to select data capture methods...93
7.1.4. How to analyse the data collected ...94
7.1.5. How to capture the way people make decisions ...94
7.1.6. How it could be used to enhance the target setting processes...96
7.1.7. What is the influence of interactivity?...96
7.2. The Guidelines...96
8. Future Work... 101
9. Conclusions... 103
10. Appendix A: Accuracy testing for data capture methods... 106
11. Appendix B: Driver Behaviour Insights... 107
12. Appendix C: Dissemination of the Research ... 109
List of Figures
Figure 1: How to read the EngD portfolio ... 14
Figure 2: The value of sound quality (Dunne 2003) ... 18
Figure 3: Target setting processes at J&LR ... 21
Figure 4: Setting NVH targets on subjective data... 23
Figure 5: WMG listening room... 28
Figure 6: Exterior of WMG's interactive NVH simulator ... 29
Figure 7: Interior of WMG's interactive NVH simulator ... 30
Figure 8: Desktop simulator ... 30
Figure 9: Control of the interactive NVH simulator ... 31
Figure 10: Decomposition process... 32
Figure 11: Simulation period within the vehicle development programme ... 34
Figure 12: Potential concept generation process... 35
Figure 13: Interactive scaling method ... 36
Figure 14: Original methodology... 37
Figure 15: Target setting processes proposed by Schulte-Fortkamp (2007) ... 38
Figure 16: Decision making model proposed by Wickens (1999) ... 41
Figure 17: Decision making model proposed by Zeitler (2006)... 42
Figure 18: Research questions... 44
Figure 19: How assessors can be distracted ... 46
Figure 20: Comfort and involvement in simulator-based evaluations ... 48
Figure 21: preference of evaluation... 49
Figure 22: Win - Lose graphs ... 55
Figure 23: Data analysis methods for IS method ... 58
Figure 24: Absolute and relative assessments ... 63
Figure 25: Number of times the reshuffle button is pressed... 64
Figure 26: Scale range used... 64
Figure 27: Experiment duration... 65
Figure 28: Typical observation log from one evaluation... 72
Figure 29: Theoretical decision making model of simulator based evaluations... 72
Figure 30: Driver Observation Module (DOM)... 74
Figure 31: Speed time profile with interactions. Powerfulness and refinement. ... 75
Figure 32: RPM vs. Speed... 76
Figure 33: Acceleration vs. Speed... 77
Figure 35: Phase shift with two events ... 80
Figure 36: Example of overlapping: Tip-in ... 81
Figure 37 shows a different strategy, this is an attempt at cruising with some of the elements of the tip in manoeuvre. ... 81
Figure 38: Example of overlapping: cruise... 81
Figure 39: Visualisation tools for driver behaviour... 82
Figure 40: Assessment of refinement... 85
Figure 41: Win - lose graph for powerfulness, segmenting driving style... 87
Figure 42: Win - lose graph for powerfulness, segmenting driving style... 87
Figure 44: Process to capture drive cycles... 107
List of Tables Table 1: Components which can be altered to manipulate sound... 20
Table 2: First assessment of data capture interfaces using the criteria... 59
Table 2: First assessment of data capture interfaces using the criteria... 62
Table 4: Significant differences for Powerfulness ... 106
Table 5: Significant differences for Refinement ... 106
Abbreviations and Acronyms
2GWOT: 2nd Gear Wide Open Throttle
DOM: Driver Observation Module
EngD: Engineering Doctorate
J&LR: Jaguar LandRover
NVH: Noise Vibration Harshness
SQE: Sound Quality Engineering
1. I
NTRODUCTION TO THEI
NNOVATIONR
EPORT1.1. Introduction
The purpose of this document is to summarise the key findings of a research programme carried out as part of an Engineering Doctorate (EngD) at the University of Warwick. The research focused on the development of methodological approaches for sound quality evaluations using interactive simulation.
Within the automotive industry, Sound Quality Engineering (SQE) is the discipline of tailoring and enhancing a vehicle’s sound in order to communicate and reinforce brand qualities. It requires the capture of subjective opinions, through evaluations, in order to set objective Noise Vibration and Harshness (NVH) targets for use within the vehicle development programme. Conventional subjective evaluation approaches include the assessment of sound in laboratory-style environments known as listening rooms, or by evaluating vehicles on-road.
Within a listening room, the sound of vehicles is represented by predetermined driving
conditions. For the Jaguar brand, the sound of vehicles at 2ndGear Wide Open Throttle
(2GWOT) was assessed. The sounds are recordings of existing vehicles but the acoustic properties of concept vehicles can be simulated by applying filters. This approach is therefore suited for understanding which acoustic features influence perception without building physical prototypes. The evaluation is structured, and therefore the test conditions are repeatable for all assessors. A limitation however, is that assessors cannot choose the driving conditions to evaluate. Furthermore, from an engineering perspective, resolution of issues at this full load does not imply equivalent resolution at part load conditions.
During on-road evaluations, assessors can evaluate any driving conditions. However to evaluate concept vehicles, a physical prototype has to be designed and built. If at this stage, the acoustic character of the vehicle is not appropriate, then engineering changes have to take place, leading to delays in the vehicle development programme.
The full vehicle simulator comprises of a real vehicle fixed into positioned in front of a screen onto which the virtual environment (VE) is projected. The assessors hear the simulated sound through headphones and feel vibration through the seat, floor panel and steering wheel. They can control the perceived motion of the vehicle through the VE using the steering wheel and foot pedals within the car. For the desktop simulator, the assessor sits at a desk, in front of a PC monitor onto which the VE is displayed. They control the vehicle using the steering wheel and foot pedals typically used with computer games. They hear sound through headphones but vibration is not present.
This new tool however required new methodologies to cater for sources of variability and optimise its use within NVH target setting processes. The purpose of the research was to propose methods for setting up and conducting subjective evaluations using interactive simulation and provide tools to interpret the new forms of data available. To achieve this, it was necessary to propose approaches that would complement and enhance Jaguar & LandRover’s (J&LR) existing NVH target setting processes. It was also necessary to take into consideration principles of experimental psychology and how the assessor perceives the use of the simulation tool.
1.2.Aims
Aims for the research programme were formulated with the project partners J&LR and SVT. J&LR were interested in the inclusion of the simulator into their existing NVH target setting processes. They would need to know how to use interactive simulation in sound quality evaluations, and how to optimise the collection and use of data. SVT would also be interested in a methodology, and the development and exploitation of new opportunities for the technology underpinning the simulator. This would involve introducing new methods to capture how people evaluate sounds using the simulator. The aims were therefore as follows:
1. Propose guidelines on how to set up and conduct sound quality evaluation in the simulator.
2. Develop methods and tools which most effectively exploit interactivity in sound quality evaluations.
approach, new ways of conducting sound quality evaluations, and using the data collected, have been developed.
1.3.The approach
An iterative approach to developing a methodology for the simulator was conducted. Each stage of the research facilitated the next.
The research began by benchmarking how the simulator was being used by the developers. Through this, it became evident that a rigorous approach to setting up evaluations had not been adopted. The benchmarking stage was followed with a comparison of the original methodology against methods from experimental psychology, specifically how generic subjective evaluations should be set up and conducted. This provided the insight necessary to begin setting up the evaluations, which provided a greater understanding of how people perceive the simulator-based evaluations. This stage was followed by understanding methods to capture subjective opinions. It was then possible to use the processes identified to further research how to improve the exploitation of the interactive aspect of the simulator.
Throughout the research programme, contributions were made to the developers, who incorporated the approaches proposed into the simulation software.
To support the literature, discussions were held with psychologists, experienced NVH engineers and sound quality practitioners, from J&LR, SVT, LMS International Ltd. (a service provider of NVh simulation software) and General Motors, and also statisticians and signal processing engineers. In addition the conventional methods for sound quality evaluations were experienced. This was necessary as the literature related to interactive simulation was limited.
1.4.The EngD Portfolio
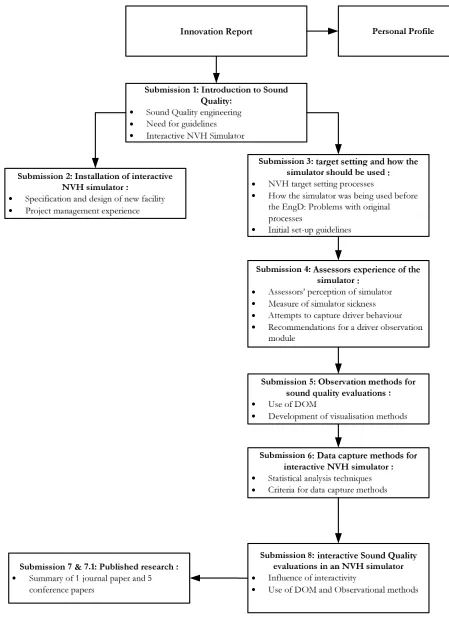
During the course of the research, 8 submissions were completed. Figure 1 summarises how to review the EngD portfolio content. The first document that should be read is submission 1, this is an introduction to sound quality, the interactive NVH simulator, and the need for best practice guidelines. Also within this submission is a review of the five research areas that needed to be addressed: The assessors, the interactivity, the context; the data capture methods and the corresponding analysis techniques.
purpose of this document is twofold. Firstly it discusses how the NVH simulator used in this research is built and what the facility looks like, and reasons for the facility’s appearance. Second it discusses the author’s personal experience of project managing this stage of the project.
Submission 2 should be followed by submission 3. Within this document, NVH target
setting processes are discussed. These were investigated, as potential guidelines had to be integrated into existing processes. Also reported, is how the simulator was being used by its developers before this research programme. In doing this, it was evident that rigorous experimental designs were not being applied, and therefore sources of experimental error were being potentially introduced. Recommendations were made to avoid these from occurring in the future.
Submission 4 is the next document to be read. This document focuses on the assessors’ perception of the evaluation experience with the simulator. A methodology for the simulator would rely on the integration of people into its processes. How they interact with the simulator, and how they perceive the experience could dictate potential technological improvements which enhance their well-being, confidence and enjoyment of the evaluation. This is important if they are to focus on the task of evaluating sounds and be willing to return for future evaluations. The outcomes of this stage of the research identified that simulator sickness, a form of nausea induced from exposure to virtual environments, was affecting 10% of assessors. Recommendations, by the authour, were made to minimise this. Also during this study, an attempt was made to observe driver behaviour, to further understand the interactive evaluation. The method implemented did not facilitate the capture of the assessors driving strategy. This prompted the development of the simulator software and development of new techniques for observational studies. These developments are discussed in submission 5, which should be read next.
Submission 6 however, is the next submission to be read. This concerns the introduction of analysis techniques for subjective impressions formed during the evaluation. These had not been previously implemented by either J&LR or SVT. These analysis techniques facilitate decisions by NVH engineers, by associating a statistical significance to the results of evaluations. The benefit of this is enhanced confidence is knowing whether or not the observed differences between sounds are due to random variation or not. This is the last submission which provides guidelines on how to design sound quality evaluations using the simulator. The research conducted up to this point enabled further investigations into interactivity. This is discussed in submission 8.
Submission 8 discusses the influence of interactivity on the outcomes of the evaluation. Here it was found that stimuli used in the traditional evaluations, did not appropriately represent the attributes assessed. The tools developed and reported in submission 5 were applied, to demonstrate how to make the most of the driver behaviour data. This document shows how the new forms of data collected which can be used to understand how people make decisions.
Submission 7 and 7.1 are the final submissions to be read. These are a summary of the published material which resulted from this research project. At the time of writing this report the author contributed to the content of 5 international conference papers and 1 journal paper. Four of the conference papers concern sound quality evaluations using interactive simulation. For the remaining conference paper the author contributed towards research into how to use lexicon data from interviews to select inputs for artificial neural networks. This was used to predict the outcomes of sound quality evaluations using a listening room. For the journal paper, the author of this report contributed towards specifying the research areas that needed to be addressed by the project.
1.5.Structure of this Innovation Report
Chapter 1 has already introduced the report and the structure of the EngD submissions. Chapter 2 is an introduction to sound quality. Here a definition for sound quality is given and its value is discussed. Sound Quality Engineering (SQE) processes are also discussed, including target setting and target sound generation. This is followed by an introduction to jury evaluation methods and evaluation environments. This includes the introduction to interactive simulation and the problems associated with the methodologies used before this research.
An integral part of the evaluation process is the human assessor. Chapter 3 explores how humans make decisions, and how traditional evaluation environments do not cater for their inherent decision making processes. The background information underpinning the topics discussed in chapters 2 and 3 was needed to identify the research areas that would need to be considered within this project. It also presents the specific research questions identified through further discussions with SVT and J&LR.
Chapter 4 presents the research concerning the assessors’ perception of the simulator and the task of assessing sound within it. Chapter 5 reviews how to set up evaluations. It provides future sound quality practitioners guidance on how to set up and run evaluations in the simulator, thus ensuring the outcome of the evaluation is free from experimental errors.
Chapter 6 reports on the research concerning influence and exploitation of the interactivity aspect of the sound quality evaluations. Shown here was a novel method to capture assessor behaviour and how to use this information to provide NVH engineers with a deeper understanding of how assessors make decisions.
Chapter 7 is the discussion of how the research conducted over the registration period has changed the way in which the simulator developed as a product and how it should be used in industry. Chapter 9 is a summary of the guidelines developed.
2. S
OUNDQ
UALITYE
NGINEERING2.1.Sound Quality
Intense competition within the automotive industry has led to manufacturers exploring many approaches to make their product more appealing to prospective customers. The design of the components that make up the car should communicate product quality and reinforce the manufacturer’s brand image. Understanding customer opinion early in the development programme and presenting this in a suitable format can guide designers, engineers and key decision makers to choose between concept designs with confidence, such that the end product will achieve the optimum impact on the customer.
The customers’ opinion of a car can be influenced by their perception of stimuli. The feel of the materials used in the cabin and the comfort of the seat are only a few of the aspects of a car which can contribute towards an overall feel of product quality.
sound quality is the area which focuses on how the vehicle’s interior sound is perceived by the customer. Sound can communicate functional states and give an indication of the vehicle’s health. It can also be used to strengthen positive aspects of the driving experience.
Historically, manufacturers have focused on lowering noise levels within the cabin. If the noise was sufficiently low, it may have been perceived as a sign of good build quality. Today however, the emphasis is not only on the removal of noise, but it is also focused designing sound to create a positive emotional response. Taken together, the emphasis of NVH engineering has shifted from being objectively led to focusing on subjectivity (Repik 2003).
Sound quality engineering can therefore be defined as the process of tailoring and enhancing a product’s acoustic character, to support the customers’ perception of overall product quality.
luxuriousness will take priority. The aim for the Jaguar brand is to achieve a sound with dual characteristics consisting of both a powerful and refined character (Dunne 2003). An understanding of the value of sound quality has been gathered from automotive journalism, manufacturers’ opinion, and consumer psychology.
It is rare to see car reviews of luxury saloons and sports cars which do not describe the sound of the car. As part of this research, car reviews written by journalists were monitored to see how many of them discussed the sound of a vehicle. This was done to gauge how important the sound of a car is from the media’s perspective. This was conducted as the author believed that media can influence purchasing decisions. Out of a sample of 18 car reviews, a description of the vehicle’s sound was not discussed in only 3 articles. It was also, however, deduced that the degree of importance of the sound depended on the car. For example, the sound of a sports car was considered more important than that of a hatchback.
Harley Davidson is a company whose products have a strong association with their sound. The aim of its product design process is to achieve the “Harley Sound” (Pierson 2003). They claim that customers are attracted to its motorcycles because of the perceptual feelings they experience whilst riding the bike, specifically how it looks and sounds. In this case, the “Harley Sound” differentiates its brand from others, so much so, the company believed it was worthy of a patent, which it applied for, but was not granted (New York Times 1995).
Within the automotive industry, Afeneh et al (2007) acknowledge that NVH attributes are not the main concern within the vehicle development programme. The attributes such as styling, safety and reliability are often the top priority. Usually NVH attributes are within the top 5, but this will depend on the type of vehicle. Hutchins et al (1992) from Lotus noted the effect of not matching the sound character to the vehicle. He implied that drivers’ behaviour can be influenced by the sound, and they would avoid driving naturally to avoid the acoustic features they do not like.
and vibration. Decreasing these levels proportionally increases the level of customer satisfaction. However higher levels of customer satisfaction can be achieved with lower levels of noise isolation, if the sound has certain delighting qualities. That is if the sound is contributing to the customers’ excitement during the use of their product. This type of quality is illustrated by the “excitement quality” line shown in figure 2. Dunne states that both the excitement quality and the spoken performance quality are achieved through the Sound Quality engineering process.
Degree of Achievement Customer Satisfaction
Spoken Performance (delivery of NVH through
noise isolation)
Basic Quality (Basic NVH performance) Excitement Quality
(Delivery of NVH performance through
[image:20.595.159.436.228.431.2]sound quality)
Figure 2: The Kano value of sound quality (Dunne 2003)
Manufacturers also try to draw the customers’ attention through the media to the fact the sound has been engineered. When BMW launched the Z4, its adverts deliberately made reference to the engineering behind the sound of their vehicles. Freeman (2003) stated that BMW purposely engineered the sound depending on the type of the vehicle. It stated that if the vehicle was a luxury saloon the emphasis was on delivering noise and vibration isolation. On the other hand, if the vehicle was a sports vehicle, such as the Z4, then it would purposely increase the interior sound to enhance the enjoyment of the drive.
Researchers such as Schifferstein (2005) (2006) have shown how the importance of a product’s sound is related to the products function. For products such as cars, vacuum cleaner and televisions, where the sound is a result of the products’ function, the sound was considered highly important by users.
state-of-the-art simulation tools. The intention in this work is to support engineers who are largely accustomed to dealing with objective measures. In the same way as an artist’s concept designs are turned into engineering drawings, these subjective impressions need to be used to set engineering targets.
2.2.Sound Quality Engineering
SQE is the process of delivering the vehicle’s defined acoustic character. It is a discipline that needs to be embedded within the practice of Noise, Vibration and Harshness engineering (NVH), which as the terms imply, deals with those aspects of the vehicle. Typically the main concerns for NVH engineers are powertrain NVH sound quality, road NVH and wind noise. Other considerations include “operational sound quality” which concerns aspects such as seat belt and door closing sounds, seat motors and wind screen wipers. Also squeaks and rattles, which are considered error states, are also included in this. In addition, pass-by noise legislation needs to be accounted for.
Source Engine Road Exhaust Intake Aerodynamic Noise
Structure Borne Airborne
Engine mounts
Engine vibrations
Firewall / floor absorption material
Firewall / floor
Absorption material under bonnet
Tyres
Suspension bushes
Subframe bushes
Firewall / floor absorption material
Firewall / floor
Door seals Exhaust mounts
Floor absorption material Coupling between catalyst and rest of
exhaust
Absorption material under bonnet
Door seals
Filter box and snorkel mounts Firewall / Floor
Door seals Absorption material under bonnet
[image:22.595.157.442.65.335.2]Shape of the vehicle Door seals Engine components
Table 1: Components which can be altered to manipulate sound (Harrison 2004)
Other approaches to modify the sound of the car can include Active Noise Control (ANC). By emitting sound from the vehicle’s speakers it is possible to cancel out or enhance particular sound characteristics. Traditionally J&LR considered ANC not appropriate for their product. They felt that customers of the Jaguar brand would consider this a deception of the product quality. However recently they have started using mechanical components that actively enhance the acoustic properties of the vehicle. These may have no impact on the performance of the vehicle. For example, on the latest XK, an intake feedback system is fitted, otherwise known as a bark tube. This device helps tune the sound of the car from the driver’s perspective. It is a tube which runs from the intake manifold to behind the dashboard. Air pressure from the tube vibrates a small diaphragm piping engine sound into the cabin.
2.3.NVH Target Setting
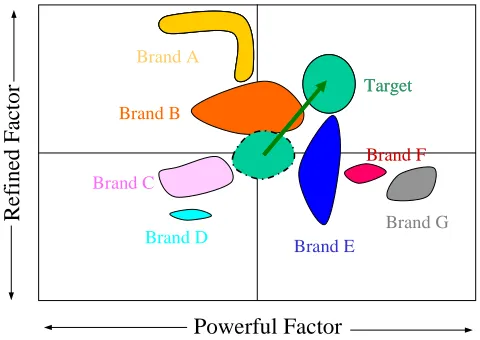
engineering requirements and the opinions of customers, engineers and key decision makers within the organisation. (Afaneh 2007). However poor decisions at this stage can be expensive to amend once a prototype has been manufactured. To avoid these, processes to achieve the target sound have been developed. A visual tool used for the Jaguar brand, is a 2D map shown in figure 3 (Dunne 2003). Here the horizontal axis displays a measure of the subjective achievement of the “powerful” character of vehicles’ sound. The vertical axis displays a measure of the subjective achievement of “refined” character. Powerfulness and refinement are the two verbal descriptors which represent the Jaguar brand during subjective sound appraisals.
The 2D map was constructed using results from a paired comparison evaluation in which 24 vehicles were assessed. The merit scores (see submission 1) were used as a measure for the position of the vehicles on the map.
Brand D
Brand F
Brand G
Brand E
Brand B
Brand C Brand A
Target Target
Powerful Factor
R
e
fi
n
ed
F
ac
to
[image:23.595.180.420.326.496.2]r
Figure 3: Target setting processes at J&LR
Dunne (2003) found it interesting that individual cars from each brand form clusters. However it is important to note the positions of the vehicles are relative not absolute. That means that if the group of brands used in the evaluation were different, it would result in different locations for each of the brands.
on understanding the compromises between other vehicle attributes such as handling and performance.
The descriptors powerfulness and refinement were identified using principal component analysis (PCA). Other sound quality practitioners use different descriptors, but with a similar meaning. Bisping (1995) for example identified the descriptors “power” and “pleasantness”. Terazawa et al (2000) identified the descriptors “raciness” and “pleasantness”. Both Bisping and Terazawa also used PCA to identify their descriptors. Both claim that if the process is conducted correctly, the descriptors that will be identified will have similar meaning to the ones above. One descriptor will usually represent the dynamic and performance of the vehicle, whereas the other will be related to the comfort and luxury aspects of the vehicle. For the purpose of the research project, the descriptors “powerfulness” and “refinement” were used throughout the project, as these are descriptors used for the Jaguar brand.
The 2D map is a useful visual aid, which can involve non-technical decision makers in the target setting process. It is a way for management to communicate to each other on a common platform. NVH engineers, however, require objectivity; they need quantifiable targets related to engineering components. The 2D map is the final outcome that needs to be achieved. It can not, however, provide the engineering detail required to develop a new sound. For this a target sound generation process is used.
2.4.Target Sound Generation
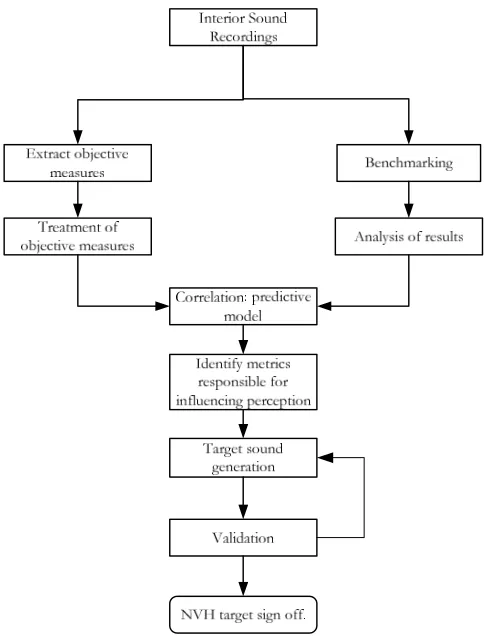
Figure 4: Setting NVH targets on subjective data
The first step in the target generation process is to select the vehicles that the manufacturer considers to be competition. This is followed by recording the interior sound of each of these cars. To ensure a like-for-like comparison between the vehicles, the recordings are made over a predetermined driving range. In the case for the Jaguar
brand, the recording is made whilst the vehicle is accelerating in 2nd Gear Wide Open
Throttle (2GWOT). Following this there are two paths that should be followed. The first is the extraction of objective measures from the sound. The objective measures are often referred to as psychoacoustic metrics, such as loudness, sharpness, and roughness (Zwicker 1999). The metrics are then treated so that they can be represented by a single number such as the average value.
representations of the subjective impressions with the many objective representations. It is likely that not all metrics will correlate. The ones that do, represent the acoustic features that influence the assessors’ perception. This means that the engineers now have a model of how subjective impressions change with objective measures. This can then be used to understand if a target sound generated will perform well when subjectively assessed.
The target sound is created by applying acoustic filters to the recording of the interior sound. The filters represent engineering changes that can be applied to an existing vehicle referred to as a “donor”. The purpose of this is to create a target sound, which may perform “better” than the donor when subjectively assessed against the competition. This second stage of subjective evaluations is referred to as validation. Here the target sound is compared against the competition and / or the existing vehicles, to assess if an improvement has occurred. If this occurs, the concept sound is used as a target which NVH engineers aim to achieve through the design of the vehicle.
Recently there has been much debate on the value of developing a model to simulate assessors’ perception. The value of a metric will change according to the changes in the stimuli it was derived from. For example, if loudness was derived for a 2GWOT, then the value of loudness will be different at the beginning of the drive cycle compared to the end. This information is then lost when the metric is represented by a single number. The use of a model should not replace the task of listening to a sound and making a judgement based on experience, desired positioning of the brand and insight into the many engineering compromises that are often required. Nevertheless the need for the subjective evaluations is still significant.
2.5.Jury Evaluations
A jury evaluation is the phrase used to describe the process of capturing the subjective opinion. For the Jaguar brand, assessors are asked for their opinion on which sounds are more “powerful” and which ones are more “refined” (Dunne 2003). There is a variety of data capture methods used to record their opinions. Otto (1999) discusses 5 types: paired comparison, rank order, rating scale, semantic differential and magnitude estimation. Although Otto’s guidelines are widely accepted as the standard in the automotive industry, other researchers such as Fry (2006) and Schulte-Fortkamp (2006) used interviews to extract richer content from the assessors. Each of these methods is discussed in the next section. The selection of analysis methods used will vary depending on the data capture method. This topic is discussed in detail in submission 7 and is summarised in chapter 5.
2.5.1. Paired Comparison
With the paired comparison method, stimuli are presented to the assessor in pairs. They listen to each sound in turn, which is then followed by the by assessor making a choice between the sounds according to their own perception, and the question asked. The results can be analysed using the Bradley Terry method. Implementation of this method is shown in submission 1, and a detailed description of the paired comparison method can be found in David (1988).
Otto (1999) describes the paired comparison method as the “easiest” of the data capture methods for non-expert assessors. They have to simply choose one of the two sounds they have heard. The disadvantage of the method, however, is that as each sound must be compared against each other; the duration of the evaluation can be lengthy, especially if repeatability measures are applied. An evaluation that is too long can result in the assessor becoming tired and less attentive to the task.
2.5.2. Rank Order
The rank order method is used to place sounds in order of preference. The decisions that assessors have to make are slightly more complex than the paired comparison method, as they have to rank a number of sounds. The method is suitable when a quick analysis of a number of cars is needed, or to compare the effect of changing a component. However it is not possible to measure how different two sounds are.
2.5.3. Rating Scales
For rating scales, the assessors are asked to rate the sounds they hear on a numerical scale, say from 0 to 100. Otto suggests that this approach is unsuitable for non-expert assessors, as they tend not use the extremities of the scales in fear that the next sound they hear is either better or worse than the one placed at the extremity. This is caused by the fact that the assessor may not have a good understanding of the range of sounds available. This also leads to the different assessors using different ranges on the scales. NVH engineers at J&LR use a numerical scale ranging from 0 to 10 during the on-road evaluations.
2.5.4. Semantic Differential
This method is similar to the rating scale, but to avoid the limitations present with the use of numbers, bipolar adjectives are used at the extremities of the scale, for example “refined” and “coarse”. Otto proposes that this makes the method more user friendly for the non-expert assessors, and promotes the use of the extremities of the scale.
2.5.5. Magnitude Estimation
2.5.6. Interviews
The interview technique involves asking the participant about their subjective opinion of the sound they hear. Coolican (1999) listed a number of advantages and disadvantages of interviews. For example the interview can provide a deeper insight into the customer preferences. It allows the interviewer to explore a deeper meaning of the assessors’ comments, and the assessment is considered realistic. The limitation on the other hand is that the information collected can be unsystematic, and therefore different discussions will originate from different assessors. This leads to difficulties with the data analysis, and Coolican (1999) states that interviews are generally unreliable. This approach will be explored further, later on in this report.
2.6.Evaluation Environments
On-road tests and listening rooms are the two main environments in which jury evaluations can be conducted.
For an on-road test, existing and prototype cars belonging to the manufacturer and their competitors are driven by the assessors in any manner they choose. For prototype vehicles, engineering changes can be applied by changing mechanical components, and then assessing the vehicle again to see how it performs. The advantages of using on-road tests are that the assessor experiences all the stimuli and the sound is assessed in the correct context. They can also assess any of the driving conditions. The assessors may perform a variety of manoeuvres, as they drive the vehicle as they would drive their own. On the other hand back-to-back comparisons of the cars are difficult. Assessors therefore may find it difficult to distinguish between the sounds. Experimental control is not easily applied, and therefore a like-for-like assessment between the cars and between the assessors is difficult to implement. This means that subjective opinion captured is dependent on evaluation conditions. If the evaluation is executed in a non-rigorous manner, then it is difficult to analyse the subjective impressions captured, which can be formed on different driving conditions by each assessor. This means that there are limited opportunities for making confident decisions.
or the loudspeakers. The assessors follow the instructions on the screen at the front of the room, and up to six participants can take part in the evaluation at the same time.
Figure 5: WMG listening room
Within the listening room, vehicles can be easily assessed back-to-back at the press of a button. The sound of cars that do not yet exist can be simulated and therefore evaluated before prototypes are built. This can be done by manipulating the recordings of existing cars. These modifications represent potential engineering changes that can be made.
Experimental conditions are repeatable for each assessor, therefore rigorous analysis techniques can be applied which complement the OEM’s decision making. The limitation however is that sound is assessed in isolation from the other stimuli, resulting in more attention being paid to the sound stimuli than would occur in a real car. Genell
et al (2007) discusses the concept of “cognitive capacity hypothesis”. This is based on the
assumption that a human has limited cognitive resources that are shared amongst the stimuli. Depending on the context of the situation they are likely to shift their cognitive resources to cater for the situation. Therefore if a task is dominated, say by assessing sound alone, all the attention resources will focus on the acoustic stimuli the ears receive, than say the information they see.
made with regards to engineering changes needed to achieve overall vehicle sound quality.
2.7.Interactive NVH Simulation
It is therefore evident that on-road tests can only be used as initial benchmarking exercises, and then used again to check when the first prototype is produced. On the other hand, the listening room can be used to test the cars that do not exist. A recently developed method is interactive simulation. This enables sound to be presented to assessors whilst they drive through a virtual environment. This can be experienced whilst either sitting in a fixed base vehicle or at a desk.
The fixed base full vehicle simulator is a stationary vehicle positioned in front of a screen onto which a virtual environment (VE) is projected. An assessor sits in the car, and “drives” through the VE. Whilst driving, the assessor listens to the interior sound of the car through headphones. Vibration is felt through the seat, the floor panel and the steering wheel, as these are the contact points between the assessor and the simulator. An actual vehicle has been used for the WMG simulator. It is a Jaguar XJ with reinforced windows and body panels which minimise the transmission of external noises.
[image:31.595.118.475.505.662.2]The author of this document was responsible for the design and commissioning of the interactive simulation facility. The facility was built next to WMG’s existing listening room facility. This had a dedicated waiting room that is now shared with the simulator facility.
Figure 6: Exterior of WMG's interactive NVH simulator
curtains that enclose the vehicle, so the driver can not be distracted with any events outside, nor can exterior light deteriorate the quality of the projected image. The lighting in the room is adjustable. The floor surrounding the vehicle is split into three platforms, all loaded onto wheels, so that it is possible to service the underneath of the vehicle if required, as this is where the power and signal cables enter the car.
[image:32.595.97.498.568.715.2]Inside the vehicle there is a touch-screen monitor located on the passenger seat, where the evaluation interface is displayed. Using this interface the assessor can choose which vehicle to drive, and record their subjective opinions. The interior of the vehicle is shown in figure 7.
Figure 7: Interior of WMG's interactive NVH simulator
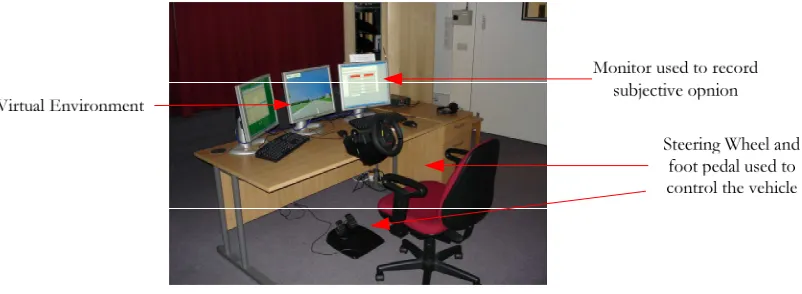
The desktop simulator is similar to the vehicle simulator. The vehicle is controlled by the assessor via a computer game steering wheel and foot pedals, whilst sat a desk. The subjective opinions are captured on a monitor using a mouse.
The computer hardware for the simulators is in a sound proof cabinet located in front of the desktop simulator. The amplifiers and the graphic equalisers can also be found here, amongst other items. Overall the facility is neutral, with the exception of the Jaguar branding on the vehicle.
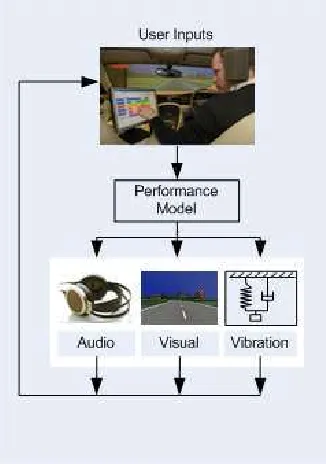
[image:33.595.216.379.307.539.2]With both simulators, accurate sound is generated in real time, in response to the driver’s behaviour; this means that the assessor can drive the simulator as they would a real car. The assessor responds to visual, auditory and tactile cues, through the use of the throttle, pedals and the touch screen. These responses are converted into inputs to the simulator’s performance model, which turns them into physical representations, which are converted into new audio, visual and tactile cues. These are then experienced by the assessor and the process continues (see figure 9).
Figure 9: Control of the interactive NVH simulator
The intended purpose of the simulator is to offer an alternative to the listening room. The ability to drive is made possible through the use of the virtual environment and the real-time audio generation. The ability to drive the concept cars is what makes the evaluation more closely related to on–road driving. The assessor is allowed to explore all driving conditions, as they are able to do in a real car. This means that they are no longer focusing on a single drive cycle such as 2GWOT.
To generate the sound of a vehicle in the simulator, its sound is recorded at speed increments of 10mph on a test track. This creates a number of very short audio files. Depending on the operating conditions of the simulator, the corresponding audio file is played. For the operating conditions where the data would be missing, say between 10 mph and 20 mph the sound heard is a blend between the two existing audio files.
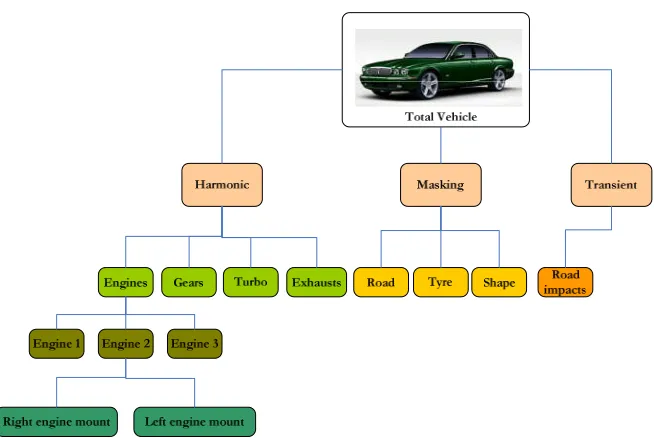
[image:34.595.129.456.334.553.2]The second feature of the simulator software is its ability to “break down” the sound recorded. This way the individual contributions that make up the sound can be heard and manipulated individually. This process is known as decomposition. This means that each of the mechanical components shown in Table 1 has acoustic properties whose effects can be heard independently and as a whole. Further details of the decomposition process can be found in Allman–Ward (2003) and Crewe (2003). The decomposition process is illustrated in figure 10
Figure 10: Decomposition process
2.7.1. Other simulators
At the time of writing this report, there appeared to be three simulators in the market place. The one discussed above was developed by Sound & Vibration Technology Ltd, and is now distributed by Bruel and Kjaer (B&K). This is the simulator that has been used as part of this research project.
stationary full vehicle simulator and a desktop simulator. However, other versions have recently been developed so that the simulator software can be fitted in real cars; these appear to be developments resulting from the OBELICS project (Objective Evaluation of Interior Car Sound). A European funded project involving two OEMs, three engineering consulting companies including Head Acoustics and LMS, and two German universities. The functionality remains the same as above. It is possible to generate the sound of target and existing vehicles in real time. Details of the Head Acoustic simulator can be found in Genuit (2001 and 2007) and Schulte-Fortkamp (2007).
Another Simulator was discussed by Goetchius (2001) from Daimler Chrysler. At the time it was said to have problems recreating high fidelity vibration, and there may be reason to believe that it eventually developed into the system sold by Head acoustics. LMS has also developed a simulator (Janessons 2006), but the available literature is limited as it does not give a full description. The papers that do describe it suggest that it is being used as an engineering tool, and not for subjective evaluations. However this statement remains unfounded until further details can be found.
There are a number of other simulators, which appear to be more of machines developed by OEMs, for generic in house testing. An example of this was from Mazda (Fukuhara 2002). In addition there are a number of other sound and vibration rigs, which play-back the stimuli, and do not allow interaction; an example of this is Ford’s vehicle vibration simulator (VVS), use of this is described by Pielemeier (2001) and Amman (2005).
2.7.2. Validation of Interactive NVH simulators.
2.7.3. Target setting using interactive NVH simulation.
Whilst it is unlikely that the interactive NVH simulation will replace on-road testing altogether, they are likely to offer alternative opportunities for the assessment of NVH attributes.
[image:36.595.93.501.237.464.2]In a presentation to an EIS conference in 2005, Roger Williams, a developer of the SVT / B&K simulator demonstrated when concept cars can be assessed, compared to when real cars are available this is illustrated in figure 11.
Figure 11: Simulation period within the vehicle development programme
With the use of the simulator it is possible to experience the vehicle before the first prototype is built. Therefore the right products can be designed ‘right first time’ by considering part load assessments as well as the traditional 2GWOT manoeuvres.
1. Step 1: Use the simulator to capture customer opinion through jury evaluations. This is equivalent to the benchmarking stages.
2. Step 2: NVH engineers and the key decision makers use this insight to design a
concept sound, using a database of simulator component models.
3. Step 3: The ideal concept sound is cascaded down to the component level and
negotiations can take place with the engineering design team.
4. Step 4: The concept sound is validated using another jury evaluation; this is the
equivalent to the Validation stage shown in figure 4.
[image:37.595.160.428.244.499.2]In ten ded use: Re al-T im e target Cre ation Inte nded use Engi neer ing Ass essm ent As sesso rs N VH En gin eers
Figure 12: Potential concept generation process
2.7.4. Methodologies for interactive simulations.
It was evident through the discussion in section 2.7.3 that the jury evaluation is a key element of the NVH target setting process. Prior to this research project the interactive NVH simulator had been used in a vehicle development programme (Williams 2005) using provisional methodological approaches. The methods implemented were, however , proposed in an ad-hoc manner with little evidence justifying their application. The original approaches were initially discussed by Allman-Ward (2004), and are reviewed in submission 3.
the simulator as a real car. As it responded to inputs such as throttle use and steering wheel, the assessors’ subjective opinions were captured on an interactive scaled interface (IS) (see figure 13). This interface facilitated a back-to-back comparison with the vehicles. For example the assessors could be driving car A at 70 mph, and then using the interface, they could instantly switch to car B, and all they notice is a change in sound and vibration. The driving conditions remain constant. The interface is shown in figure 13 Each car is represented by a button, which when pressed permits the listener to hear the sound of that car. Each vehicle can be rated by using the sliding scale. The reshuffle button rearranges how the sounds appear on the screen into rank order. The assessors are allowed to choose between the use of adjectives or numbers to rate each of the vehicles between 0 and 100.
Figure 13: Interactive scaling method
In ten ded use: Re al-Tim e tar get Cre
ation In
tend edus e Engin eerin gAs sess men t Asse ssors NV H En gin
eers As
[image:39.595.199.498.56.309.2]sess ors: Decis ionM akers (Pro gram me Chief Engin eers, Sig n-Off team )
Figure 14: Original methodology
The non-interactive approach is similar to that employed in conventional evaluation methods employed within listening rooms. These take into consideration the guidelines proposed by Otto (1999). These are well established and are often referenced by many Sound Quality practitioners. These guidelines are considered by many to be best practice for Sound Quality evaluations; however they can fall short when applied to new technologies such as the simulator. For example they do not give insight into how to optimally use interactivity, or which data capture interface is most appropriate. They do state that the assessors should be made comfortable, however how does one do this when using a virtual environment? And what additional factors need to be taken into consideration such as interactivity? In the simulator the assessor not only makes a response through the data capture interface, but also through the use of the vehicle. This, as will be shown, can have implications on how the subjective impressions formed by the assessors are interpreted.
Test Drive:
Evaluation of vehicle Noise
Acoustical analysis
Qualitative Data Analysis
Modification of vehicle noise
Test Drive:
Verification of vehicle noise
Iterative Feedback loop
Figure 15: Target setting processes proposed by Schulte-Fortkamp (2007)
Their means of data capture was to conduct an interview with the assessors whilst they are driving. The verbal data is then analysed to interpret which acoustic features the assessors were referring to. However there are some fundamental issues within this approach which means it is difficult to use it alongside the NVH target setting processes discussed so far. It is difficult to relate the comments, from the interview, to key acoustical features. Fry et al (2006) used this method to identify the reasons why assessors choose sounds according to how powerful and how refined they are. Issues were however caused in the analysis of the results. Customised methods had to be developed (by the author of this document) to convert lexicon data into ranked data which was compared to objective psychoacoustic metrics (Fry et al 2006). It was an analysis method, whose use could be justified, although it lacked the ability to apply a measure of statistical confidence within the results
In addition, each assessor is likely to verbalise their feelings using different approaches. Some assessors may be less vocal than others. The form of the data itself can be troublesome. Processing transcripts can take a long time, and capturing key themes in the transcripts can be challenging and equally time consuming. Furthermore there is limited scope to provide a measure of how much more one sound is preferred over another. Hence their use is limited within the NVH target setting processes.
by Dunne (2003), when he identified the descriptors “powerfulness” and “refinement” for the Jaguar brand.
Given this, guidelines for sound quality evaluations using interactive simulation are needed to ensure experiments are set and conducted in a scientific manner, and which exploit the interactivity functionality. In addition these guidelines have to complement existing target setting processes at manufacturers such as J&LR.
2.8. Summary of chapter
The sound of a vehicle can influence the drivers’ perception of the brand and the
vehicle. Therefore a vehicle’s sound is an important characteristic that needs to be considered during its design.
It is important to establish a target sound before the detailed design phases of the
vehicle development programme.
NVH engineers therefore need to understand what influences the customer’s
perception of sound.
To achieve this, evaluations are conducted, wherein assessors compare sounds and
their subjective impressions are captured.
Traditionally evaluations have been conducted in listening rooms and with on-road
tests. Both of which have limitations.
The simulator offers an alternative approach to the conventional evaluation
environment, by providing the potential for experimental control and the ability to evaluate existing and concept cars in real time.
This new tool requires a formal methodology for its use within existing target setting
processes.
3. H
OWP
EOPLEM
AKED
ECISIONS3.1. Introduction
Within a jury evaluation people are asked to make decisions based on their subjective impressions of the sounds they hear. The task that they are asked to complete must therefore facilitate their decision making processes without confusing or distracting them from the objectives of the evaluation. So just as previous chapters looked at how OEMs make decisions it is necessary to understand how assessors might make decisions. Both of these topics helped focus the research areas that needed to be tackled to formulate a methodology for the simulator. The purpose of this chapter is to show the rationale behind the origins of the specific research questions.
3.2. Decision Making
The main difficulty of the sound quality engineering process is that it requires humans to inform engineers of their subjective opinions. This means the engineering processes need to be able to deal with subjective data, which cannot be treated and interpreted in the same manner as engineering data. Instead the methodologies used to extract the information from an assessor need to be sufficiently robust so that decision makers can confidently use the results to decide how best to develop a vehicle.
During the jury evaluation the assessors have to make decisions on which vehicle they believe is more closely associated to the criteria used in the assessment e.g. how “powerful” each sound is; which can be an intuitive procedure. As humans we make decisions every day, and we regularly compare, contrast and select certain products over others. The decision making processes include processing physical signals from the environment surrounding the human. These are perceived and then compared to stored memories, before a decision is made and followed by an action (Wickens 1999).
Wickens (1999) described how humans make decisions. This is shown in figure 16. It is a multiple component process, which starts with a person perceiving their environment. The output of their perception is a decision resulting in a response. This response influences the environment, which is again perceived by the person, and therefore there is a continuous process.
The memory component is made up of two storages; the “long-term” and “working” memory. The long-term memory recalls past events, whereas the working memory focuses on the events that have just occurred. The memory and the perception together with the cognition enable the human to make a decision. Both Västfjäll and Kleiner, (2002) and Blauert (1994), researchers of sound quality, agree that decisions are based on cognition. Once a decision has been chosen, a response is executed.
[image:43.595.84.501.267.513.2]Attention resources are continually influencing each of the stages of the stimuli processing, decision-making and the response selection, but these are dependent on the context of the situation as was discussed in section 2.6.
Figure 16: Decision making model proposed by Wickens (1999)
3.3. Decision making in jury evaluations
Figure 17: Decision making model proposed by Zeitler (2006)
Wickens (1999) used the generic term “environment” to describe the source of the stimuli. In listening room evaluations, the environment is referred to as “sound” as this is assessed in isolation. Therefore, given the principles of cognitive capacity hypothesis, much of the attention is focused onto one stimulus. As with the Wickens model, the stimulus is captured by receptors and then processed using perception, memory and cognition until a decision has been made on how to react. The decision in this case is which sound is, for example more “powerful”, and by how much.
3.4. Research areas
Decision making within a simulator is likely to be represented by the model suggested by Wickens. The interactivity aspect of the simulator means there is a feedback loop between the simulator and the assessor, as the sound is generated in real-time in response to the assessor’s behaviour. The assessors’ choices are influenced by what they hear. What they hear is dependent on how they drive. Therefore to know which vehicle components are influencing subjective opinion, it would be necessary to capture how the assessors drive. Knowing this would enable the subjective impressions collected to be linked to driving conditions and therefore the form of the stimuli evaluated. The sound of a vehicle will be dependent on the driving conditions. Therefore knowing the driving conditions assessed will enable engineers to link subjective impressions to the mechanical components responsible of influencing the assessors’ perception.
From an evaluation perspective it was not known how to set up evaluations in the simulator, similarly it was not know how to choose between data capture methods and their corresponding data analysis techniques.
Furthermore evaluations using the interactive simulation had to take into account the NVH target setting processes, and be supported by principles of experimental psychology.
In conclusion the following five research areas needed to be better understood before a new methodology could be proposed:
1. The assessor:How they perceive and engage in the simulator based evaluations 2. The context:How to set up evaluations in the simulator, this includes:
a. The task the assessors are asked to perform. (PC or IS) b. The stimuli they hear
c. The type of simulator, desktop or full vehicle 3. Interactivity: What is the influence of interactivity? 4. Data capture
a. From the data capture interface b. Of driver behaviour
5. Analysis of
a. Data from the data capture interface b. Driver behaviour
In conjunction with the industrial partners it was decided that the following specific research questions were of a high priority. These are also illustrated in figure 18 .
1. How do assessors engage and perceive the simulator and the task? 2. Understand how to set up experiments using the simulator:
a. How to design experiments.
b. How to select data capture methods. c. How to analyse the data collected. 3. Understand interactivity:
a. How to capture how people make decisions.
R
P
M
S
p
e
e
d
Brand D Brand F
Brand G
Brand E
Brand B
Brand C
[image:46.595.111.484.56.345.2]Brand A Target Target
Figure 18: Research questions
This chapter has illustrated how people make decisions and the research questions that have been addressed in the project.
The next chapter discusses research resulting from question 1. Chapter 6 discusses research from question 2, whereas chapter 7 discusses the findings from question 3. The
4thresearch question needs to be applied to both research question 2 and 3, and therefore
4. A
SSESSORS’ P
ERCEPTION OFS
OUNDQ
UALITYE
VALUATIONS USINGI
NTERACTIVES
IMULATION.
4.1. Introduction.
Assessors are the integral part of the sound quality evaluation. They are in essence a detection and measurement system. Integrating their needs and expectations into the evaluation procedure should result in them making confident assessments of the sounds. Hence the methodological approaches suggested must take into consideration how the assessors perceive the experience and engage in the task of evaluating sounds using interactive simulation.
The full vehicle simulator is a real vehicle positioned in front of a screen onto which a virtual environment is projected. This should not be an intimidating set-up, as humans we are regularly exposed to vehicles and computer generated graphics on a daily basis. It is, however, the context of the experiment that may be alien to the assessors. They are asked to listen to vehicles’ sound and rate them whilst driving through a virtual environment. This is not an everyday occurrence for most people; it was therefore necessary to understand how they react to this new situation.
From conducting sound quality evaluations in the listening room, there was a general awareness to ensure the assessors were first comfortable in the evaluation environment; and engaged in the task of evaluating sounds. It was also important to grasp how willing they would be to return for future evaluations. Assessors are a rare commodity; having a database of assessors willing to return can reduce the time taken to set-up evaluations. Recruiting and organising assessors is one of the more time consuming aspects of sound quality evaluations. In addition, by keeping a database of assessors it is also possible to monitor how subjective opinions can change over time.
4.2. Assessor engagement.