http://wrap.warwick.ac.uk/
Original citation:
Yang, Liwei, Ikram, Magzhan, Gurumani, Swathi, Fahmy, Suhaib A., Chen, Deming and
Rupnow, Kyle (2015) JIT trace-based verification for high-level synthesis. In:
International Conference on Field Programmable Technology (FPT), Queenstown, New
Zealand, 7-9 Dec 2015. Published in: Proceedings of the International Conference on
Field Programmable Technology pp. 228-231.
Permanent WRAP url:
http://wrap.warwick.ac.uk/75578
Copyright and reuse:
The Warwick Research Archive Portal (WRAP) makes this work of researchers of the
University of Warwick available open access under the following conditions. Copyright ©
and all moral rights to the version of the paper presented here belong to the individual
author(s) and/or other copyright owners. To the extent reasonable and practicable the
material made available in WRAP has been checked for eligibility before being made
available.
Copies of full items can be used for personal research or study, educational, or
not-for-profit purposes without prior permission or charge. Provided that the authors, title and
full bibliographic details are credited, a hyperlink and/or URL is given for the original
metadata page and the content is not changed in any way.
A note on versions:
The version presented here may differ from the published version or, version of record, if
you wish to cite this item you are advised to consult the publisher’s version. Please see
the ‘permanent WRAP url’ above for details on accessing the published version and note
that access may require a subscription.
JIT Trace-based Verification for
High-Level Synthesis
Liwei Yang
∗, Magzhan Ikram
†, Swathi Gurumani
†, Suhaib A. Fahmy
∗, Deming Chen
‡, Kyle Rupnow
† ∗School of Computer Engineering, Nanyang Technological University†Advanced Digital Sciences Center, Singapore ‡University of Illinois at Urbana-Champaign
Email: {yang0345, sfahmy}@e.ntu.edu.sg, ,{magzhan.i, swathi.g, k.rupnow}@adsc.com.sg,[email protected]
Abstract—High level synthesis (HLS) tools are increasingly adopted for hardware design as the quality of tools consistently improves. Concerted development effort on HLS tools represents significant software development effort, and debugging and validation represents a significant portion of that effort. However, HLS tools are different from typical large-scale software systems; HLS tool output must be subsequently verified through functional verification of the generated RTL implementation. Debugging machine-generated functionally incorrect RTL is time-consuming and cumbersome requiring back-tracing through hundreds of signals and simulation cycles to determine the underlying error. This challenging process requires support framework in the HLS flow to enable fast and efficient pinpointing of the incorrectness in the tool. In this paper, we present a debug framework that uses just-in-time (JIT) traces and automated insertion of verification code into the generated RTL to assist in debugging an HLS tool. This framework aids the user by quickly pinpointing the earliest instance of execution mismatch, paired with detailed information on the faulty signal, and the corresponding instruction from the application source. Using CHStone benchmarks, we demonstrate that this technique can significantly reduce bug detection latency: often with zero cycle detection.
Index Terms—JIT, Trace-based Verification, High-Level Syn-thesis
I. INTRODUCTION
High level synthesis (HLS) tools, which automate transla-tion of C/C++ algorithm implementatransla-tions into register transfer level (RTL) descriptions, have seen significant improvements in recent years. HLS tools are large software systems, and thus verification and debugging of HLS tools is a significant portion of the design and development effort.
Traditionally, large scale software development uses a va-riety of tools and techniques to support verification and debugging efforts, including debug tools (e.g. GDB), memory analysis tools (e.g. Valgrind), assertions and printing-based debugging, modularization of source code for unit-testing, and formal verification. However, although these techniques continue to play a role in debugging of HLS tools, they are not sufficient; these tools can help verify that an HLS tool executes without syntax errors and produces syntactically correct RTL, but final verification also requires that the produced RTL is functionally equivalent to the input C/C++ source.
Functional verification of RTL is performed through sim-ulation and comparison of output values. When an output
mismatch is identified, the user must trace backwards through the simulation to discover the earliest incorrect internal value; this earliest symptom can then be used to diagnose the cause of the problem in the HLS tool. This process may require de-tailed backtracing through hundreds of signals over the course of hundreds or thousands of cycles of simulated execution. Furthermore, HLS-produced RTL is typically not intended to be human-readable. This challenge of effectively verifying and debugging incorrect RTL can become a bottleneck in HLS tool development, hindering further improvement of the HLS tools. The HLS process performs many transformations to paral-lelize and optimize execution; thus, we cannot validate appli-cation correctness by comparing the exact order of operations. However, we can fundamentally characterize correct execution with a few properties: input data received, output data pro-duced, conditional control transitions, correct propagation of data through data selection (PHI-node) operations, and forward progress in execution.
In this paper, we present a framework that supports HLS tool debug: we use just-in-time compilation and trace-generation to generate the set of expected values for all operations that characterize an application and automatically insert RTL ver-ification code for each operation and value pair, together with information about the correspondence between the RTL and operation in LLVM-IR. Using this framework, we demonstrate that we can detect bugs in the HLS core. Furthermore, we demonstrate that our RTL verification code detects the earliest instance of execution mismatch with low-latency; often zero cycles, and always 3 or fewer cycles of simulated execution.
This paper contributes to debugging and verification of HLS tools with:
• A JIT based implementation that automatically gathers expected values for all characteristic operations.
• A trace-based approach to automatically insert RTL ver-ification code for all operations that characterize correct application execution.
• A demonstration that this technique detects mismatched
execution with low-latency.
II. RELATEDWORK
Verification of an HLS tool flow is similar in concept to verification of general purpose compilers: instead of proving
that the HLS tool (compiler) executes to completion correctly, we must prove that output RTL (or binary) is functionally correct. Generally, the problem of verifying a compiler is difficult: typical compilation frameworks such as LLVM are not formally verified; projects attempt to verify some LLVM passes, but have not successfully produced a fully-verified compiler [1]. Some prior work has tried to formally verify functional equivalence between input high level sources and the output RTL [2], [3]. However, the complex CDFG trans-formations and hardware-oriented optimizations prove difficult to formally verify. As the complexity of HLS optimizations increases, this problem will only be exacerbated, especially in a framework that has no underlying formal framework. Because our HLS framework is built on LLVM, we cannot rely on underlying formal verification to ensure that all compilation transformations are provably correct.
Debugging tool-generated incorrect RTL is challenging and for this reason, several groups have worked on debugging and verification tools for HLS [4]–[7]. However, these techniques concentrate on diagnosing faults under the assumption that the input application is incorrect. These techniques provide no further support for internal verification of HLS algorithms to pinpoint the cause of functional incorrectness. Similarly, the hybrid quick error detection (HQED) [8] can infer that a bug is caused by the HLS core, but cannot pinpoint the earliest location of functional mismatch to help diagnose the bug.
In this work, we present a framework that specifically sup-ports HLS tool debug. We insert verification code blocks that includes diagnostic information on the LLVM-IR instructions and RTL variables in the generated-RTL and ensure that any fault in RTL is detected by our framework.
III. VAST HLSANDTOOLDEBUG
Our JIT trace-based verification framework is built on VAST HLS, an existing LLVM-based HLS framework [9], [10]. VAST HLS translates C/C++ source inputs to Verilog RTL implementation by following typical HLS steps such as pars-ing, compiler optimization, allocation, schedulpars-ing, binding and RTL code generation. In addition, VAST generates a hardware-oriented intermediate representation (IR) for hardware-specific optimization passes; VAST keeps track of correspondence be-tween LLVM-IR instructions and VAST-IR operations, which is important for our purposes in trace-based verification. In addition to our verification framework for this paper, VAST HLS includes a large number of C++ assertions that validate input source code and check for known potential problems in the HLS algorithms. These assertions capture many potential problems before RTL verification, but an HLS developer cannot predict all possible potential bugs.
During the HLS process, the LLVM-IR (and VAST-IR) are repeatedly transformed to perform optimizations for area and latency of the generated hardware design. These optimizations may parallelize operations, move operations between basic blocks, eliminate redundant operations or duplicate operations for improved predication, or transform operations through
constant propagation and strength reduction. All of these opti-mizations may transform the sequence or timing of operations while retaining functional equivalence. However, in order to verify RTL correctness, we must characterize correct behavior of the hardware, independent of these valid (and necessary) area and performance optimizations.
Therefore, we specify a set of instructions which is critical for functional correctness. In order to guarantee correctness for both data-flow and control-flow, we verify all load/store instructions and control-flow instructions, such as branch, switch andφinstructions. By verifying this set of instructions, we can guarantee that no functionally incorrect RTL output can execute without violating at least one of the expected behaviors. The only errors we cannot detect are those that still produce functionally correct behavior despite a bug: e.g., divide by 1 and multiply by 1 will produce same result. How-ever, different input vectors will detect this bug. Furthermore, with information on the correspondence between RTL opera-tions and LLVM-IR operaopera-tions, the exact failing verification statement can be used to diagnose the specific underlying problem. Additional information that verifies the sequence of loop iterations, index values, and control transitions serves to verify internal RTL core behavior.
IV. JIT TRACE-BASEDVERIFICATION
Our trace-based verification framework uses just-in-time compilation and execution [11] to generate traces of the sequence of input and output values for all critical instruc-tions. Then, using those traces, RTL code generation inserts verification code for each traced value of each instruction.
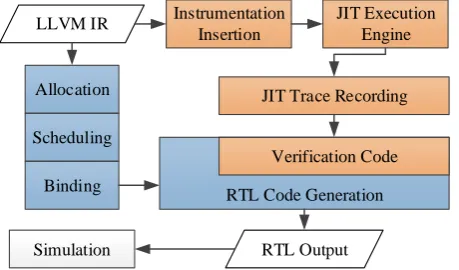
Our verification flow (orange) is integrated into the existing VAST HLS flow (blue) as shown in Fig. 1. VAST HLS uses Clang to parse C/C++ code into LLVM-IR and perform HLS-independent optimizations, followed by HLS-related IR transformations. From this IR, we perform instrumentation of each targeted instruction type, and use JIT compilation and execution to generate traces for each instruction. Then, during code generation, we track correspondence between hardware structures and the LLVM-IR instructions; for each hardware structure with JIT trace data, we also generate verification code. VAST HLS also automatically generates testbenches and simulation scripts; thus, our inserted verification code is automatically used during functional verification.
LLVM IR Instrumentation Insertion
JIT Execution Engine
RTL Output Simulation
RTL Code Generation Verification Code Allocation
Scheduling
Binding
[image:3.595.315.545.565.700.2]JIT Trace Recording
A. Trace Extraction
Given an input LLVM-IR application, we need to extract traces of sequences of input and output values for each instruction. The LLVM infrastructure provides support for just-in-time compilation and execution of LLVM-IR modules; in our case, we use this functionality to instrument the LLVM-IR and produce a trace for each desired instruction.
For our set of instructions, we will need to verify both address and data values. Furthermore, the data values may have a variety of data types, and bit-level optimizations may produce a variety of (non-power of 2) operand widths. Thus, before recording values, we reformat instruction arguments to perform pointer extraction, value alignment and masking for the relevant bits to compare. Then, the formatted instruction arguments are recorded to an instruction trace using a call to our custom trace-collection function. The algorithm for instruction instrumentation is shown in Algorithm 1. The trace-collection function simply keeps an individual sequence of values for every instrumented LLVM-IR instruction.
Algorithm 1: Instrumentation Algorithm
InstrumentedM←V AST M odule;
defRecordT race();
foreachinstructioninInstrumentedM do ifinstruction.T ype∈T argetT ypesthen
putinstructioninT argetInstructions;
end end
foreachinstructioninT argetInstructionsdo ifinstruction.hasP ointerArg()then
// insert Instrumented Instructions:
Addr←instruction.getP ointerArg();
CastedAddr←P ointerCast(Addr);
M askedAddr←CastedAddrandM ask;
AlignedAddr←Shif t(M askedAddr);
RecordT race(AlignedAddr);
end
// insert Instrumented Instructions:
Arg←instruction.getV alueArg();
CastedArg←V alueCast(Arg);
RecordT race(CastedArg);
end
After instrumentation of every desired LLVM-IR instruc-tion, we create an LLVM execution engine that executes our instrumented module (which generates the trace data). The current CHStone benchmarks do not require command line parameters, but the JIT method can provide command line parameters if required. In this paper, we examine only the CHStone benchmarks with a single set of input data; to detect any data-dependent bugs, the user should use multiple sets of input data: each with uniquely generated verification code.
The execution engine will produce a JIT trace as shown in Fig. 1. Because of their importance for input/output and control flow, all of the verified instruction arguments will correspond to a register in the hardware. However, due to the binding process of HLS, a single hardware register may correspond to data storage for multiple different LLVM-IR in-structions, each with a unique execution trace. Thus, the trace data structure is organized to be aware of register binding,
and keep multiple independent (potentially interleaved) traces for each register. For each trace, the values are stored in order (e.g. the first execution of an instruction produces val ex1, the second produces val ex2, and so on).
B. Verification Code Generation
Given the JIT trace, we can now generate the verification code as part of the RTL code generation. As shown in Algorithm 2, for each register and LLVM-IR instruction, we generate a block of verification code. Each of these verification blocks uses a trace counter to keep track of the sequence of trace values for the specific LLVM-IR instruction. In addition to the instruction blocks, we generate scheduling verification and heart beat verification code blocks to verify control-flow.
Algorithm 2: Verification Code Generation Algorithm
intreg trace counter;
foreachregisterdo foreachinstructiondo
reg trace counter+ +;
switchreg trace counterdo
case1:compare(val ex1, actual val);
case2:compare(val ex2, actual val); . . .
endsw end
if!$onehot({slots})then
$display(time, active slots, instructions); $finish(”Multiple active slots for one register!”);
end end
ifall slots are inactivethen
$display(last active slot); $finish(”Heart beat stops!”);
end
For each instruction, we also insert a trace mismatch verification block. Using the trace counter, this code block tracks an expected value for each execution of the instruction, and in the case of mismatch prints information about the mismatch. The generated code also includes the corresponding LLVM-IR instruction and its parent basic block to aid in bug diagnosis. In the case of a trace mismatch, we also classify mismatches into critical and non-critical faults. Critical faults indicate unrecoverable execution mismatches, and thus we immediately terminate simulation. Non-critical faults may be execution mismatches due to predication (e.g. due to global code motion): the instruction execution may be re-executed with updated arguments, producing correct functionality. If the fault is non-critical, we print warnings, but do not halt simulation. If the non-critical fault represents a real fault, the erroneous execution will propagate to a critical fault.
ver-ification code also includes LLVM-IR instruction information to aid in bug diagnosis.
Finally, we also generate a verification block to ensure that the FSM is always in a valid state. This heart beat block simply ensures that at least one state is always active; if no state is active, the RTL module FSM has died unexpectedly.
V. EXPERIMENTALSETUP ANDRESULTS
In order to demonstrate the effectiveness and improvement of detection latency of the proposed JIT trace-based verifica-tion, we will use our extended HLS framework with CHStone benchmark suite [12] to debug our HLS tool. We use the verification framework to detect 9 representative bugs in our HLS tool. These examples should not be considered acomplete set of detectable bugs: any HLS core bug that produces incorrect RTL output will be detected by this technique.
For each benchmark input, we use our extended VAST HLS with verification code enabled and perform RTL verification through simulation in Modelsim 10.1d. For each bug, it is considered detected if one or more critical fault is detected during simulation. We measure the detection latency by man-ually tracing backwards from the message printed by our verification code to the earliest instance of incorrect execution. Because the verification code prints out information about the cycle of mismatch, expected and actual value, and detailed information about the LLVM-IR instruction(s) involved in the mismatch, these print-outs aid the user in quickly and efficiently identifying associated hardware structures such as registers, multiplexors, scheduled FSM states, and connected intermediate variables.
Table I shows the bug detection results for the 9 repre-sentative HLS core bugs. The bug detection latency for 7 of the 9 bugs is zero: at the instant the bug produces incorrect results, the verification code detects incorrect execution and immediately halts simulation. The only non-zero detection latency is a bug in the translation of a combinational function; because it takes several cycles for an incorrect computation to propagate to a load or store, the detection latency is a few cycles. It is important to note that the HLS development and verification process must test the HLS core on a wide number of benchmarks. For all of these bugs, the produced RTL is
TABLE I: HLS-Core Bug Results
Bug Related JIT
Description LLVM IR Latency Detection
Incorrect Control- JIT trace state transition state load 0 mismatch Missing register for Pipeline- JIT trace
MUX pipelining register store 0 mismatch Missing register for Pipeline- JIT trace
datapath pipelining register load 0 mismatch Incorrect computation Data-dependent JIT trace
translation load 3 mismatch Incorrect computation Data-dependent JIT trace
translation store 3 mismatch Incorrect array Initialization JIT trace
initialization load 0 mismatch Incorrect handling of PHI-dependent JIT trace
control flow for PHI load 0 mismatch Conflicting port Memory-port Scheduling
assignment loads 0 verification Control state Control- Heart beat transition broken state PHI 0 detection
incorrect in only a subset of CHStone benchmarks; often for only one specific combination of HLS optimization options. The modularity of VAST HLS to enable and disable individual optimizations helped us to narrow the faulty test cases, but the bug itself is often a corner-case combination of the program representation and the results of multiple interrelated HLS optimizations.
Together these 9 bugs demonstrate automated coverage of potential errors in any portion of the HLS core: bugs in control FSM generation, pipelining, translation of combina-tional operations (e.g. due to bit level optimization), memory initialization, scheduling, and binding (port assignment) are examples that represent the entire HLS flow.
VI. CONCLUSIONS
In this paper, we developed a framework for debugging HLS tool: we used LLVM’s just-in-time compilation and performed trace-generation to generate the set of expected values for all operations that characterize an application; we also performed automated generation of RTL verification code for each op-eration and value pair, together with information about the correspondence between the RTL and operation in LLVM-IR. We demonstrated that our verification code identifies the earliest execution mismatch in any incorrect HLS-generated RTL with low detection latency.
VII. ACKNOWLEDGEMENT
This study is supported in part by the research grant for the Human-Centered Cyber-physical Systems Programme at the Advanced Digital Sci-ences Center from Singapore’s Agency for Science, Technology and Research.
REFERENCES
[1] J. Zhao, S. Nagarakatte, M. M. Martin, and S. Zdancewic, “Formal verification of ssa-based optimizations for llvm,” in ACM SIGPLAN Notices, vol. 48, no. 6. ACM, 2013, pp. 175–186.
[2] A. Mathur, M. Fujita, E. Clarke, and P. Urard, “Functional equivalence verification tools in high-level synthesis flows,”Design Test of Comput-ers, IEEE, vol. 26, no. 4, pp. 88–95, July 2009.
[3] X. Feng and A. Hu, “Early outpoint insertion for high-level software vs. rtl formal combinational equivalence verification,” inDAC, 2006, pp. 1063–1068.
[4] K. Hemmert, J. Tripp, B. Hutchings, and P. Jackson, “Source level debugger for the sea cucumber synthesizing compiler,” inFCCM, April 2003, pp. 228–237.
[5] J. A. N. Calagar, S. Brown, “Source-level debugging for fpga high-level synthesis,” inFPL, September 2014.
[6] J. Goeders and S. Wilton, “Effective fpga debug for high-level synthesis generated circuits,” inFPL, Sept 2014, pp. 1–8.
[7] G. Jeffrey and W. Steven, “Using dynamic signal-tracing to debug compiler-optimized hls circuits on fpgas,” inFCCM, 2015.
[8] K. A. Campbell, D. Lin, S. Mitra, and D. Chen, “Hybrid quick error detection (H-QED): Accelerator validation and debug using high-level synthesis principles,” inDAC, 2015, pp. 53:1–53:6.
[9] H. Zheng, S. Gurumani, L. Yang, D. Chen, and K. Rupnow, “High-level synthesis with behavioral level multi-cycle path analysis,” inFPL, 2013. [10] H. Zheng, S. Gurumani, L. Yang, D. Chen, and K. Rupnow, “High-level synthesis with behavioral-level multicycle path analysis,” Computer-Aided Design of Integrated Circuits and Systems, IEEE Transactions on, vol. 33, no. 12, pp. 1832–1845, Dec 2014.
[11] Kaleidoscope: Adding JIT and Optimizer Support, http://llvm.org/docs/tutorial/LangImpl4.html.
[12] Y. Hara, H. Tomiyama, S. Honda, H. Takada, and K. Ishii, “Chstone: A benchmark program suite for practical c-based high-level synthesis,” in