University of Warwick institutional repository: http://go.warwick.ac.uk/wrap
A Thesis Submitted for the Degree of PhD at the University of Warwick
http://go.warwick.ac.uk/wrap/49626
This thesis is made available online and is protected by original copyright.
Please scroll down to view the document itself.
M A
E
G NS
I T A T MOLEM
U N
IV ER
SITAS WARWICEN
SIS
Sparse Graphical Models for Cancer Signalling
by
Steven Mark Hill
Thesis
Submitted to the University of Warwick
for the degree of
Doctor of Philosophy
Centre for Complexity Science and Department of Statistics
Contents
Acknowledgements iv
Declarations v
Abstract vi
Chapter 1 Introduction 1
Chapter 2 Background 10
2.1 Biological background . . . 10
2.1.1 Protein synthesis . . . 10
2.1.2 Protein signalling . . . 13
2.1.3 Protein signalling and cancer . . . 16
2.1.4 Targeted cancer therapy . . . 17
2.1.5 Protein signalling networks . . . 19
2.2 Experimental background . . . 21
2.2.1 Western blot . . . 21
2.2.2 ELISA . . . 21
2.2.3 Mass spectrometry . . . 22
2.2.4 Flow cytometry . . . 23
2.2.5 Reverse phase protein arrays . . . 23
2.3 Methodological background . . . 27
2.3.1 Linear regression model . . . 27
2.3.2 Model selection and averaging . . . 32
2.3.3 Variable selection in the linear model . . . 40
2.3.4 Graphical models . . . 47
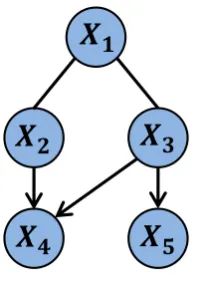
2.3.5 Graph structure learning: Bayesian networks . . . 55
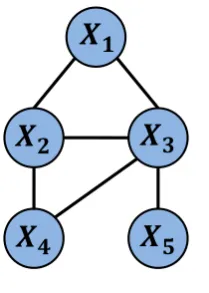
2.3.6 Graph structure learning: Gaussian graphical models . . . 65
2.3.8 Empirical Bayes . . . 71
2.3.9 Clustering . . . 73
Chapter 3 Integrating biological knowledge into variable selection: an empirical Bayes approach 79 3.1 Introduction . . . 79
3.2 Methods . . . 81
3.2.1 Bayesian linear model with interaction terms . . . 82
3.2.2 Exact posterior inclusion probabilities . . . 83
3.2.3 Biologically informative model priors . . . 84
3.2.4 Empirical Bayes . . . 87
3.2.5 Prediction . . . 87
3.3 Results . . . 88
3.3.1 Synthetic response data . . . 88
3.3.2 Cancer drug response data . . . 94
3.4 Discussion . . . 101
Chapter 4 Dynamic Bayesian networks reveal novel signalling links in a cancer cell line 107 4.1 Introduction . . . 107
4.2 Methods . . . 112
4.2.1 Bayesian score . . . 112
4.2.2 Exact inference by variable selection . . . 116
4.2.3 Empirical Bayes . . . 119
4.3 Results . . . 120
4.3.1 Simulation study . . . 120
4.3.2 Synthetic yeast network study . . . 124
4.3.3 Network model for breast cancer cell line MDA-MB-468 . . . . 126
4.4 Discussion . . . 138
Chapter 5 Network-based clustering with mixtures of sparse Gaus-sian graphical models 143 5.1 Introduction . . . 143
5.2 Methods . . . 146
5.2.1 Penalised estimation of Gaussian graphical model structure . . 146
5.2.2 Mixture of penalised Gaussian graphical models . . . 147
5.2.3 Maximum penalised likelihood . . . 148
5.3 Results . . . 152
5.3.1 Simulated data . . . 152
5.3.2 Application to breast cancer data . . . 160
5.4 Discussion . . . 164
Chapter 6 Discussion and Outlook 169 Appendix A Experimental data 175 A.1 Chapter 3 - Proteomics and drug response data . . . 175
A.1.1 Proteomics . . . 175
A.2 Chapter 4 - Proteomics and validation experiments . . . 177
A.2.1 Reverse phase protein arrays . . . 177
A.2.2 Validation experiments . . . 178
A.3 Chapter 5 - Proteomic data . . . 182
Acknowledgements
First and foremost I would like to thank my supervisor Sach Mukherjee. His
unwa-vering support, dedication and guidance over the past few years has been invaluable.
He always had time for discussions about my work and these were invariably
stim-ulating and insightful, and conducted with much enthusiasm and patience.
I am also very grateful to all the biologists who played a part in generating
experimental data that made the applications presented in this thesis possible. In
particular, I would like to thank Gordon Mills, Paul Spellman, Joe Gray, Yiling Lu,
Bryan Hennessy, Richard Neve, Jennifer Molina and Laura Heiser.
This work was supported by the Engineering and Physical Sciences Research
Council (EPSRC), through the University of Warwick Complexity Science Doctoral
Training Centre (DTC). I am grateful to the Complexity DTC and EPSRC for the
opportunity to conduct this research. I would like to thank all staff and students for
creating an enjoyable and stimulating environment within which to do research. In
particular, I thank Paul Chleboun, with whom I shared an office for over three years;
along with the many research-based discussions, I shall miss our bizarre
conversa-tions and light-hearted banter. I also wish to thank the Complexity administrators
over the past few years; Phil Richardson, Monica de Lucena and Jen Bowskill.
Several people have helped out in proof-reading this thesis. In this regard I
wish to thank Linda Hill, Chris Oates, Anas Rana and Paul Chleboun.
Finally, I would like to thank my family for their ongoing support and
en-couragement. In particular, my most important thanks goes to my wife, Linda.
The writing of this thesis impacted her the most; I am very grateful for her constant
Declarations
The work presented here is my own, except where stated otherwise. This thesis
has been composed by myself and has not been submitted for any other degree or
professional qualification.
All experimental data used within this thesis was obtained by others, as
indi-cated in each case. The experimental protocols in Appendix A were written
by those that obtained the data.
Some of the background information in Section 2.3.2.3 is adapted from material
written by myself and contributed to a book chapter [Mukherjeeet al., 2010].
The work in Chapter 3 has been published inBMC Bioinformatics (with some
revisions) [Hillet al., 2012].
The work in Chapter 4 will shortly be submitted for publication.
The work in Chapter 5 extends and improves upon work published by my
su-pervisor and myself [Mukherjee and Hill, 2011], and will shortly be submitted
Abstract
Protein signalling networks play a key role in cellular function, and their dysregulation is central to many diseases, including cancer. Recent advances in biochemical technology have begun to allow high-throughput, data-driven studies of signalling. In this thesis, we investigate multivariate statistical methods, rooted in sparse graphical models, aimed at probing questions in cancer signalling.
First, we propose a Bayesian variable selection method for identifying subsets of proteins that jointly influence an output of interest, such as drug response. An-cillary biological information is incorporated into inference using informative prior distributions. Prior information is selected and weighted in an automated manner using an empirical Bayes formulation. We present examples of informative pathway-and network-based priors, pathway-and illustrate the proposed method on both synthetic pathway-and drug response data.
Second, we use dynamic Bayesian networks to perform structure learning of context-specific signalling network topology from proteomic time-course data. We exploit a connection between variable selection and network structure learning to efficiently carry out exact inference. Existing biology is incorporated using informa-tive network priors, weighted automatically by an empirical Bayes approach. The overall approach is computationally efficient and essentially free of user-set param-eters. We show results from an empirical investigation, comparing the approach to several existing methods, and from an application to breast cancer cell line data. Hy-potheses are generated regarding novel signalling links, some of which are validated by independent experiments.
Chapter 1
Introduction
In recent years significant advances have been made in biochemical technology and techniques, resulting in an increasing availability of high-throughput data in molec-ular and cell biology. Examples of such technologies include DNA microarrays and high-throughput sequencing for transcriptomic and genomic data, and protein mi-croarrays, mass spectrometry and flow cytometry for proteomic data. The avail-ability of such data has motivated and driven a shift towards a ‘systems’ approach to biology instead of a more traditional reductionist approach. The reductionist approach focusses on the identification of individual molecular components and the study of their functions. However, cell behaviour arises from and is regulated by components such as genes and proteins acting in concert. Obtaining an understand-ing of this complex interplay and resultunderstand-ing functionality characterises the systems
approach [Ideker et al., 2001; Kitano, 2002; Ideker and Lauffenburger, 2003]. The
approach is multi-disciplinary, combining biology with other fields such as mathe-matics, statistics, physics, engineering and computer science.
Biological networks are widely used to represent and visualise interplay be-tween molecular components and are integral to the systems approach. Networks (or graphs; we use both terms interchangeably throughout this thesis) consist of a set of nodes, representing molecular components such as genes or proteins, and a set of (directed or undirected) edges which represent relationships or interplay between
the components. Examples include gene regulatory networks [Hecker et al., 2009]
and protein signalling networks [Yarden and Sliwkowski, 2001; Sachs et al., 2005];
such as cancer, can help in the discovery of processes that cause and sustain the disease, and can guide therapeutics [Pe’er and Hacohen, 2011].
Proteins play a key role in most cellular functions. Signalling is an important cellular process, which ultimately leads to cellular responses such as cell proliferation and apoptosis (programmed cell death). The nodes in protein signalling networks represent signalling proteins and edges represent interactions between proteins that result in the signal being transduced through the cell. Protein signalling pathways and networks have complex structures with combinatorial nonlinear interactions, cross-talk between pathways and feedback mechanisms [Citri and Yarden, 2006;
Rubbi et al., 2011]. Thus, in order to obtain a proper understanding of
context-specific signalling processes, it is necessary to take a systems network approach rather than studying components in isolation. The development of high-throughput proteomics means that data is now available that enables many components to be
investigated simultaneously [see e.g. Sachs et al., 2005]. Further details of protein
synthesis, protein signalling and signalling networks are provided in Section 2.1 and details of several protein assays are provided in Section 2.2.
Cancer is a prevalent disease; it was the cause of 28% of all deaths in the UK in 2009 [Cancer Research UK, 2012]. It is a genetic disease, with multiple DNA mutations resulting in dysregulation of cellular processes such as proliferation and apoptosis, ultimately leading to the transformation of a normal cell into a cancerous cell. Mutated, cancer-causing genes often code for signalling proteins, and so it is aberrant signalling that often causes the dysregulation in cellular processes. Indeed, aberrant signalling is heavily implicated in the six functional capabilities that are acquired during tumour development and are regarded as ‘hallmarks’ of cancer [Hanahan and Weinberg, 2000]; these are, self-sufficiency in growth signals, insensitivity to growth-inhibitory signals, evasion of apoptosis, limitless replicative potential, sustained angiogenesis, and tissue invasion and metastasis. Recently, two further potential hallmarks were added to the original six [Hanahan and Weinberg, 2011]; deregulating cellular energetics and avoiding immune destruction. Further details regarding protein signalling and cancer are provided in Section 2.1.3.
are involved in cell processes that are dysregulated in cancer, such as proliferation, apoptosis and angiogenesis. Signalling proteins are a common target for these thera-pies (specific examples are provided in Section 2.1.4) and so knowledge of signalling networks and mechanisms is important for identifying novel therapeutic targets. Since these therapies focus on specific molecules that play a role in carcinogenesis, they may be more effective than the more traditional approaches and may result in fewer side effects.
Classification of cancers is traditionally based on factors such as histopatho-logical type, tumour grade and tumour stage. As the molecular biology of cancer becomes better understood, classifications based on molecular characteristics of
tu-mours are being developed [Perouet al., 2000; Sørlie et al., 2001; TCGA-Network,
2011]. For example, Perouet al.[2000] used gene expression data to classify breast
cancer tumours into four subtypes (basal, luminal, ErbB2 positive and normal), which were later refined into five subtypes that can be used as prognostic markers
for overall and relapse-free survival [Sørlieet al., 2001]. Cancer subtypes reflect the
remarkable levels of molecular heterogeneity in cancer. This heterogeneity results in diverse responses to therapies across cancer patients; a drug that works for one patient may not work for another. This has driven the surge in interest in person-alised therapies that tailor treatment regimes to the molecular characteristics of a patient’s tumour [Majewski and Bernards, 2011]. The identification of molecular biomarkers or signatures that are predictive of response to a targeted therapy is a key goal for personalised medicine. Signalling proteins are potential sources of such predictive biomarkers due to their important role in cellular processes and the fact that many therapies target them. An example of such a biomarker is the HER2 receptor protein in breast cancer; see Section 2.1.4 for further details.
Along with the developments in experimental technology discussed above, continual improvements in computing power have enabled computationally-intensive simulations and statistical inference using increasingly complex mathematical and statistical models. A model is a simplification of the underlying system that captures features and relationships that are of interest and explain the observed data. Models vary in their levels of abstractness. Ordinary differential equations have been used to directly model biochemical reaction kinetics in signalling pathways [Schoeberl
et al., 2002; Chen et al., 2009; Wang et al., 2009a]. Such models provide a
complex with many parameters and are generally not solvable analytically, resulting in their restriction to relatively small systems for both computational and statisti-cal reasons. Also, the network structures are usually assumed to be known, with modelling focusing on the actual mechanisms involved in interactions. In contrast, more abstract, high level models, for example Boolean models or continuous, linear models, are often analytically tractable with fewer parameters, allowing larger sys-tems to be modelled and network structures themselves to be inferred. While these models may not be as realistic or as predictively accurate, hypotheses can still be formed regarding network structure; this is the approach we take in this thesis, using continuous linear models. Once the structure is known, more detailed modelling can be used to investigate the underlying mechanisms between certain components.
Statistical models take variability into account via probability distributions. Variation in the data can either be systematic, due to an underlying signal in the system, or can be stochastic, due to measurement noise, variability within the bio-chemical cellular processes themselves [Ray, 2010], or unmodelled mechanisms and components in the system. Unlike deterministic models such as ordinary differential equations, statistical models take account of stochastic variation in the data, which can help to elucidate the true underlying interactions and mechanisms. Statistical inference can be used to select appropriate models, often employing a trade-off be-tween model fit and model complexity that helps to avoid overfitting of the model to the data. This is particularly important for the majority of high-throughput
data, which is of high dimensionality, but small sample size (the ‘large p, small n’
paradigm). The growing interest in biological networks has resulted in much interest in multivariate statistical methods, and in particular, graphical models.
learning is also known as network inference and we use both terms interchangeably throughout the thesis.
This thesis concerns the learning of sparse graphical model structure from high-throughput proteomic data, with a focus on protein signalling networks in cancer. Graphical model structure learning has received much attention in the past decade, but most applications have focussed on gene regulatory networks, due primarily to the abundance of DNA microarray data. Since protein signalling plays a major regulatory role in the functionality of cells, with aberrant signalling implicated in cancer, and since signalling proteins are potential cancer therapeutic targets, it is also important to study molecular networks at the signalling level. We focus on structure learning of networks that are sparse; that is, networks with a small number of edges. This emphasis on sparse networks is important for several reasons. First, sparse network models have fewer parameters and so help to avoid statistical overfitting. Second, sparse networks are easier to interpret and thereby facilitate hypothesis generation. Third, the true underlying network structures are often sparse. This is thought to be the case for protein signalling networks due to the highly specific enzymatic reactions involved in signalling interactions [Beard and Qian, 2008].
Graphical model structure learning is used in this thesis to probe important questions in cancer signalling that have potential implications for cancer therapy. In Chapter 3 we consider the problem of identifying subsets of signalling proteins (i.e. protein signatures) that are predictive of drug response. This is a variable selection problem, but can also be framed as a graphical model structure learning problem (see Section 2.3.5.2). Chapters 4 and 5 both consider structure learning of protein signalling networks in cancer; Chapter 4 considers structure learning of signalling networks for individual cancer cell lines and Chapter 5 considers cancer subtype discovery and simultaneous structure learning of subtype-specific networks. The multivariate statistical and computational approaches we employ to address these problems incorporate a range of methods and models (in addition to directed and undirected graphical models). These include: Bayesian inference, frequentist (penalised) maximum likelihood inference, empirical Bayes approaches, linear re-gression models, Bayesian model selection and model averaging, variable selection, expectation-maximisation, and clustering. Background information for all these methods and models, and background on graphical model structure learning and structure learning in general will be given in Section 2.3.
Bayesian variable selection methods have been widely used for such inference
prob-lems [Leeet al., 2003; Jensenet al., 2007; Mukherjee et al., 2009; Ai-Jun and
Xin-Yuan, 2010; Li and Zhang, 2010; Yeunget al., 2011]. An ever increasing amount of
ancillary biological information is available, such as signalling pathway and network structures, that could be incorporated into inference to improve results. Bayesian approaches allow for such incorporation via biologically informative prior distribu-tions, yet it is not always clear how information should be selected or weighted relative to primary data. In the proposed approach, empirical Bayes is used to automatically select and weight prior information in an objective manner. We de-velop informative pathway- and network-based priors and demonstrate on synthetic response data that the approach can aid prior elicitation and guard against misspec-ification of priors. In addition, the continuous linear model employed, together with sparsity constraints, results in a fast, exact procedure with very few user-set param-eters, yet capable of capturing interplay between molecular players. An application of the approach is made to cancer drug response data.
Chapter 4 describes a graph structure learning approach, using directed graphical models known as dynamic Bayesian networks (DBNs), and applies the approach to learn a signalling network for an individual breast cancer cell line from proteomic time series data. DBNs have previously been used to infer gene
regula-tory networks from time series data [Husmeier, 2003; Perrinet al., 2003; Kimet al.,
2003; Zou and Conzen, 2005; Grzegorczyket al., 2008; Grzegorczyk and Husmeier,
2011a; Rau et al., 2010; Robinson and Hartemink, 2010; Li et al., 2011]. As
dis-cussed above, the investigation of signalling networks in specific contexts, such as cancer, is an important problem. Yet, multivariate data-driven characterisations of context-specific signalling networks remains a challenging and open problem. In-deed, such multivariate data has only recently been made available as a result of
advances in experimental proteomics [see e.g. Sachs et al., 2005; Sheehan et al.,
2005]. The approach carries out inference within an exact framework and incorpo-rates existing biology using an informative network prior, weighted automatically and objectively, relative to primary data, by empirical Bayes. This again results in a computationally efficient, exact method, with very few user-set parameters. Results on simulated data place the approach favourably relative to other existing structure learning approaches, and the network inferred from breast cancer proteomic data is used to generate hypotheses regarding novel context-specific signalling links, which are validated in independent experiments.
subtype-specific signalling network structure. Clustering approaches are often un-able to, or often make assumptions that preclude, the modelling of cluster-specific network structure. Hence, if differences exist between clusters at the network level, these approaches may not be able to recover the correct clustering (or network structures). The proposed network-based clustering approach exploits recent re-sults in penalised likelihood estimation of undirected graphical models [Friedman et al., 2008] and combines this with model-based clustering [McLachlan and Bas-ford, 1987; Fraley and Raftery, 1998; McLachlan and Peel, 2000; Fraley and Raftery, 2002] to permit simultaneous estimation of cluster assignments and cluster-specific networks. We perform an empirical investigation comparing several specific pe-nalisation regimes, presenting results on both simulated data and high-throughput breast cancer protein signalling data. Our findings allow for some general recom-mendations to be made regarding penalisation regime and also demonstrate that network-based clustering can provide improved performance relative to clustering methods that disregard cluster-specific network structures.
The novel contributions of the thesis are as follows:
Chapter 3:
– We describe an empirical Bayes approach to automatically select and
weight biologically informative priors in Bayesian variable selection, and develop examples of such priors based on pathway and network structure information.
– We present an empirical investigation of variable selection with
informa-tive priors, selected and weighted by empirical Bayes. Results are shown on both synthetic and drug response data, and comparisons are made to alternative methods.
Chapter 4:
– We perform exact inference of DBN structure by exploiting a connection
between DBN structure learning and variable selection. In particular, posterior edge scores are calculated using exact Bayesian model averag-ing. Empirical Bayes weighting of prior information is also carried out within the exact framework, along with relevant diagnostics.
– We present an empirical investigation of the described structure learning
approach. Results are shown on both simulated data and data from a
utility of prior information is assessed and comparisons are made to sev-eral other existing structure learning approaches for time series data.
– We apply the approach to proteomic time series data from a breast
can-cer cell line. This contributes to the small number of recent studies in the literature concerning structure learning of cancer protein signalling
networks [Guhaet al., 2008; Mukherjee and Speed, 2008; Ciaccio et al.,
2010; Bender et al., 2010]. We generate testable hypotheses regarding
novel signalling links, which are then subsequently validated in indepen-dent experiments (carried out by Gordon Mills’ lab at MD Anderson Cancer Center, Houston). To the best of our knowledge, this is the first application of DBN structure learning to protein signalling time series data, and the first application of structure learning to protein signalling networks in cancer that results in independently validated hypotheses.
Chapter 5:
– We describe a network-based clustering approach that permits
simultane-ous estimation of cluster assignments and cluster-specific networks. The
approach is similar to the one proposed by Zhouet al.[2009], but while
they focus on clustering in combination with variable selection, our focus is on simultaneous clustering and network structure learning. In addi-tion, we propose a more general form for the penalisation term than that
in Zhouet al. [2009].
– We present an empirical investigation comparing several specific
penal-isation regimes, using both simulated data and high-throughput breast cancer protein signalling data. General recommendations regarding pe-nalisation regime are proposed based on the results.
– The application to breast cancer data leads to the biologically interesting
finding that heterogeneity between cancer subtypes at a transcriptional level is also reflected at the level of signalling network structure.
The thesis is organised as follows:
Chapter 2
Background
In this Chapter, we describe the background material relevant to this thesis. The focus of this thesis is the inference of sparse graphical model structure, where the graph structure represents protein signalling networks in cancer cells, or dependen-cies between signalling components and a response of interest. Section 2.1 outlines the biological process of protein signalling and its importance in cancer biology. Sec-tion 2.2 describes the various experimental techniques and technologies available for assaying signalling proteins, and Section 2.3 provides background on the statistical models and methods employed in the subsequent Chapters.
2.1
Biological background
2.1.1 Protein synthesis
Cells are the basic building blocks of living organisms. Prokaryotes, such as bacteria, are organisms that do not have cell nuclei or other complex cell structures and are mostly unicellular. In contrast, eukaryotes contain cell nuclei and other membrane enclosed entities such as mitochondria. All multicellular animals and plants, and some unicellular organisms such as yeast are eukaryotes. Proteins are integral to the majority of processes that occur within cells, and thus have a key role in all living organisms. Examples of protein function in cellular processes include, acting as enzymes for metabolic reactions, playing a part in forming and maintaining cell structure, aiding cell motility, and communicating inter- and intra-cellular signals.
DNA (gene)
mRNA
modified mRNA Protein
Transcription
Post-transcriptional Modification (e.g. splicing) Translation
Post-translational Modification and Regulation
Figure 2.1: Protein synthesis and genetic regulation. Proteins are synthesised
from DNA via production of mRNA. Synthesised proteins can directly or indirectly regulate gene expression. See text for details.
contained in the cell nucleus (in eukaryotes) and is a double-helix consisting of two long polymers composed of nucleotides adenine (A), guanine (G), cytosine (C) and thymine (T). The sequence of nucleotides are genetic instructions for development and functioning of the organism, carried out through production of proteins. All cells contain the same DNA, but the amount of each protein (protein expression) varies. This enables formation of cells of differing types and control of the processes within these cells.
factors are proteins that attach to the promoter region of a gene and activate or inhibit expression by promoting or blocking the recruitment of RNA polymerase. This gives rise to the notion of gene regulatory networks (GRNs). If a protein produced by an activated gene is a transcription factor, it can enter the nucleus and activate or inhibit expression of other genes. Thus, there is a regulatory relationship between the gene that codes for the transcription factor and the genes that the transcription factor binds to. This can be described by a network where nodes are genes and edges represent the regulatory relationships between them. However, regulatory relationships are often not direct; for example, a transcription factor may need to undergo a post-translational modification before being able to bind to a gene, or a gene may code for a protein that indirectly influences gene expression via its role in a signalling pathway or via it forming a complex with a transcription factor. GRNs are used to represent these indirect relationships also.
There is a substantial body of literature concerning structure learning of
GRNs from gene expression data [see e.g. Bansalet al., 2007; Heckeret al., 2009, and
references therein]. Due to widespread availability of high-throughput technology capable of performing genome-wide measurements, such as DNA microarrays and, more recently, RNA-sequencing, these network inference methods typically use data at the mRNA level, rather than the protein level. While mRNA levels may be correlated with total protein levels (although this has been shown to not always
be the case [Greenbaumet al., 2003]), post-translational modifications (PTMs) of
proteins cannot be detected at the genomic level. PTMs are chemical modifications of the translated protein that can change the function of a protein or regulate its activity. Indeed, the number of distinct proteins in a cell is substantially more numerous than the number of genes. This complexity of the proteome is partly contributed to PTMs, with RNA splicing being another key process by which distinct proteins are synthesised from a single gene. PTMs are known to play a key role in cellular function and are also implicated in development and persistence of disease, as we shall discuss below. Thus, directly measuring and studying proteins and their PTMs can provide important insights into cellular processes and their dysregulation in disease, that would be hidden in genomic level studies. Examples of PTMs include those that attach certain chemical groups to specific amino acid residues, such as phosphates or acetates, or those that make structural changes to the protein, for example cleavage by a protease. Below we consider phosphorylation (the addition
of phosphate groups), one of the most common PTMs [Khoury et al., 2011], and
2.1.2 Protein signalling
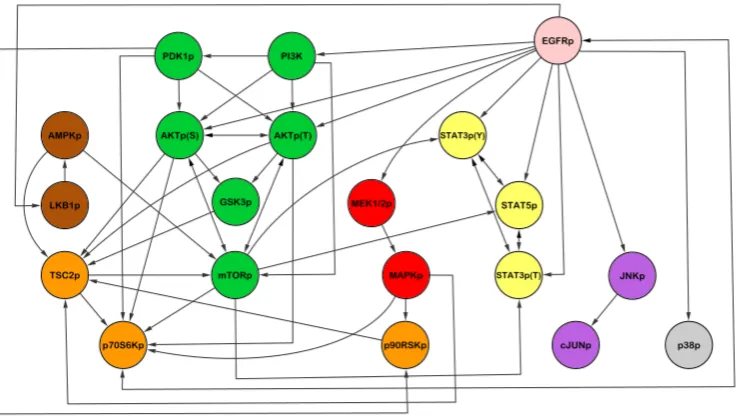
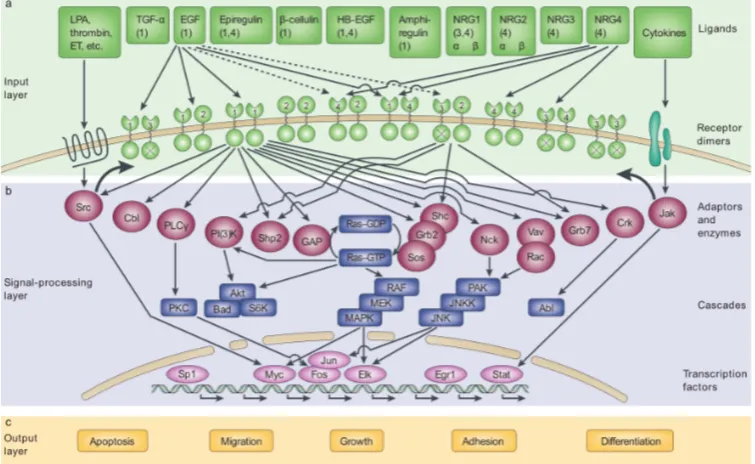
Protein signalling (also referred to as signal transduction) is the mechanism by which proteins on the cell membrane receive external signals and transduce them into the cell, where proteins communicate to process the signal and often transmit it to the cell nucleus to ultimately achieve a cellular response such as cell proliferation. In this way, cells are able to communicate with each other and adapt to their external environment. We now outline in more detail the mechanisms involved, using the epi-dermal growth factor (EGF) signalling pathway (also known as the ErbB pathway) as an illustration. The EGF signalling pathway is known to often be dysregulated in cancer cells; we discuss how dysregulation of signalling is central to carcinogenesis below and here focus on signalling mechanisms in a normal cell. A schematic of the EGF pathway is shown in Figure 2.2.
Central to protein signalling pathways are protein kinases. Protein kinases are enzymes that remove a high-energy phosphate group from ATP and transfer it to specific amino acids in other proteins, a process called phosphorylation (see Figure 2.3). The phosphate group is usually attached to one of three amino acids; serine, threonine or tyrosine. Serine/threonine kinases act on both serine and thre-onine residues and are the most common type of kinase, while tyrosine kinases act on tyrosine residues. Phosphorylation of a protein leads to a conformational change in its structure, causing it to become ‘activated’. It is a reversible event; proteins can be ‘deactivated’ through removal of phosphate groups by enzymes called phos-phatases. This mechanism allows signals to be transmitted through the cell with high levels of specificity and precision.
transduced to within the cell. As well as forming homodimers with other ErbB1 receptors, heterodimers with other members of the ErbB receptor family can also be formed. Indeed, ErbB2 (also known as HER2) does not have an extracellular ligand binding domain and is activated by forming heterodimers with other family members and homodimers with other ErbB2 receptors. ErbB3 has no intracellular kinase domain and so must also form heterodimers. Finally, ErbB4 is more similar to ErbB1 having both extracellular ligand binding and intracellular kinase domains. In some cases, activation of a receptor by a ligand has a direct causal effect on the behaviour of the cell, or an indirect effect via a simple signal transduction mech-anism. For example, activation of the Notch receptor causes its intracellular domain to be released from the cell membrane. The Notch fragment can then migrate to the cell nucleus where it acts as a TF, causing a change in gene expression and thus a change in cell behaviour due to different proteins being produced. However, in many cases, the signal transduction mechanism is much more complex, involving protein-protein interactions (physical binding of two or more proteins) and cascades of protein phosphorylations; this is the case for EGF signalling. Phosphorylation of
RTKs creates binding sites for proteins with a SH21 domain. An example of such a
protein is Grb2, which also has a SH3 domain. Grb2 then binds, via its SH3 domain, to a protein called Sos, bringing Sos to the cell membrane where protein Ras is lo-cated. Proteins such as Grb2, which function as bridges between two other proteins (here, the RTK and Sos), are called adaptor proteins. Sos can then interact with and induce activation of Ras, a key intracellular signal transducer that transmits the signal to several pathways, including the MAPK/Erk and Akt pathways. These pathways involve signalling cascades of kinases. For example, in the MAPK/Erk pathway (see Figure 2.2), activation of Ras brings the serine/threonine kinase Raf to the cell membrane and binds to it, leading to its activation. The activated ki-nase Raf then phosphorylates the kiki-nase MEK, which in turn phosphorylates the kinase MAPK (also known as Erk). In these kinase cascades, phosphorylation of a kinase leads to conformational changes and its functional activation, enabling it to phosphorylate and activate the next kinase in the pathway. Phosphorylated MAPK can then translocate to the nucleus, where it phosphorylates TFs, regulating their activity. In this way, the signal is passed down through the cell and into the cell nucleus, resulting in changes in gene expression and therefore regulation of cellular processes such as cell growth, differentiation and apoptosis.
It is important to note that, in addition to regulating gene expression, protein
1
signalling can also affect cell behaviour in other, more direct ways. For example, the intracellular serine/threonine kinase Akt phosphorylates the protein Bad, which plays a role in promoting apoptosis; phosphorylation inhibits its pro-apoptotic effect.
Further details of protein signalling in general can be found in Albertset al.
[2008, Chapter 15] and Weinberg [2006, Chapters 5 & 6], and of signalling in the ErbB network in Yarden and Sliwkowski [2001].
2.1.3 Protein signalling and cancer
Cancer is a genetic disease; many carcinogens (cancer-causing agents) cause alter-ations to DNA sequences. These alteralter-ations range from small single point mutalter-ations to larger aberrations such as deletions, insertions or translocations. Most mutations occur in somatic (body) cells and so, unlike germline mutations, are not passed on to offspring which can lead to a hereditary predisposition to developing cancer. However, somatic mutations can be passed on to new cells in the process of cell division. Cells have defense mechanisms such as DNA repair to correct mutations before cell division occurs, or if the DNA is unable to be repaired, apoptosis destroys the cell to prevent persistence of mutations in new cells. Evasion of these defense mechanisms and alterations in cell proliferation and differentiation processes can lead to carcinogenesis.
There are two main types of genes in which mutations can lead to develop-ment of cancer; oncogenes and tumour suppressor genes. Oncogenes are mutated genes that cause over-expression or an increase in activity of the genes protein product, which leads to enhanced cell proliferation and cell survival. The normal, unmutated version of an oncogene is referred to as a proto-oncogene. Tumour sup-pressor genes are inactivated by mutation and code for proteins that inhibit cell proliferation or promote apoptosis. Thus, inactivation of these genes again results in uncontrolled cell proliferation.
As described above, protein signalling pathways play a crucial role in most cellular functions, including cell proliferation, differentiation and apoptosis. Dys-regulation of signalling pathways is implicated in most, if not all, of the alterations in cell physiology that lead to carcinogenesis, described by Hanahan and Weinberg [2000, 2011] and outlined in the Introduction. Oncogenes often code for proteins in-volved in mitogenic signalling pathways such as the EGF pathway; that is, signalling pathways that result in cell proliferation.
The ErbB2 gene was found to be amplified (i.e. replication of the section of DNA containing the gene results in extra copies of the gene) in approximately a third of
breast tumours [Slamonet al., 1987]. This amplification leads to overexpression of
the RTK HER2. As described above, HER2 does not require binding of a ligand to allow dimerisation; it is in a constitutively active conformation and so is free to bind with other HER2 receptors or other RTKs in the EGFR family. Heterodimers con-taining HER2 are formed preferentially and generate stronger intracellular signals than other combinations [Yarden and Sliwkowski, 2001]. Therefore, overexpression of HER2 leads to constitutive stimulation of Akt and MAPK pathways, conferring a growth advantage to the tumour cells (due to enhanced cell survival and cell pro-liferation). Breast cancers with an amplified ErbB2 gene are associated with short
survival times and therefore poor prognosis [Slamonet al., 1987; Sørlieet al., 2001].
However, prognosis has been improved due to targeted therapies, which we discuss further below. Further details of the mechanisms involved in HER2 overexpression
in breast cancer can be found in Emdeet al. [2011].
In addition to mutations that dysregulate a signalling pathway through over-expression of a receptor, mutations can also affect other intracellular signalling trans-ducers. An example of this type of mutation is given by the Abl oncogene in CML (chronic myelogenous leukemia). Abl codes for a nuclear tyrosine kinase that plays a role in apoptosis. The mutated version of Abl arises due to chromosomal transloca-tion of the Abl gene to within the Bcr gene, resulting in a new fusion gene, Bcr-Abl. This fusion gene codes for a fusion protein, located in the cytoplasm rather than the nucleus, with constitutive activation of the Abl tyrosine kinase. The result is aber-rant kinase signalling that affects the cell cycle, leading to uncontrolled proliferation of white blood cells (i.e. leukemia). Targeted therapies have also been developed for this mutation.
Further details regarding oncogenic signalling pathways can be found in Weinberg [2006, Chapters 5 & 6].
2.1.4 Targeted cancer therapy
We introduced targeted cancer therapy and the move towards stratified and per-sonalised medicine in the Introduction. Recall that targeted therapies are drugs that target specific molecules involved in tumour formation and progression, and so interfering with these molecules can block the growth of cancer cells. Many of these targets are signalling proteins, which we focus on here and give some specific examples.
an intracellular receptor that activates when bound by the hormone estrogen. Ap-proximately 75% of breast cancers are dependent on ER for proliferation. Activated ER can usually be found in the cell nucleus, where it acts as a transcription factor, regulating genes that control cell proliferation. In the 1970s a drug called Tamoxifen was approved for use against breast cancer. Tamoxifen is a competitive antagonist; that is, it competes with estrogen for binding of ER and binding does not lead to activation of ER. Therefore, it can prevent estrogen from binding and activating ER and thereby blocks cancer cell growth. However, it was not until the 1990s that analysis of clinical trial results demonstrated that Tamoxifen only provides benefits in ER positive early breast cancer tumours [EBCTCG (Early Breast Cancer Trial-ists’ Collaborative Group), 1998]. Tamoxifen is an effective targeted breast cancer adjuvant therapy and has also been used as a preventive treatment [Jordan, 2006]. Trastuzumab (market name Herceptin) is a monoclonal antibody that binds selectively to the HER2 receptor and is used to treat breast cancer. Approximately a third of breast cancers are HER2 positive; that is, they overexpress the HER2 receptor (see above for details of aberrant HER2 signalling). The mechanism of action of Trastuzumab is not completely understood. Possibilities include the pre-vention of HER2 activation and therefore a reduction in the downstream signalling that leads to uncontrolled cell proliferation, antibody-dependent cell cytotoxicity (ADCC; binding of Trastuzumab to HER2 induces an immune response that at-tacks the cell), suppression of tumour angiogenesis (growth of new blood vessels), or removal of HER2 from the cell surface. Laboratory tests are performed on tumour samples to determine if it is HER2 positive, and will therefore respond to treatment with Trastuzumab. It was approved in 1998 and was one of the first treatments to be applied selectively based on molecular characteristics of tumours. When com-bined with chemotherapy, treatment with Trastuzumab results in improved survival and response rates. However, it can have severe side effects such as heart disease and resistence to the drug is usually developed within one year of commencement
of treatment. Further details regarding trastuzumab can be found in M´enardet al.
[2003]; Emdeet al. [2011] and references therein.
Protein Kinase
Kinase Domain
Substrate
Protein Kinase
Kinase Domain
ATP
P P
P
P
Active kinase signalling Inactive kinase signalling
Kinase Inhibitor
ATP
P P
P Substrate
Figure 2.3: Protein kinases and mechanism of action of kinase inhibitors.
Left: Protein kinases have a catalytic kinase domain that transfers a phosphate group from ATP to specific amino acids on protein substrates; a process called phosphorylation. This leads to ‘activation’ of the substrate and, in this way, a signal is transduced through the cell. Right: Kinase inhibitors block kinase signalling by binding to the kinase domain, which prevents binding of ATP or the substrate (or both) and therefore blocks phosphorylation of the substrate.
example, Imatinib binds to the ATP binding site of Abl. Imatinib has transformed CML treatment, improving five year survival rates from 30% to approximately 90%. Kinase inhibitors are used in Chapters 3 and 4. In Chapter 3 an Akt inhibitor is used in the application of the variable selection approach to drug response data. In Chapter 4 Akt and Mek inhibitors are used to validate hypotheses generated from inference of signalling networks. In order to investigate whether a kinase inhibitor has the desired effect, it is necessary to monitor the targets of the kinase. For example, in the Raf-Mek-Erk cascade, a Mek inhibitor does not reduce the phosphorylation level of Mek, but the reduction in Mek’s enzymatic activity should lead to a reduction in the phosphorylation level of Erk.
Many emerging targeted therapies are currently in clinical trials; for example,
an overview for breast cancer is given by Alvarezet al. [2010].
2.1.5 Protein signalling networks
investigating phosphorylation of proteins can aid the discovery of new drug targets
and cancer biomarkers [Yuet al., 2007].
As described in the Introduction, signalling networks have complex structures and mechanisms. Therefore, multivariate approaches capable of modelling multiple interacting components are required in order to obtain a more complete understand-ing of normal signallunderstand-ing processes and their dysregulation in cancer. For example, consider structure learning of signalling networks. Interactions between signalling proteins were traditionally discovered by focussing on a single protein and perform-ing multiple experiments to determine its upstream regulators and downstream tar-gets (an example of such a discovery is the well-studied interaction between kinases Akt and GSK3; Akt phosphorylates GSK3 [Brazil and Hemmings, 2001]). Advances in high-throughput proteomics and the resulting multivariate data, together with advances in computing, have rendered feasible structure learning with multivariate
models [Sachs et al., 2005; Mukherjee and Speed, 2008; Bender et al., 2010], and
in specific contexts such as cancer, where signalling networks are thought to be ‘rewired’ [Pawson and Warner, 2007; Yuan and Cantley, 2008].
The protein signalling networks described above, and illustrated in Fig-ure 2.2, contain several types of mechanisms, including protein-protein interactions and phosphorylation. In this thesis, we consider only phosphorylation signalling. This means that edges in the phosphorylation signalling network may not represent direct causal mechanisms. For example, an edge from a receptor to an upstream kinase (e.g. Raf) would be an indirect interaction via unobserved adaptor proteins (e.g. Grb2). Moreover, the signalling networks we consider do not contain any spatial information which may play an important part in signalling; for example, migration of an activated protein from the cytoplasm into the nucleus, or internal-isation of a receptor. However, this simplified representation can still be useful for many analyses as we demonstrate in Chapters 3-5 where such signalling networks are used as prior information and as the object of inference.
It is worth emphasising that the phosphorylation signalling networks consid-ered here are not the same as protein-protein interaction networks (PPI networks), which also receive significant attention in the literature. Protein-protein interaction networks mostly focus on protein interactions where two or more proteins physically bind to form a complex. Phosphorylation and PPI networks are, however, related. For example, phosphorylation of a protein may be required before a protein-protein
interaction can occur [Shaywitzet al., 2002]; this is the case for interactions between
2.2
Experimental background
In this section, we give a brief overview of several protein assays that can be used to probe protein phosphorylation. Such analyses are challenging due to the low abundance of phosphoproteins, low stoichiometries, and highly dynamic phospho-rylation process. In recent years, several high-throughput approaches have been developed, although we note that these technologies are not yet on the same scale as DNA microarray and next generation sequencing technologies. We focus mainly on reverse phase protein arrays, which provide the data for our applications in Chapters 4 and 5.
2.2.1 Western blot
A Western blot [Burnette, 1981], also called a protein immunoblot, is used to detect the amount of specific proteins (at phosphoform and isoform level, if desired) in a sample. The procedure is as follows: Cells are lysed to release the proteins. The pro-teins are then separated according to their molecular weight by gel electrophoresis, usually SDS-PAGE (Sodium Dodecyl Sulfate PolyAcrylamide Gel Electrophoresis). This process uses an electric field to obtain separation. Proteins are then transferred from the gel to a special membrane, while retaining the same pattern of separation as on the gel; this is the ‘blotting’ part of the procedure. The membrane is probed for a protein of interest using antibodies. A primary antibody binds to the protein (ideally with high specificity) and then a secondary antibody is applied which binds to the primary antibody. The secondary antibody is labelled with a reporter en-zyme, resulting in production of luminescence in proportion to the amount of protein bound by the primary antibody. This luminescence can then be ‘photographed’.
Western blots are widely-used to assess phosphorylation states of proteins. They have reasonably good sensitivity and specificity, but require a relatively large amount of sample and significant human labour effort. Hence, they are not par-ticularly suitable for large-scale proteomic analyses. Western blots are used in Chapter 4 to validate hypotheses generated from our statistical data analysis (see Figure 4.9(c)).
2.2.2 ELISA
interest (but not specific to the phosphoform of interest). The sample (e.g. cell lysate) containing the protein of interest is added to the plate, resulting in bind-ing of the protein to the capture antibody. A detection antibody specific to the protein phosphoform of interest is added, and then a secondary antibody with re-porter enzyme is used, as in the Western blot assay, to determine the amount of phosphoprotein in the sample.
The results of ELISA are more easily quantifiable than for Western blot and the approach has higher specificity and sensitivity (due to the use of two antibodies). However, it is still not a high-throughput method. It is widely used in clinical settings, for example to perform HIV screening tests.
2.2.3 Mass spectrometry
Advancements in mass spectrometry (MS) technology and techniques over the last decade have enabled its use for high-throughput phosphoproteomic analyses. There are numerous alternative MS procedures and it is a very active field of research. Since MS data is not used in this thesis, we give only a very brief and general overview. Further details of mass spectrometry techniques and their application to
(oncogenic) protein signalling can be found in Nita-Lazaret al.[2008]; Harsha and
Pandey [2010]; Choudhary and Mann [2010].
The general MS procedure is as follows: Proteins are isolated from cell lysate and may also be separated by gel electrophoresis. They are then degraded into tides; MS can be performed on whole proteins, but is then less sensitive. The pep-tides enter the mass spectrometer and are separated, vapourised and then ionised. The ions are then separated according to their mass-to-charge ratio, detected and quantified, resulting in a mass spectrum showing intensities against ratios. Proteins can then be identified using database matching algorithms. Quantitative MS tech-niques such as SILAC (stable isotope labelling by amino acids in cell culture) can be used to obtain relative abundances of proteins in different samples.
In the past, MS approaches have focussed on unbiased discovery of pro-tein phosphorylation sites and their quantification. More recently, targeted MS approaches have been used to, for example, quantify temporal dynamics in specific
signalling pathways [Wolf-Yadlin et al., 2007], and has helped to improve
repro-ducibility of MS results.
2.2.4 Flow cytometry
Flow cytometry [Herzenberg et al., 2002; Perez and Nolan, 2002] can measure the
abundance of phosphoproteins on a single-cell level, in a high-throughput manner. A laser beam is aimed at a hydrodynamically focussed stream of liquid. Cells are passed through this stream, causing a scattering of the light beam. Fluorescent chemicals in the cell, attached to antibodies specific to certain phosphoproteins, are excited by the laser beam and emit light. The scattered and fluorescent light is measured by detectors allowing information to be obtained about the cell, such as abundance of phosphoproteins.
Flow cytometry can obtain thousands of samples (measurements from thou-sands of cells) in seconds and is also capable of sorting a heterogeneous mixture of cells in a technique called FACS (fluorescence-activated cell sorting). In contrast to experiments using lysed cells, cells are not destroyed during analysis by flow cytom-etry. Another advantage of flow cytometry is that variability on a single-cell level can be observed. Non-single-cell approaches assume that behaviour of cells can be captured from the population average (lysed cells). However, stochasticity at the single-cell level may be important in determining cell behaviour.
The number of phosphoproteins that can be measured simultaneously is, however, limited. This is due to spectral overlap between fluorescent markers, mean-ing that in practice, only up to ten proteins can be measured. Background noise (fluorescence) can also cause problems.
In Sachset al.[2005] flow cytometry was used to measure 11 phosphoproteins
and phospholipids in thousands of individual immune system cells, and the data was used to infer a signalling network. We use this data in simulations in Chapter 3. Flow cytometry is also used in clinical settings to diagnose blood cancers, for example.
2.2.5 Reverse phase protein arrays
Reverse phase protein arrays (RPPAs), first introduced in 2001 [Paweletz et al.,
2001], are a high-throughput technology capable of quantitative measurement of (phosphorylated) protein levels in thousands of biological samples simultaneously. The experimental procedure uses antibodies to detect proteins, and in this respect it is similar to Western blots and ELISA. The essence of the procedure is illustrated in Figure 2.4 and outlined below.
PROTEIN MICROARRAY FORMATS
Protein microarray formats can be divided into two major classes: forward phase arrays and reverse phase arrays (RPAs).1In the forward phase array format, the analyte(s) of
interest is captured from the solution phase by a capture molecule, usually an antibody, that is immobilized on a sub-stratum and acts as bait molecule (1, 2) (Fig. 1). In a forward phase array, each spot contains one type of immobilized antibody or bait protein. Each array is incubated with one test sample such as a cellular lysate or serum sample representing a specific treatment condition, and multiple analytes from that sample are measured simultaneously. In contrast, the RPA format immobilizes an individual complex test sample in each array spot such that an array is comprised of hundreds of different patient samples or cellular lysates. In the RPA format, each array is incubated with one detection protein (i.e. anti-body), and a single analyte end point is measured and directly compared across multiple samples (17, 24, 26 –29) (Fig. 1). Probing multiple arrays spotted with the same lysate concom-itantly with different phosphospecific antibodies provides the
effect of generating a multiplex readout. Efforts are ongoing in our laboratory to multiplex the arrays even further through the use of dual color infrared dye-labeled antibodies as well as quantum dots. Using these technologies, it is hoped that multiple analytes can be measured on the same spot on the same array (30, 31). The utility of reverse phase protein mi-croarrays lies in their ability to provide a map of known cell signaling proteins. Identification of critical nodes, or interac-tions, within the network is a potential starting point for drug development and/or the design of individual therapy regimens (21, 22). The array format is also amenable to extremely sensitive analyte detection (Fig. 2) with detection levels ap-proaching attogram amounts of a given protein and variances of less than 10% (1, 32). Detection ranges could be substan-tially lower in a complex mixture such as a cellular lysate; however, the sensitivity of the RPAs is such that low abun-dance phosphorylated isoforms can still be measured from a spotted lysate amount of less than 10 cell equivalents. This level of sensitivity combined with analytical robustness is critical if the starting input material is only a few hundred cells from a biopsy specimen.
The reverse phase protein array has demonstrated a unique ability to analyze signaling pathways using small numbers of cultured cells or cells isolated by laser capture microdissec-tion from human tissue procured during clinical trials (17, 24, 26, 27). Using this approach, microdissected pure cell popu-lations are taken from human biopsy specimens, and a protein lysate is arrayed onto nitrocellulose-coated slides (Fig. 3). Key technological components of this method offer unique advan-tages over tissue arrays (33) or antibody arrays (34, 35). First the RPA can use denatured lysates so that antigen retrieval, which is a large limitation for tissue arrays, is not problematic. Protein microarrays can also consist of non-denatured lysates derived directly from microdissected tissue cells so that pro-tein-protein, protein-DNA, and/or protein-RNA complexes can be detected and characterized. Each patient sample is printed on the array in serial dilutions, providing an internal standard. When an internal reference standard of known and fixed amounts of the analyte are applied to the same array, a direct and quantitative measurement of the phosphorylated end point can be attained within the linear dynamic range of the assay. Finally RPAs do not require direct labeling of the patient sample as a readout for the assay, which provides a marked improvement in reproducibility, sensitivity, and ro-bustness of the assay over other techniques (36).
The RPA platform has been used to explore a variety of signaling pathways involved in malignant progression and tumor biology (17, 26 –29, 37). For example, in a study of prostate tissue, pathway profiling of microdissected cells from normal, stroma, and prostate tumors revealed the preliminary finding that activation of protein kinase C␣is down-modu-lated in prostate cancer progression (26). If validated, this finding could have profound effects on the rationale behind some current therapies (38) and illustrates the importance of
1
The abbreviation used is: RPA, reverse phase array.
FIG. 1.Classes of protein microarray technology.Forward phase
arrays (top) immobilize a bait molecule such as an antibody designed to capture specific analytes with a mixture of test sample proteins. The bound analytes are detected by a second sandwich antibody or by labeling the analyte directly (upper right). Reverse phase arrays immobilize the test sample analytes (e.g.lysate from laser capture microdissected cells) on the solid phase. An analyte-specific ligand (e.g.antibody;lower left) is applied in solution phase. Bound antibod-ies are detected by secondary tagging and signal amplification (lower
right).
Reverse Phase Arrays for Molecular Network Analysis
Figure 2.4: Protein microarrays. (a) Forward phase protein array. Protein
antibodies are immobilised onto the slide which capture specific (phospho)proteins of interest (analytes) from cell lysate (a single sample). The analytes are detected using a sandwich antibody (as in ELISA), together with a labelled secondary antibody, or the analyte can be labelled directly to allow detection. (b) Reverse phase protein array. Cell lysates (multiple samples) are spotted onto the microarray slide, which is then probed with a single (phospho)protein specific primary antibody. A labelled secondary antibody is used to detect the primary antibody. Multiple slides can be used, each probed with different antibodies, to detect different proteins of interest.
Figure reproduced from Sheehanet al.[2005].
dilution series (we explain dilution series further below). The array is then incubated with a primary antibody that binds specifically to the phosphoprotein of interest. This antibody is then detected using a labelled secondary antibody (as in ELISA and Western blot) and signal amplification. The emitted signal is quantified using a
software package. Full details of RPPA protocol can be found in Tibeset al. [2006]
and Hennessyet al.[2010]. If multiple microarray slides are spotted simultaneously
with the same samples, each slide can be probed with a different antibody, thereby providing readouts for multiple samples and multiple proteins [see e.g. Sheehan et al., 2005].
The samples are spotted onto the array in dilution series. Protein and phos-phoprotein concentrations can vary greatly, so accurate measurements over a wide dynamic range are required. The dynamic range of measurements is extended by diluting each sample several times and spotting onto the array at each dilution step. Hence, if the protein concentration in the original undiluted sample is near saturation, it can still be detected in the diluted samples. Dilution series also aid the accurate quantification of protein concentrations. Quantification is usually car-ried out using response curves, that relate the observed signal intensities to the (phospho)protein concentrations. The fact that a single antibody is used for the whole slide motivates the use of a single response curve for all samples on the slide. For the RPPA data used in this thesis, a logistic model was used for the response
curve (R package ‘SuperCurve’ developed by the Department of Bioinfomatics and
Computational Biology in MD Anderson Cancer Center [Huet al., 2007]).
There are two main types of protein microarrays, of which RPPAs are one. ‘Reverse phase’ refers to the fact that the cell lysate is immobilised on the slide and the array is probed with an antibody, which is a reversal of the procedure for antibody arrays, the other type of protein microarray. Antibody arrays are also referred to as forward phase protein arrays. For the antibody array, antibodies are immobilised onto the slide which capture proteins of interest from cell lysate. Each array spot contains a single type of antibody and the array is incubated with one sample only, providing readouts for multiple proteins from one sample (see Figure 2.4).
analytes; only 103cells are required for an RPPA experiment, compared with 108for
mass spectrometry and 105 for Western blotting. Therefore, while mass
spectrome-try is a promising approach, RPPA is currently more sensitive and cost-effective. An advantage of RPPAs over antibody arrays is that either fewer antibodies are required or samples do not need to be directly labelled to allow detection of the analyte of in-terest. This can improve robustness and reproducibility of results. Also, RPPAs can use denatured lysates (proteins in the lysate have lost their three-dimensional con-formation) which can allow antibodies to bind that previously would not have been able to do so, providing an advantage over tissue microarrays (another reverse-phase assay).
The main limitation of RPPAs is specificity of primary and secondary an-tibodies. The signal from a microarray spot could be due to cross-reactivity from unspecific binding and it is not possible to determine if this is the case from the RPPA results themselves. Therefore antibodies have to be carefully validated by
Western blotting prior to their use in RPPA assays. Hennessy et al. [2010] is an
example of such a validation study. The number of available validated antibodies is continuously growing.
RPPAs have been used in many studies to investigate cancer cell signalling,
both in cancer cell lines [Tibeset al., 2006] and in primary tumour samples [Sheehan
et al., 2005]. These studies include the profiling and comparison of active signalling pathways in different contexts; for example, between primary and metastatic
tu-mours [Sheehan et al., 2005] or between cancer subtypes [Boyd et al., 2008], the
identification of signalling biomarkers that are predictive of response to certain
anti-cancer agents [Boyd et al., 2008], the identification of optimal drug combinations
[Iadevaiaet al., 2010] and structure learning of signalling networks [Bender et al.,
2010]. For further studies see, for example, Spurrier et al. [2008]; Hu et al. [2007]
and references therein. RPPAs have promising utility in the development of per-sonalised therapies; using RPPAs to investigate and compare signalling profiles in patient tumour cells and normal cells, and to monitor changes in phosphorylation through time, both pre- and post-treatment, could provide information that guides the discovery and application of targeted therapies. Indeed, RPPAs are currently
involved in several clinical trials [Muelleret al., 2010].
2.3
Methodological background
This section begins by reviewing the linear regression model, which is a core com-ponent of all the approaches proposed in the following Chapters. Both frequentist maximum likelihood and Bayesian approaches to inference for the linear model are outlined and compared. Inference of graphical model structure is often cast as a model selection problem and this is the route we take in the work here. A general overview of model selection and model averaging, including standard methods, is given in Section 2.3.2. We describe the specific case of variable selection in regres-sion models in Section 2.3.3. In Section 2.3.4 we define and describe some technical details regarding directed and undirected graphical models. Methods for structure learning of graphical models are detailed in Sections 2.3.5 and 2.3.6. Several alterna-tive methods for structure learning of molecular networks, in addition to those based on graphical models, have been proposed in the literature. We give a brief overview of some of these approaches in Section 2.3.7. Section 2.3.8 provides background information on empirical Bayes methods and clustering techniques are considered in Section 2.3.9.
2.3.1 Linear regression model
Due to its simplicity, interpretability and applicability, the linear regression model is arguably the most widely used statistical model in data analysis. Interactions between signalling components are complex and non-linear in nature, and so a linear model is not likely to be the most accurate representation of the underlying process. However, as we shall see below, using a Gaussian linear model can result in closed form expressions for high dimensional integrals and thereby provides significant computation gains.
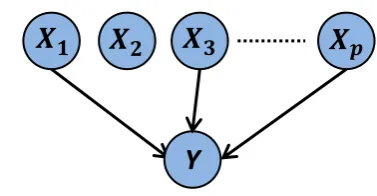
The linear regression model assumes that a response variable Y is a linear
combination ofp predictor variablesX1, . . . Xp,
Y =β0+
p
∑ j=1
βjXj+ (2.1)
where{βj}are unknown regression coefficients andis a zero-mean noise term. The
predictor variables Xj are often taken to be observed (experimentally measured)
values of variables under study. For example,Y could represent drug response and
Xj phosphorylation levels of cellular proteins. Alternatively, the predictor variables
could also be transformations of measured entities (e.g. log-transform) or basis
Xj =Xj forj=1, . . . , p, resulting inp predictor variables with the dependence ofY
on X given by a polynomial of degree p. In what follows, unless stated otherwise,
predictor variables correspond directly to observed values of the variables under study.
Given a dataset of n samples, let variables Yi and Xij denote the response
andj’th predictor in sampleirespectively. Then
Y=Xβ+ (2.2)
where Y = (Y1, . . . , Yn)T, X is the n× (p+1) design matrix with row i given by
(1, Xi1, . . . , Xip), β = (β1, . . . , βp)T and = (1, . . . , n)T. We make the standard
assumption that∼ N (0, σ2In) whereN denotes a Normal distribution, In is the
n×nidentity matrix and σ2 is unknown variance. The linear regression inference
problem is to determine the regression coefficients β from the data (X,Y). The
inferred coefficients can then be used for prediction on new data and to assess the relative importance of individual predictors in influencing the response. Below we describe frequentist maximum likelihood and Bayesian approaches to inference for the linear model.
2.3.1.1 Frequentist maximum likelihood inference approach
In a frequentist formulation parameters Θ = (β, σ2) are treated as fixed and
un-known, while the observed response data Y is regarded as a single realisation of
a repeatable process (with parameters Θ). We note that, in regression, predictor
data X is regarded as fixed and known. Probability statements are interpreted as
the limiting relative frequency as the number of repeats goes to infinity. Parameter estimation is based on the likelihood function,
L(Θ∣Y,X) =p(Y∣X,Θ) (2.3)
= N (Y∣Xβ, σ2I) (2.4)
The likelihood is the probability of observing the data given parameters Θ
(and predictor values X), and is a function of Θ, but not a probability density
function with respect to Θ. A standard approach to obtain parameter estimates
is by maximising the likelihood; that is, by selecting the parameters that give the
likelihood estimate (MLE) and we denote it by ˆΘMLE,
ˆ
ΘMLE=max
Θ L
(Θ∣Y,X). (2.5)
For the Gaussian linear regression model we have
ˆ
βMLE= (XTX)−
1
XTY ˆσMLE2 = 1
n∥Y−XβˆMLE∥
2
2. (2.6)
where ∥⋅∥2 is the Euclidean norm. We note that ˆβMLE is the same as the least
squares estimate forβand that ˆσMLE2 is a biased estimator. The unbiased estimator
s2
= n−np−1ˆσ2MLE is often used. Since these estimates are based on a single
realisa-tion of the data-generating process, estimarealisa-tion uncertainty is based on hypothetical data that could have been observed. In practice this is achieved using the sampling distribution of the MLE to perform hypothesis tests and obtain confidence
inter-vals; in regression the sampling distributions are ˆβMLE ∼ N (β, σ2(XTX)−1) and
(n−p−1)s2∼χ2n−p−1.
2.3.1.2 Bayesian inference approach
A Bayesian analysis of the linear model was first presented by Lindley and Smith
[1972]. In the Bayesian approach, the parametersΘare unknown, but are regarded
as random variables. Therefore, unlike in the frequentist approach, probability statements can be made regarding the parameters themselves. In particular, the
distribution over Θ given the observed data is of interest, p(Θ∣Y,X). By Bayes’
theorem we have,
p(Θ∣Y,X) = p
(Y∣X,Θ)p(Θ)
p(Y∣X)
(2.7)
∝p(Y∣X,Θ)p(Θ) (2.8)
wherep(Y∣X,Θ) is the likelihood (2.3) andp(Θ) is a prior distribution over
pa-rameters, assigning probabilities toΘbefore observing any response data 2. In the
Bayesian framework, probability is interpreted as ‘degree of belief’ and the prior dis-tribution allows subjective prior beliefs to enter the analysis. Thus, Bayes’ theorem combines, in a coherent manner, information about parameters from prior beliefs (the prior distribution) with information from the observed data (the likelihood),
2


![Figure 3.9: Drug response data; sensitivity to range of prior strength pa- ∈ [−]with an increased range oframeter](https://thumb-us.123doks.com/thumbv2/123dok_us/9648426.466956/111.595.223.422.104.287/figure-drug-response-sensitivity-range-strength-increased-oframeter.webp)