Abstract—An indispensable process while analyzing gene expression data is Feature Selection. This technique is applied to decrease the dimensionality of high dimensional gene expression data in order to achieve increased classification performance and lesser computational time complexity. The reduced feature subset not only improves the classifier accuracy but it also finds the most relevant genes which are the cause of certain diseases. Hence, it is important that feature selection technique must be stable in response of perturbation of the dataset, i.e, it should not reflect large changes in the feature subset if little changes are made in training dataset. In this paper, five feature selection techniques: Relief, Chi-square Feature Selection, Feature Selection based on Information Gain, Random Forest Feature Selection and Recursive Feature Elimination for SVM (RFE-SVM) are compared on the basis of Kuncheva Index stability measure. Moreover, experiments are performed on three microarray datasets to analyze how subset size affects the stability of these five feature selection algorithms. Through this extensive exercise, a complete view of stability of these five methods of feature selection is provided and there is an effort to ascertain its relations with subset size.
Index Terms—Dimensionality Reduction, Feature Selection, Filter Method, Gene Expression data, Wrapper Method
I. INTRODUCTION
ACHINE Learning algorithms generally do not perform
well, when applied on microarray data. This is because these datasets have large feature space and small sample size [1]. Hence, feature selection techniques are applied for decreasing the dimension of dataset to improve the results of learning algorithms. It is also referred to as gene selection when it applied to microarray data. It mainly serves two motives: 1) it reduces the dimension of data by removing non-relevant genes and increases the classification accuracy; 2) it helps in identifying the certain genes which are the cause of certain diseases. Hence, classification accuracy as well as the set of features, which are end products of feature selection, is what matters most in analysis of gene expression data. Therefore, it is necessary that with slight change or perturbation in the dataset, chosen feature set does not change [2], [3]. The feature selection techniques are said to be unstable if the chosen feature set changes; with the slight change in the training dataset. If
Manuscript received March 03, 2019; revised April 02, 2019. Shaveta Tatwani is with the Department of Computer Science and Engineering, Indira Gandhi Delhi Technical University for Women, New Delhi-110006,India(phone:+91-9540044112;e-mail:
Ela Kumar is with the Department of Computer Science and Engineering, Indira Gandhi Delhi Technical University for Women, New Delhi-110006, India (e-mail: [email protected]).
small changes result in significantly different conclusions, perhaps we should not trust the output as reflective of the true underlying mechanism. Especially, in biomedical science, the results could cause confusion and lead to loss of confidence in researchers to apply machine learning techniques. The objective of gene selection is not only to increase the accuracy to detect the disease but also to identify the genes which are responsible for a particular disease. Hence, we can conclude that while studying gene expression data, the stability of gene selection is also as significant as the accuracy of classifier. Jurman et al. [4] argue that having a stable selected gene set is important just as their predictive power.
The stability of any feature selection algorithm depends upon many factors [5], [6]. These factors include:
1) The number of dimensions ‘n’ of the dataset: The stability of feature selection process may be affected by larger feature space.
2) The count of features ‘k’ selected by feature selection algorithm: If the subset size is more, the chance of selection of any feature is more. Generally, in the existing feature selection techniques, subset with minimum features which would result in the best predictive accuracy are chosen without considering stability in designing the feature selection technique. 3) The sample size ‘m’: The feature selection algorithm
will be less stable if the sample size is small. It is experimentally proven that small sample in larger attribute space is one of the cause of instability [7], [8]. 4) Data variance: It was proven in the study by Han et.al.
[9] that the stablility the feature selection is highly impacted because of data variance.
Most of the work done on the subject of feature selection by the researchers focuses on measuring the stability of these algorithms. Many stability indices are proposed based on Tanimoto distance, Correlation coefficient, Hamming distance, Consistency Index, Kuncheva Index (KI), Shannon Entropy and there are many more. Secondly, these works consider the stability of single method, whereas a few researchers also designed the measures to investigate the stability of ensemble of feature selectors [10] [11]. Moreover, stability of these methods has been examined separately; only few works have been done to compare feature selection methods using same stability metric. In this paper, we have examined how the five methods of feature selection are related in terms of stability, and tried to discover what pattern arises when the subset size of feature selection method is varied.
Effect of Subset Size on the Stability of Feature
Selection for Gene Expression Data
Shaveta Tatwani, Ela Kumar
II. LITERATUREREVIEW
A wide variety of subset selection algorithms have been applied for many years and evaluated on the basis of classification accuracy, however, a relatively little attention has been given to evaluate these techniques on the basis of stability. Moreover, mainly existing work in this area are focused on how to assess efficiently the stability of given feature selection technique. These stability indices can be categorized on the basis of representation of subset selection’s output into three main categories: index-based stability measure, rank-based stability measure and weight-based stability measure [12], [13]. The output of feature selection method is the subset of useful features, and their usefulness is calculated either on the basis of weight, or some rank or it simply select a small subset. The index-based stability measure considers only the indices of the selected features ignoring the order of their selection. Hence, in these methods, the stability is calculated based only upon the similarity of two subsets. In rank-based stability measures, the ranks given by the feature subset selection have an influence on the stability of subset selection. In the weight-based stability measure, the stability of algorithm depends upon the weight accorded to each individual feature while considering their degree of relevance.
The significant work done in the field of stability is by A. Kalousis [14]. He proposed three types of similarity metrics, which can be applied in any field independent of the learning model on basis of the different categorization of the feature selection algorithm as stated above. Kalousis proposed three measures based on three different categorizations: Pearson’s correlation coefficient as weight-based stability measure, Spearman’s correlation coefficient as rank-based stability measure and Tanimoto distance for index-based similarity measure. Tanimoto similarity metric is one of the generally used similarity metrics as it does not consider the order of features, but simply calculates the number of similar features between two subsets. Hence, it is a well-known method because of its simplicity and computational efficiency. If s1 and s2 are two subsets of features, then
The output of Tanimoto distance is in the range of [0–1], where 0 represents two feature subsets s1 and s2 which are completely different; whereas 1 represents that s1 and s2 subsets are identical.
However, upon further investigation and findings by Kuncheva [15] and Lustgarten [16], Tanimoto index measure has the disadvantage to handle ‘By chance’ condition. This arises because if the cardinality of selected two features subsets are more; there will be more overlap between them due to chance. Moreover, once the cardinality of features subset draws close to the total count of features, the output of Tanimoto distance is nearly 1. To overcome this condition, Kuncheva proposed KI. To avoid the condition of by chance that may arise between the two subsets of features, KI has a correction term, which is further discussed in section IV.
Dunne proposed similarity measure based on the
Hamming distance [1]. Hamming Distance measure the amount of overlap between two subsets. It gives value ‘1’ to a feature if a feature is selected and gives value ‘0’ if it is not selected. Percentage of Overlapping Gene (POG) stability measure calculates the consistency of two genes subsets [17]. Canberra Distance is also used for stability measurement [3]. It is based on rank-based stability measure which calculates the absolute difference between two feature subsets.
A little research work has also been conducted in evaluating and comparing the stability of the existing feature selection techniques. Z. He and W. Yu [18] studied the reasons behind the instability of subset selection techniques and proposed the framework based on the method used by different techniques to handle instability. Somol and Novoviˇcov´a [19] evaluated the various stability measures available in literature and discussed the subset size bias problem in existing stability metrics. They also devised the weighted consistency metric to overcome this problem. They used both simulated and real data for their experimental work and compared the stability of different feature selection techniques. A Dense Relevant Attribute Group Selector (DRAGS) framework for stable feature selection is also proposed that is based on feature grouping technique i.e. it selects the feature groups containing features which are redundant rather that selecting individual features [20]. The extension of KI for different feature subset sizes is given by Lustgarten et al. [13]. They applied this metric on three subset selection techniques which are wrapper-based: Logistic Regression, Naive Bayes, and SVM and compared the results with the Jaccard index. Extensive experimental work has been done by Haury et al. [21] to compare a variety of different feature selection based on classifier accuracy and stability measure. R. Wald et al. [22] compared the five filter ranking method, two filter feature subset evaluation methods, and five wrapper subset methods on the Tanimoto stability metrics and concluded that feature ranking methods are more stable than other two methods. A hybrid feature selection method is proposed by Brahim and Limam which improves both classifier accuracy and stability [23]. In this work, the filter method is based on instance learning and the wrapper technique uses the cooperative feature subset search to select the optimal feature subset. Further, an extensive work on the stability measures has been done by Sarah Nogueira, Konstantinos Sechidis and Gavin Brown [24][25].
methods: filter and wrapper methods are considered and discussed below.
A. Filter Methods
The stability of three filter methods: Relief Algorithm, Chi-square and Feature Selection Based on Information Gain are studied in this empirical work. In the Relief Algorithm [26], the relevant features are selected and the relevance is calculated based upon Euclidean distance. This is iteration method in which at each iteration, Relevance Weight of each feature is calculated and updated depending upon the Euclidean distance of the feature from the instance of same class (Hit) and instances of different class (Miss) given by:
where, RW is Relevance Vector and x is the given feature. Thus the weight of given features decreases if it is distant from the instance of the same class than the instance of the different class. This step is repeated n-times, where n refers to the sample size. After n steps, the relevance weight is divided by n to find the average relevance weight. This method selects only those features in cases of which the relevance weight exceeds the threshold figure that is provided and hence the irrelevant characteristics are screened out.
Chi-square is a statistics based feature selection method [27]. It calculates the interdependency of each feature with its class. If the class variable is dependent on a feature variable, then that feature variable is important and selected for feature subset selection. It is calculated and given by:
where, Oi denotes the number of observations in class i and Ei is number of expected observations in class i, if there is no relationship between feature and class.
Information Gain is a measure of the accuracy with which one variable could be predicted when value of other mutual variable is known. In case of these Feature Selection Problems, these two random variables could be two mutual features or it could also be one feature and its associated class. It is defined as [28]:
where, H (X) denotes the entropy of discrete random variable X and H (X | Y) refers to the conditional entropy which tells about the uncertainty of random variable X when value of Y is given.
B. Wrapper Methods
Guyon I. et al. [29] proposed the wrapper-based Recursive Feature Elimination for Support Vector Machines (RFE-SVM) method. This method is based on iterative procedure with three main stages. To start with, it trains the SVM classifier, then in second step it calculates the ranks of each feature based on weight given by the SVM and in the final phase it removes the features having the lower rank. This method has been experimentally proven better (Mundra and Rajapakse, 2010) for Feature Selection and classification problem on microarray data as compared to
other correlation based Feature Selection methods.
Random Forests is also used as feature selection in data mining and machine learning [30]. It is based on decision-tree strategy which naturally ranks the features. It calculates the feature importance or purity of a node by using Gini Index. A node with highest importance is kept at the start of the tree, while nodes, which are less important, occur at the end of trees. Thus, a selection of a subset of important features can be done by pruning trees below a particular node.
IV. EXPERIMENTALSETUP A. Feature Selection Methods
The five feature selection method: Relief, Chi-square Feature Selection, Feature Selection on the basis of Information Gain, Random Forest Importance Feature Selection and Recursive Feature Elimination for SVM (RFE-SVM) are applied to select the subset of features. Out of these five, first three are filter methods and fourth–fifth one, Random Forest and Recursive Feature Elimination for SVM (RFE-SVM), are wrapper methods. The reason behind the method chosen is that we want to compare the stability of filter and wrapper methods.
B. Datasets
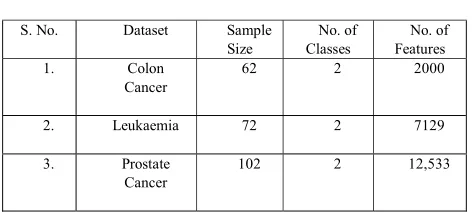
[image:3.612.312.548.410.516.2]We performed the selected feature selection method on three datasets. These datasets are available in R package ‘datamicroarray’ [30] which are described below in Table I:
TABLE I DATASETS
The Colon Cancer data includes the gene expression data of about 2000 genes and 62 samples taken from colon-cancer patients. Out of these 62 samples, 40 are tumorous labelled as ‘negative’ and 22 are non- tumorous labelled as ‘positive’
The Leukaemia dataset consist of 72 samples of different patient, out of which 25 patients are having acute myeloid leukaemia (AML). The numbers of acute lymphoblastic leukaemia (ALL) samples are 47. The feature space of data has 7129 gene expressions.
Prostate Cancer Dataset contains probes for approximately 12,533 genes and 102 samples. Out of 102 samples, 52 tumour samples and 50 non-tumour samples are detected.
S. No. Dataset Sample Size
No. of Classes
No. of Features 1. Colon
Cancer
62 2 2000
2. Leukaemia 72 2 7129 3. Prostate
Cancer
C. Stability Measure
The stability of feature selection methods are compared based on Kuncheva Index (KI), which is based on set similarity and is given by:
where, s1 and s2 are subsets of features having same size
r = number of elements in intersection of s1 and s2
𝑘 = subset size of s1 and s2
𝑛 = total number of features
The output of KI is between [-1, 1], where 1 represents that the two subsets are identical. KI gives value -1 for 𝑘=𝑛/2 and 𝑟=0 and the value of the index is not specified for 𝑘=0 and 𝑘=𝑛.
V. RESULTSANDDISCUSSION
[image:4.612.313.531.47.200.2]All the involved algorithms are implemented in R 3.5.1. To evaluate the stability of the five feature selection techniques, independent training and validation sets have been generated from the aforementioned datasets. The training dataset has undergone a slight variation of 10% to measure the stability. The random sampling of training dataset is repeated 10 times with 90% of overlap, and KI is averaged over all samples. The KI value has been scaled from its original [-1,1] range to [0,1]. The Relief, Chi-square, Feature Selection based on Information Gain, Random Forest Importance and RFE-SVM methods are successfully implemented and results are summarized in Tables II-IV and Figures 1–3.
TABLE II
COMPARISON OF STABILITY OF VARIOUS FEATURE SELECTION METHOD WITH VARYING SUBSET SIZE BASED UPON THE KI ON
COLON CANCER DATASET Kuncheva Index
S.
No. Subset Size
Information
Gain Chi-square RELIEF Rando
m Forest
RFE-SVM
1 10 0.75 0.75 0.65 0.54 0.70
2 20 0.80 0.77 0.65 0.62 0.70
3 30 0.80 0.78 0.64 0.66 0.73
4 40 0.78 0.80 0.65 0.63 0.78
5 50 0.85 0.85 0.66 0.64 0.78
6 100 0.85 0.84 0.66 0.69 0.81
7 200 0.89 0.88 0.67 0.66 0.82
8 500 0.96 0.96 0.61 0.59 0.82
9 800 0.97 0.97 0.60 0.65 0.81
10 1,000 0.98 0.98 0.58 0.87 0.80 11 1,100 0.98 0.98 0.58 0.87 0.79 12 1,200 0.98 0.98 0.57 0.87 0.77 13 1,300 0.98 0.98 0.57 0.88 0.74 14 1,400 0.98 0.98 0.57 0.88 0.74 15 1,500 0.98 0.98 0.57 0.88 0.70
Fig. 1: Comparison of stability of various feature selection method with varying subset size based upon the KI on Colon Cancer dataset.
TABLE III
COMPARISON OF STABILITY OF VARIOUS FEATURE SELECTION METHOD WITH VARYING SUBSET SIZE BASED UPON THE KI ON
LEUKAEMIA DATASET
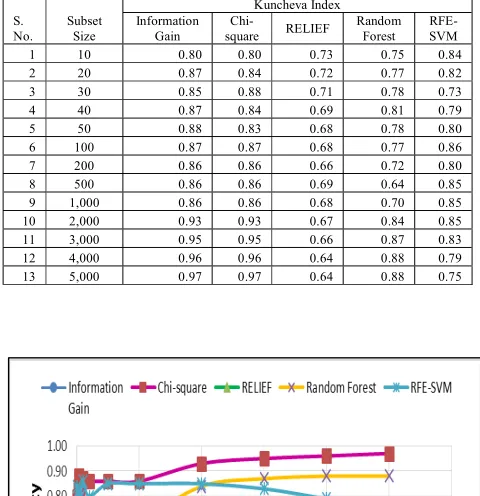
Fig. 2: Comparison of stability of various feature selection method with varying subset size based upon the KI on Leukaemia dataset
Kuncheva Index
S. No.
Subset Size
Information Gain
Chi-square RELIEF
Random Forest
RFE-SVM 1 10 0.80 0.80 0.73 0.75 0.84 2 20 0.87 0.84 0.72 0.77 0.82 3 30 0.85 0.88 0.71 0.78 0.73 4 40 0.87 0.84 0.69 0.81 0.79 5 50 0.88 0.83 0.68 0.78 0.80 6 100 0.87 0.87 0.68 0.77 0.86 7 200 0.86 0.86 0.66 0.72 0.80 8 500 0.86 0.86 0.69 0.64 0.85 9 1,000 0.86 0.86 0.68 0.70 0.85 10 2,000 0.93 0.93 0.67 0.84 0.85 11 3,000 0.95 0.95 0.66 0.87 0.83 12 4,000 0.96 0.96 0.64 0.88 0.79 13 5,000 0.97 0.97 0.64 0.88 0.75
[image:4.612.318.558.312.560.2]TABLE IV
COMPARISON OF STABILITY OF VARIOUS FEATURE SELECTION METHOD WITH VARYING SUBSET SIZE BASED UPON THE KI ON
PROSTATE CANCER DATASET
Kuncheva Index
S. No. Subset Size
Informat ion Gain
Chi-square RELIEF Random
Forest RFE-SVM
1 10 0.75 0.79 0.67 0.75 0.80
2
20 0.82 0.82 0.67 0.77 0.89
3 30 0.84 0.86 0.65 0.79 0.88
4 40 0.86 0.88 0.65 0.80 0.88
5
50 0.89 0.86 0.64 0.78 0.84
6 100 0.85 0.88 0.65 0.73 0.85
7 200 0.86 0.88 0.66 0.70 0.89
8
500 0.87 0.91 0.67 0.65 0.88
9 1,000 0.88 0.85 0.70 0.60 0.88
10 2,000 0.91 0.91 0.72 0.70 0.89
11
3,000 0.94 0.94 0.72 0.80 0.89
12
4,000 0.95 0.95 0.70 0.84 0.89
13 5,000 0.96 0.96 0.70 0.85 0.89
14
6,000 0.97 0.97 0.69 0.87 0.86
15
7,000 0.97 0.97 0.69 0.87 0.85
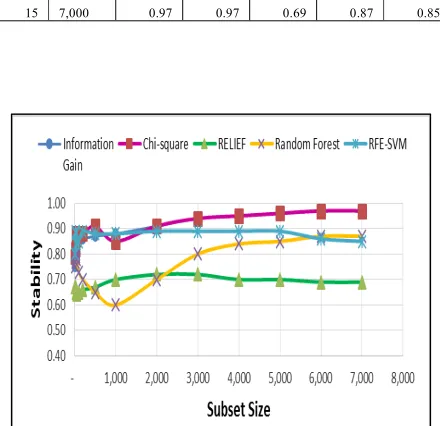
Fig. 3: Comparison of stability of various feature selection method with varying subset size based upon the KI on Prostate Cancer dataset
From the above table and graphs, the summarized results can be stated as follows:
1) The resulting data depicts that the stability achieved by Information Gain and Chi-square, the two filter methods are better than the Wrapper methods: Random Forest and RFE-SVM results. The reason behind this is that filter methods selects the features depending upon the weights or rank assigned to each feature whereas in wrapper methods, it depends upon the searching
criterion that selects the feature subset, which are generally based on some stochastic or heuristic function. 2) In contrast, Relief filter method performs worst on all three gene expression datasets. This method suffers from instability due to randomly selection of instances from same and different class for each feature weight calculation.
3) The graphs show very clearly and significantly that Chi-square and Information Gain Feature Selection behaves similarly on three datasets without any significant difference. They are quite stable and their stability increases with increase in size of feature subset. 4) It can be seen that RFE-SVM outperforms Random
Forest method for small subset size.
5) RFE-SVM behaves differently with varying subset size. The stability of RFE-SVM first increases with increase in subset size and then it starts decreasing.
VI. CONCLUSION
The performance of any feature selection method on high-dimensional microarray data depends not only upon the accuracy of classifier, but also on the stability of that method used. Hence, it is important to distinguish the stable feature selection method, that would be best suited for microarray data. In order to achieve this, we have tested five feature selection methods on three high dimensional microarray datasets. The Relief Algorithm, Chi-square, Feature Selection based on Information Gain, Random Forest and Recursive Feature Elimination for SVM (RFE-SVM) are successfully compared on the basis of Kuncheva Index stability measure. Also, the stability is measured with varying subset size selected for feature selection. The two filter methods: Information Gain and Chi-square method outperforms other methods in terms of stability. From the results, it can also be concluded that stability of these two methods increases with subset size.
REFERENCES
[1] Z.M. Hira and D.F. Gillies, “A review of feature selection and feature extraction methods applied on microarray data,” Advances in Bioinformatics, ID 198363, pp. 1-–13, 2015.
[2] K. Dunne, P. Cunningham, and F. Azuaje, “Solutions to instability problems with sequential wrapper-based approaches to feature selection,” Department of Computer Science, Trinity College, Dublin, Ireland, Technical Report TCD-CD-2002-28, 2002. [3] G. Gulgezen, Z. Cataltepe, and L. Yu, “Stable and accurate feature
selection,” in Proc. ECML/PKDD (1),2009, pp. 455–468.
[4] G. Jurman, S. Merler, A. Barla, S.Paoli, A. Galea, C. Furlanello, “Algebraic stability indicators for ranked lists in molecular profiling Bioinformatics,” vol. 24, no. 2, pp. 258–264, Jan 2008.
[5] S. Alelyani and H. Liu, “The Effect of the Characteristics of the Dataset on the Selection Stability,” 1082-3409/11 IEEE DOI 10.1109/International Conference on Tools with Artificial Intelligence.2011.167, 2011.
[6] S. Alelyani, Z. Zhao, and H. Liu, “A Dilemma in Assessing Stability of Feature Selection Algorithms,” 978-0-7695-4538-7/11, IEEE DOI 10.1109/. International Conference on High Performance Computing and Communications. 2011.99, 2011.
[7] S.Y. Kim, “Effects of sample size on robustness and prediction accuracy of a prognostic gene signature,” BMC Bioinformatics, vol. 10:147, 2009.
[image:5.612.74.294.349.562.2][9] Y. Han and L. Yu, “A Variance Reduction Framework for Stable Feature selection,” in Proc. 2010 IEEE International Conference on Data Mining, pp. 206–215.IEEE.
[10] Y. Saeys, T. Abeel, and Y. Van de Peer, “Robust feature selection using ensemble feature selection techniques,” in Proc. of Machine Learning and Knowledge Discovery in Databases, 2008.
[11] S. Nogueira and G. Brown, “Measuring the stability of feature selection with applications to ensemble methods,” in Proc. Int. Workshop Multiple Classifier Syst., 2015, pp. 135–146.
[12] P. Mohana and K. Perumal, “A Survey on Feature Selection Stability Measures,” International Journal of Computer and Information Technology, vol. 5, no 1, pp. 98–103, Jan 2016.
[13] S. Loscalzo, L Yu, and C Ding, “Consensus Group Stable Feature Selection,” in Proc. 15th ACM SIGKDD International conference on knowledge discovery and data mining, 2009, pp. 567–575.
[14] P. J. Kalousis and M. Hilario, “Stability of feature selection algorithms: a study on high-dimensional spaces,” Knowledge and Information Systems, vol. 12, no 1, pp. 95–116, May 2007. [15] L. I. Kuncheva,” A stability index for feature selection,” in Proc. 25th
IASTED International Multi Conference: Artificial intelligence and applications, Anaheim, CA, USA, 2007, pp. 390–395.
[16] J. L. Lustgarten, V. Gopalakrishnan, and S. Visweswaran, “Measuring stability of feature selection in biomedical datasets,” in Proc. AMIA 2009 Annual Symposium, pp. 406–410.
[17] M. Zhang, L. Zhang, J. Zou, et al. “Evaluating reproducibility of differential expression discoveries in microarray studies by considering correlated molecular changes,” Bioinformatics, vol. 25, no 13, pp. 1662–1668, Jul 2009.
[18] Z. He and W. Yu, “Stable feature selection for biomarker discovery,” Computational Biology and Chemistry, vol. 34, no. 4, pp. 215-225, 2010.
[19] P. Somol and J. Novoviˇcov´a, “Evaluating stability and comparing output of feature selectors that optimize feature subset cardinality,” IEEE Transactions on Pattern Analysis and Machine Intelligence, vol. 32, no. 11, pp. 1921–1939, 2010.
[20] L. Yu, C. Ding, and S. Loscalzo, “Stable feature selection via dense feature groups,” in Proc. 14th ACM SIGKDD International Conference on Knowledge discovery and data mining, ser. KDD ’08., New York, NY, USA, 2008, pp. 803–811.
[21] A.C. Haury, P. Gestraud, and J.P. Vert, “The influence of feature selection methods on accuracy, stability and interpretability of molecular signatures,” PLoS ONE, vol. 6, no. 12, e28210, 2011. [22] R. Wald, T. Khoshgoftaar, and A. Napolitano, “Comparison of
Stability for Different Families of Filter-Based and Wrapper-Based Feature Selection," in Proc. 12th International Conference on Machine Learning and Applications (ICMLA), Miami, FL, USA 2013.
[23] A. B. Brahim, Md. Limam, “A hybrid feature selection method based on instance learning and cooperative subset search,” Pattern Recognition Letters, vol. 69, pp. 28–34, 2016.
[24] S. Nogueira, K. Sechidis, and G. Brown, “On the Use of Spearman’s Rho to Measure the Stability of Feature Rankings,” in Lecture Notes in Computer Science: Pattern Recognition and Image Analysis, vol. 10255. Springer, Cham, 2017.
[25] S. Nogueira, K. Sechidis, and G. Brown, “On the Stability of Feature Selection Algorithms,” Journal of Machine Learning Research, vol. 18(174), pp 1−54, 2018.
[26] K. Kira, and L. Rendell, “The feature selection problem: traditional methods and a new algorithm,” in Proc. Association for the Advancement of Artificial Intelligence Conference, Cambridge, MA, USA: AAAI Press and MIT Press, 1992, pp. 129–134.
[27] S. Vanaja and K. Ramesh Kumar, “Analysis of Feature Selection Algorithms on Classification: A Survey,” International Journal of Computer Application, vol 96, no. 17, July 2014.
[28] R. Battiti, “Using mutual information for selecting features in supervised neural net learning,” IEEE Transactions on Neural Networks, vol. 5, pp. 537–550, 1994.
[29] I. Guyon, J. Weston, S. Barnhill, and V. Vapnik, “Gene selection for cancer classification using support vector machines,” Machine Learning, vol. 46, no. 1-3, pp. 389–422, 2002.