GRAPHICAL REPRESENTATION OF TEXTUAL DATA
USING TEXT CATEGORIZATION SYSTEM
Akshay Kumar
1, Vibhor Harit
2, Balwant Singh
3, Manzoor Husain Dar
4
1
M.Tech (CSE), Kurukshetra University, Kurukshetra, (India)
2
H.O.D-CSE Dept., NIIT (U.P.T.U), (India)
3
CSE Dept., RVIT (U.P.T.U), M.S. (BITS, Pilani) , (India)
4
M.Tech (CSE), Kurukshetra University, Kurukshetra, (India)
ABSTRACT
This paper presents the graphical representation of textual data using text categorization; we had concentrated on the compact representation of the document. Text Categorization has become an important task in data mining (text mining) because of the development of electronic commerce over the internet. All organizations that have business based on internet need an effective categorization method for managing large amount of textual data which is available in various forms like sales orders, summary documents, emails, journals and memos etc.
Here we have used both globalized as well as localized feature selection methods. The localized method that we have introduced has also improved the accuracy of the classifier. The classifier that we have used is K-NN that is K nearest neighbor. The K-NN is simple and is having better precision in classifying a document. Also this K-NN does not need any training resources or model to be built up and it categorizes on the fly .Therefore its cost is also less as no resources need to be trained and accuracy is also better than any other classifier.
Keywords: K-NN Classification Technique, K-Nearest Technique
I INTRODUCTION
In the following section we have the details regarding introduction to text categorization system, motivation for the project and objectives. The section also includes the details of related previous work also.
1.1 Introduction
Text Categorization has become an important task in text mining because of the development of internet. All
Text mining has been one of the fastest growing research fields for the past few decades. Text
Categorization also known as text classification is the task of automatically sorting a set of documents into categories from a predefined set on the basis of its content. This task that falls at the crossroads of information retrieval (IR) and machine learning (ML), has witnessed a booming interest in the last few years from researchers and developers alike.
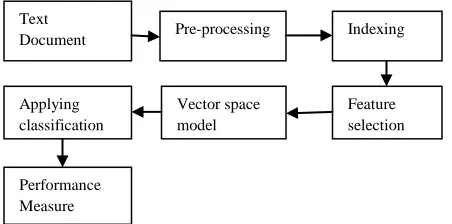
A text categorization system works like as shown in the figure 1.1. We give test document as input and we have stored a number of training categories. When a test document is given as input, the categorization system which is a classifier uses some algorithm to classify a particular document into its category. Normally we need to build a learning model to train the categories so that the classifier can easily classify the incoming test document to its categories by using learning algorithm.
Test Document
Trained Categories
Figure 1.1 Text Categorization Systems
1.2 Motivation
Text classification is attractive because it frees organizations from the need of manually organizing document bases, which can be too expensive, or simply not feasible given the time constraints of the application or the number of documents involved. The K-NN algorithm is simple and with high precision for classifying the documents. So graph based K-NN forms the base for the project as its classification speed is accurate and also the K-NN is a best classifier among the available classifiers. Although K-NN‟s precision is accurate but its time complexity is directly proportional to the size of the sample document because for a particular test document we have to compare it with all the training documents one by one. So we need a compact representation of the document.
1.3 Project Objective
1.4 Scope Of The Project
1. Literature survey of various existing feature selection methods. a. Mutual Information
b. Regularized mutual information c. CHI statistics
d. Document frequency – Inverse document frequency e. Category term descriptor
2. Implementation of the graph based K-NN algorithm with MI+CHI as feature selection method and existing similarity calculation algorithm.
3. Design the existing graph based K-NN algorithm with the globalized feature selection method that is RMI (regularized mutual information) + CHI (x square statistics) and newly discovered feature selection method WT (weight of terms) and improved similarity calculation algorithm.
4. Implementation of the modified graph based K-NN algorithm using the newly discovered effective feature selection methods and improved similarity calculation algorithm.
5. And finally testing with dataset which is REUTERS – 21578.
II LITERATURE SURVEY
This section includes the description of various research papers which forms the base of the project and helped in coming up with new methods and approaches to have effective and better text categorization. It is divided into three subsections including the details starting from introduction to-
2.1 Text categorization system,
2.2 Text categorization with the help of standard classifier that is K-NN,
2.3 The graph based K-NN text categorization.
2.1 Text Categorization
Figure 2.1 Traditional Text Categorization
2.2 K Nearest Neighbor Based Text Categorization
K-NN is a lazy learning method as no model needs to be built (learned) and nearly all computation takes place at the classification stage. K-NN is an example based classification method, it needs to compute the similarity between the document to be classified and all sample documents. Hence its time complexity is directly proportional to the size of the sample document. Thus it is a great challenge to improve NN‟s classification speed while not weakening K-NN‟s advantage of high precision.
2.3 Graph Based K-NN Text Categorization
The graph based model showed that it outperformed the traditional vector space model. However, classification accuracy was improved but classification speed was not improved as expected. Wang and Liu (2009) proposed graph based Chinese text categorization. Here in this text was represented as a graph and a centroid feature matrix was constructed by using nodes and edges, and this feature matrix represented the whole document. The results have shown that graph based model is better than vector space model. Here, also we have graph based representation of the text and also it considered the word order and co-occurrences of the words in a document. The results have again shown that it outperformed the vector space model but as K-NN was used (does not use any training resources and classifies on the fly) its accuracy was improved but its speed was again an issue of concern. So there was a need to have effective feature selection and similarity calculation methods so as to improve the speed of the classification.
III SYSTEM DESIGN AND METHODOLOGY
In this section we will give detailed description of graph based K-NN text classification along with the improved proposed system methodology. It will also include the details of various modules as well as the proposed system methodology diagram.
Text
Document Pre-processing Indexing
Applying classification
Vector space model
m
Feature selection
3.1 Introduction to Graph Based K-NN Text Classification
A graph representation comes across as a natural choice for representing complex relationships because it is relatively simple to visualize as compared to a textual representation. The various associations between objects in a complex structure are easy to understand and represent graphically.
3.2 System Description in Detail
3.2.1 Pre-Processing
A document usually contains a number of unnecessary words that can adversely affect the categorization process and do not help in identification of the document. Several techniques have been used for pre-processing the documents in order to prune the size of input to retain only interesting words. Therefore, prior to representing the documents as graphs, the documents are pre-processed by these consequent techniques.
3.2.1.1 Stop Word Elimination
Stop words, such as conjunctions, articles and even common words that occur frequently across all documents, are eliminated. Some of the more frequently used stop words for English include “a”, “of”, “the”, “I”, “it”, “you”, and “and”. These are generally regarded as „functional words‟ which do not carry meaning (are not as important for communication). The assumption is that the meaning can be conveyed more clearly, or interpreted more easily, by ignoring these functional words.
3.2.1.2 Stemming
Stemming is the process of reducing the words to their roots/base. This process reduces the number of unique words throughout the documents and also aids in classification.
3.2.2 Feature Selection
This process removes the most irrelevant and redundant features from data and also helps improve the performance of the algorithm. We have used a combination of feature selection methods as well as a new localized method of feature selection. The combination that we have used are of RMI [Regularized Mutual Information] and CHI square statistics, and another method is known as WT [Weight of Terms], in which TF-IDF is used with MI in combination. The TF –IDF considers the terms which are high frequency and also those which are very rarely in any other documents .However, IDF‟s precision is sometimes not accurate because it depends on the number of documents. Therefore we have replaced IDF with MI as MI is more useful in considering the terms which appear rarely. The use of such type of combination had shown that the performances of localized methods of feature selection are more or less the same as that of standardized methods.
3.2.2.1 Mutual Information
It is used to measure the mutual dependence of the two terms in a paragraph or in a document. The formula used for mutual information to calculate mutual dependence between term t and category c is
3.2.2.2 CHI Square Statistics
It is used to measure the lack of independence between the term w and the category c. If w and c are independent then the CHI will have a lowest value of 0. Its formula is
CHI (w,c) = N * ( P(w,c) *P (͞w ,͞c –) P(w,͞c ) * P(͞w,c)) / P(w)* P(͞w) *P(c) *P(͞c)
Where N is the total number of documents in the training set, P(w,c ) is the probability when term w and category c appear simultaneously, P(w) is the probability of w in the document d and P(c) is the probability when the text belong to category c. P(͞w , c ) is the probability that word do not occur in the category, P(͞w , ͞c) is the probability that word w and category do not appear simultaneously.
In the modified approach we will implement the existing algorithm with RMI and CHI.
3.2.2.3 Regularised Mutual Information
Regularized mutual information measures the relevance of a term in a category. It is effective than mutual information and do not take into account the numerical values. Its formula is
RMI = 2MI (t,c) / H[t] +H[c] .
3.2.2.4 Weight of Terms
It is formed by replacing IDF [Inverse Document Frequency] in TF-IDF. It is used to measure the weight of terms appearing frequently as well as rarely in the document.
WT = TF (t) .MI (t,c)
3.2.3 Graph Representation
A graph is represented as a 3 tuple: G (V, E, FWM), where V is set of nodes and E is the collection of weighted edges connecting the nodes, FWM (Feature weight matrix) is defined as feature weight matrix of edges.
Nodes = Feature terms selected from the test set after feature selection method.
Edges = Constructed based on the order and co-occurrences relationship between the feature terms.
3.2.4 K-NN Classification Based On Graph
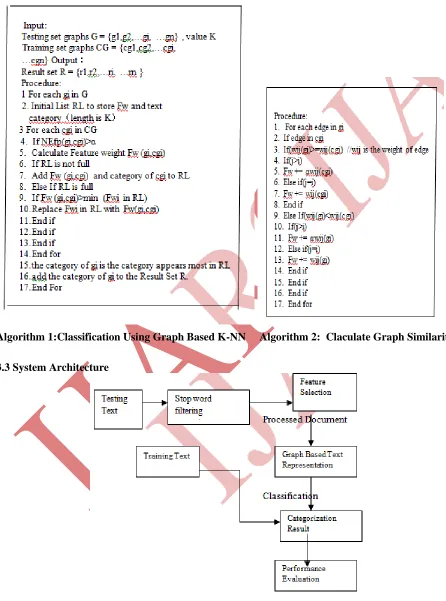
The classification of documents is done using graph based K-NN algorithm in which we consider the ratio of both node and edge fit percent. The input will be the test categories and the output will be the category of that particular test document.
Algorithm 1:Classification Using Graph Based K-NN Algorithm 2: Claculate Graph Similarity
3.3 System Architecture
IV CLASSIFICATION PERFORMANCE
In this section we have given the details of data set used, the number of documents used and the categories which are selected for the classification. The section also includes the implementation details along with the results and graph.
4.1 Data Set
The data set used for the project is REUTERS -21578. It is a collection of news stories related to different categories. The different categories are health, education, science, sports, movie, business, and travel. We have used only five categories of the above mentioned classes and they are health, science, business, sports, and education. The number of different categories used for classification is given in table 4.1. The features selected in both training and testing set are shown in table 4.2.
Table 4.1 Corpus Statistic
Table 4.2. Features Selected
4.2 Performance Measure for Classification
To evaluate the classification performance, we use the standard measures in test categorization tasks Precision, Recall and F1. For a given category i, precision, recall and F1 are defined as
RECALL = a / (a + b) PRECISION = a / (a + c)
Where a = number of documents correctly assigned, b = number of documents incorrectly assigned, c = number of documents rejected incorrectly.
The F1 percent is defined as
F1 = 2*Precision*Recall / Precision + Recall
We have averaged the F1% to evaluate the overall performance of the algorithms on given dataset. The averaged F1 computes the F1 values for each category and then takes the average over the per-category F1 scores. Given a training dataset with m categories, assuming the F1 values for the i-th category is F1(i), the macro averaged F1 is defined as Macro Averaged F1 = ∑ F1(i) / m
Category
Testing Set
[Feature /words
selected]
Training Set
Business 369 515
Health 341 495
Sports 329 540
Education 266 602
Science 375 478
Category No. Of documents
Business 22
Health 29
Sports 29
Education 22
4.3 Experimental Results
The results obtained after the performance calculation are shown in the table 4.3, 4.4, and 4.5. Table 4.3 The Categorization Result Using GKNN Algorithm Table 4.4 The Categorization Result Using Improved GKNN Algorithm [RMI+CHI]
Table 4.5 The Categorization Result Using Improved GKNN Algorithm [WT]
Table 4.3 Table 4.4
Category Recall % Precision % F1%
Business 66.66 80.00 72.72
Health 62.50 83.30 71.42
Education 60 100 75
Science 71.42 100 83.32
Sports 80 80 80
Average 68.11 88.66 76.49
The results obtained after using RMI+CHI as the feature selection method and implementing with the newly discovered similarity calculation algorithm is shown in the table 4.4. It has shown that the classification accuracy has improved.
The table 4.5 shows the results obtained after using newly discovered feature selection method WT and similarity calculation algorhm.
Table 4.5
Category Recall % Precision % F1%
Business 85.71 100 92.30
Health 87.5 87.5 87.5
Education 80 100 88.88
Science 83.88 83.33 83.33
Sports 100 83.33 90.90
Average 87.30 90.83 88.58
19
Category Recall % Precision % F1%
Business 83.33 83.33 83.33
Health 75 85 79.6
Education 75 75 75
Science 85.71 100 92.30
Sport 83.33 100 90.90
4.4 Result Analysis
The results for f1% calculated after using all the three methods of features selection were then plotted in the graph. The X-axis denotes the f1% percent for all five categories of the dataset. The Y-axis denotes the different features selected for the categories.
The graph clearly shows that the use of WT as feature selection method had improved the classification accuracy of the algorithm. The RMI+CHI had also improved the accuracy but not better than WT method. It is already proved that using single mutual information has inferior performance compared to other methods due to a bias favoring rare terms and strong sensitivity to probability estimation errors. Although use of mutual information with TF-IDF is just an ad hoc approach to improve the efficiency but the results have shown that it is a reliable measure for selecting informative features or words.
The main observations that we had obtained after analysis of the results are as follows: 1. CHI is normalized and scores obtained are comparable across the same category.
2. Using WT had boosted the performance with the fact that rarely occurring words are effective in classifying a document.
3. Combining good methods with little or no correlation improved the results of classification.
100
90
80 70
60
50
40 30
20 10 0
Business Health Education Science Sports
Features
WT
RMI+CHI
V SUMMARY
All organizations that have business based on internet need an effective categorization method for managing large amount of textual data which is available in various forms like sales orders, summary documents, emails, journals and memos etc.
The traditional text classification methods used VSM (Vector Space Model) in which each document was represented as a feature vector of the terms in the document. The Graph Based K-NN text classification technique was introduced to capture the structural information of the document by exploiting graph based model. In graph based model the whole document is represented as centroid feature matrix, which captures the information of the document in the form of edges and nodes.
we have used both globalized as well as localized feature selection methods. The localized method that we have introduced has also improved the accuracy of the classifier. The classifier that we have used is K-NN that is K nearest neighbor. The NN is simple and is having better precision in classifying a document. The graph based K-NN has improved the categorization to some extent and has also given a compact text representation technique, we still need to focus on better text representation methods. We have worked with only K-NN classifier, which is considered to be best classifier, the graph based representation needs to be combined with other standard classifiers like SVM and Naive Bayesian.
VI CONCLUSION AND FUTURE WORK
Here in this technique of text categorization we had concentrated on the compact representation of the document. The feature selection phase plays a vital role in improving the text classification precision because it helps in finding out the relevancy of a particular document in its training categories.
We have used two different methods of feature selection, one is globalized and other one is localized. The experimental results have clearly shown that it is not always the globalized method which improves the categorization accuracy, the localized method which we introduced [WT] had significantly improved the classification accuracy.
However, the graph based K-NN has improved the categorization to some extent and has also given a compact text representation technique, we still need to focus on better text representation methods. We have worked with only K-NN classifier, which is considered to be best classifier, the graph based representation needs to be combined with other standard classifiers like SVM and Naive Bayesian.
classification time.
REFERENCES
1. Bong Chih How, Narayanan k. (2004) “An Empirical Study of Feature Selection for Text Categorization Based On term Weightage”
2. Chuntao Jiang, Frans Coenen, Robert Sanderson, Michele Zito (2009) “Text Classification Using Graph Mining Based Feature Extraction”, The University Of Liverpool, Department Of Computer Science, UK.
3. Gongde Guo, Hui Wang, David Bell, Yaxin Bi and Kieran Greer(2001) “Using KNN Model –based Approach For Automatic Text Categorization”, School Of Computing And Mathematics, University Of Ulster. School Of Computer Science, Queens University Belfast.
4. Stewart M. Yang, Xiao-Bin Wu, Zhi-Hong Deng, Ming Zhang, Dong- Qing Yang (2002) “Relative Term – Frequency Based Feature Selection For Text categorization” Department Of Computer Science And Technology , Peking University, Beijing .
![Table 4.5 The Categorization Result Using Improved GKNN Algorithm [WT]](https://thumb-us.123doks.com/thumbv2/123dok_us/7752393.1271109/9.612.75.543.164.712/table-categorization-result-using-improved-gknn-algorithm-wt.webp)
