Abstract— The rapid exhaustion of the fossil fuels and the ever-increasing pollution of the environment caused by the usage of the fossil fuels implies that the mankind should increase its reliance on the renewable energy technologies. There is a strong indication from the published literature that the addition of the leading-edge tubercles on aero-foils, propellers and wind and tidal turbines etc. improves their efficiency. It is a fact that a very limited work has been done to integrate the tubercles on to the leading-edge of the helical vertical-axis marine turbine blades. Therefore, as part of this novel study, the tubercles were integrated at the leading-edge of the blades of a two-blade helical vertical-axis marine turbine, referred to as the modified turbine. In the first part of the present study, the tubercles were integrated at various span-wise locations along the turbine blade span to optimize the span-wise positioning of the leading-edge tubercles. In the second part of the present study, the tubercle amplitude and wavelength were varied to optimize the tubercle geometry. The results demonstrated an increase in both peak and the average torque produced by all the configurations of the modified turbines analyzed in the present study, in comparison with the baseline turbine i.e. the turbine without leading-edge tubercles, while operating at the design point. It was noted that the addition of the leading-edge tubercles to the turbine blade geometry altered the pressure distribution around the modified turbine blades. A pair of counter-rotating chord-wise vortices was also observed to exist between each tubercle crest. The addition of tubercles at the leading-edge of the turbine blades re-energized the boundary layer leading to a delay in flow separation, resulting in an improved torque output from the turbines having blades with the leading-edge tubercles. It was found that the configuration among the modified turbines with the leading-edge tubercles applied at quarter-span of the blade had the highest average and peak torque output. Moreover, the tubercle configuration with largest amplitude-to-wavelength ratio had the most increase in the average torque output. Higher values of peak and average torque translate to a robust power output from the turbines with tubercles at the leading-edge.
Index Terms— Leading-Edge Tubercles, Helical, Vertical-Axis, Renewable Energy
Manuscript received March 01, 2019.
Fahad Rafi Butt is a Research Fellow with the Heavy Industries Taxila Education City University, Taxila, Punjab, Pakistan (phone: 923002631665; e-mail: [email protected]).
Tariq Talha is an Assistant Professor with the College of Electrical and Mechanical Engineering, National University of Sciences and Technology, Rawalpindi, Pakistan.
I. INTRODUCTION
N the design of power producing devices, such as a marine turbine, maximizing the torque produced is one of the main design considerations. This novel study was aimed to explore the effect of the tubercle geometry and the span-wise positioning of the leading-edge tubercles on the torque characteristics of a helical vertical-axis marine turbine at the design point i.e. the flow conditions which yield the most robust torque output.
Tubercles are rounded protuberances that make significant changes to the aerodynamics of wings [1-12], wind and marine turbine blades, horizontal-axis marine turbine, [13-16], marine and aeronautic propellers [17-18], and electronic heat sink fans [19] etc. It has been concluded by the previous research that the addition of tubercles to the leading-edge of the various lift producing bodies delays flow separation, reduce span-wise flow and strength and size of tip vortices leading to an improvement in the efficiency of the various lift generating devices. The more relevant studies are discussed briefly in the following paragraphs.
A penal method code [1] to simulate movement of aero-foils immersed in a fluid at large Reynolds numbers resulted in a 4.8% increase in lift, a 10.9% reduction in induced drag and a 17.6% increase in lift-to-drag ratio of the aero-foil with the leading-edge tubercles when compared to the aero-foil with no leading-edge modification. It was reported that absolute low pressure exists between the tubercle crests. It was also noted that the modified aero-foil had no performance degradation at lower angles of attacks. A numerical as well as an experimental investigation [2] on the effect of leading-edge tubercle geometry on aero-foils resulted in a 5.33% increase in lift and 2.72% reduction in drag in the post-stall flow regime. The tubercle geometry was modified by changing the tubercle spacing along the wingspan, referred to as the tubercle wavelength, and the tubercle height, referred to as the tubercle amplitude. It was noted that the modified aero-foil with the largest tubercle amplitude and the smallest tubercle wavelength among the various configurations tested was the most aerodynamically efficient. It was also noted that there is a higher-pressure gradient behind the tubercle troughs than behind the tubercle crests. It was also reported that the stagnation line is distorted in the modified aero-foils, because of the integration of the tubercle to the aero-foil geometry.
Optimization of the Geometry and the
Span-wise Positioning of the Leading-Edge Tubercles
on a Helical Vertical-Axis Marine Turbine
Blade
Fahad Rafi Butt and Tariq Talha
Numerical simulations [3] revealed a significant increase in the aerodynamic performance for the scalloped humpback whale flippers when compared with the smooth flipper at relatively higher angle-of-attacks. The study attributed the higher aerodynamic performance for the scalloped flipper to the presence of stream-wise vortices originated by the tubercles. The study concluded that these vortices carry momentum to the boundary layer delaying the trailing-edge separation. Wind tunnel experiments performed on the humpback whale flippers [4] reported an improvement in the lift-to-drag ratio of the modified flipper i.e. the flipper with tubercles at the leading-edge in comparison with the baseline flipper. It was also reported that the flipper with the tubercles at the leading-edge stalled gradually as compared to the baseline flipper. A 40% improvement in the stall angle was reported. Numerical and Experimental tests [9] were conducted to investigate the effect of leading-edge tubercles on the flow structure over the full-span modified aero-foils based on the NACA 0021 profile. It is found that a skew-induced mechanism accounts for the formation of stream-wise vortices whose development is accompanied by flow separation in delta-shaped regions near the trailing edge. It was reported that the presence of vortices is not beneficial to the performance aero-foil in the pre-stall regime, but performance benefits in the post-stall regime are quite evident. An experimental study [7] investigated the effect of aspect ratio and shape of protuberances on the performance of NACA 0012 aero-foil with protuberances on leading-edge. These experiments were carried out in a low-speed wind tunnel. Aero-foil performance measurements and flow visualizations by oil film revealed that the aero-foil performance with protuberances had no significant increase in lift, however a decrease in the drag was reported. It was concluded that the tubercles are suited for low aspect ratio aero-foils. The numerical investigation [6] revealed that the counter-rotating primary and secondary vortices appear over the surface of the modified aero-foils at all angle-of-attacks. It was demonstrated that the magnitude of peak vorticity near the leading-edge of the aero-foil modified with the tubercles at the leading-edge is in direct proportion to the amplitude-to-wavelength ratio of the tubercle geometry, with the leading-edge tubercles with relatively larger amplitude-to-wavelength ratios produce stronger vortices. The study also reported the presence of adverse pressure gradient behind the tubercle troughs as compared to the tubercle crests and the middle cross-sections.
An increase in the lift-to-drag ratio, maximum of 32% at 16° angle-of-attack, of the blade having leading-edge tubercles was reported in a study performed on a horizontal-axis marine turbine blade [13]. The configuration in which the tubercles were applied to a quarter of the blade span towards the turbine blade tip displayed the best overall performance amongst the different combinations tested. A reduction in the tip vortices was also reported. Tubercles were added to the leading-edge of the NREL Phase VI wind turbine blade in numerical studies [14-16]. It was found that the wind turbine having blades with tubercles at the leading-edge of the blades produced robust power output, particularly at the conditions above design point. It was reported by [13, 16] that optimum tubercle position is near
the tip of the turbine blades. The study [14] also concluded that the difference between transient and steady-state analysis was negligible. Steady-state simulations were carried out on a marine propeller with leading-edge tubercles [17] resulted in a small increase of 1.5% in the thrust co-efficient. It was also reported that the propeller efficiency increased only at higher advance ratios, advance ratios greater than 0.8. A numerical analysis on an aeronautic propeller, modified by adding tubercles to the leading-edge of the propeller blades [18], showed an improvement in the propeller efficiency at a wide range of rotational velocities and advance ratios. The configuration with the largest tubercle amplitude and the smallest tubercle wavelength was observed to produce the strongest vortices and the increase in the efficiency of the propellers also increased with an increase in the advance ratio. The study also concluded that the transient effects were minimal. An average improvement in the efficiency of 14.21% was reported.
II. METHODOLOGY
A. Design of Experiments
The turbine blades were modelled in SolidWorks© CAD package. The geometrical data for the baseline marine turbine was taken from [20]. The diameter of the turbines was 0.3 m. The chord length and span of the blades were 0.09 m and 0.45 m, respectively. The turbines had two helical blades with a helix angle of 43.68°. The aero-foil cross section employed for the turbine blades was the NACA 0012. To integrate the tubercles in the turbine blade geometry, 3D-Sketch, 3D-Spline, Split and Loft features of the SolidWorks© CAD package were utilized.
1) The Effect of the Span-wise Positioning of the Tubercles on Turbine Performance
The various configurations analyzed in the present study to investigate the effect of the span-wise positioning of the tubercles on the torque characteristics of the turbine are listed in Table 1. Each of the configuration had a different tubercle application length along the turbine blade span, as shown in Fig. 1. For the modified configurations, the tubercle amplitude was kept at 10% while the tubercle wavelength was kept at 25% of the turbine blade chord, respectively.
TABLE I
APPLICATION LENGTH OF THE LEADING-EDGE TUBERCLES ALONG THE TURBINE BLADE SPAN
Configuration Name Tubercle Application Length [Percent]
C1 0
C2 25
C3 50
C4 75
1) The Effect of the Tubercle Geometry Turbine Performance
[image:3.595.98.236.63.205.2]To study the effect of the tubercle geometry on the torque characteristics of the turbine, two different tubercle amplitudes and wavelengths were selected, as mentioned in Table 2. The tubercles were added only near the tips of the turbine blades, covering 25% of the turbine blade span. The reason behind the employed span-wise positioning of the tubercles in explained in Section IV.C.
Four configurations were analyzed to investigate the effect of leading-edge tubercle geometry on turbine performance. The tubercle amplitude was kept at 20% of the turbine chord for the LASW and the LALW configurations. Meanwhile, the tubercle amplitude was at 10% of the turbine chord for the SASW and the SALW configurations. The tubercle wavelength was at 25% of the turbine blade chord for the SASW and the LASW configurations. The tubercle wavelength for the SALW and LALW configurations was at 50% of the turbine blade chord. In Table 2, the configuration name SASW is an abbreviation for Small tubercle
Amplitude and Small tubercle Wavelength. The other configurations follow the same naming convention. The computer-generated images of the turbine blades are shown in Fig. 2. It should be noted that the SASW and C2 represent the same configuration of the modified turbine and therefore, is not included in Fig. 2.
The tubercle geometry is presented in Fig. 3. The line segment “A” represents the tubercle amplitude, while the line segment “W” represents the tubercle wavelength.
B. Numerical Methodology
The numerical simulations for the present study were carried out using SolidWorks Flow Simulation Premium© code. The code employs κ-ε model with Two-Scales Wall Functions approach as the turbulence model. The numerical algorithm implemented is the SIMPLE-R, modified. The second-order upwind discretization scheme is used to approximate the convective fluxes while the diffusive terms are approximated using the central differencing scheme. The time derivatives are approximated with an implicit first-order Euler scheme. The SolidWorks Flow Simulation© solves the Navier-Stokes equations, equations 1-3, which are formulations of mass, momentum and energy conservation laws for fluid flows. Turbulent flows are predicted using the Favre-averaged Navier-Stokes equations. It is to be noted that, previous researches have also utilized SolidWorks Flow Simulation Premium [5, 18, 21] and the κ-ε turbulence model [2, 5-6, 17-18, 21] in similar and more severe flow conditions with considerable accuracy.
0 ) ( = + x u i i t
(1)
S x x x u u u i j R ij ij i j j i i p t + + = + + ) ( ) ( ) ( 3 , 2 , 1 =
i (2)
Q u S x u x q u x u H i i j i R ij i i R ij ij j i i t p H t
H + + +
− + + + = + ) ( ) ( ( ) ) ( 2 2 u h H=+
(3)
where,
S
i is a mass-distributed external force per unit
mass due to a porous media resistance
S
porousi , a buoyancy
g
S
igravity
i =− is the gravitational acceleration
component along the i-th coordinate direction) and the coordinate system’s rotation
S
rotationi , i.e.,
S
S
S
S
rotationigravity
i porous
i
i= + + . u is the fluid velocity.
The subscripts are used to denote summation over the three coordinate directions [22].
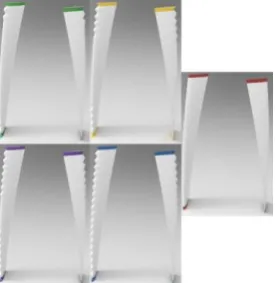
Fig. 1. Column 1; T-B, C2 and C4 configuration. Column 2; T-B, C3 and C5 configuration. Column 3; C1 configuration.
TABLE 2
VARIOUS INVESTIGATED TUBERCLE GEOMETRIES Configuration
Name
Tubercle Amplitude [m] Tubercle Wavelength [m]
C1 0 0
SASW 0.009 0.023
LASW 0.018 0.023
SALW 0.009 0.045
[image:3.595.300.549.68.234.2]LALW 0.018 0.045
Fig. 2. L-R, SALW, LALW and LASW configuration.
[image:3.595.334.526.190.286.2] [image:3.595.307.546.561.794.2] [image:3.595.42.289.595.675.2]Three dimensional transient simulations were carried out to predict the flow around the turbines. The Local Rotating Region(s) (Sliding) feature within SolidWorks Flow Simulation Premium© software was employed to simulate the turbine’s rotation. A transient analysis was needed to be carried out in the present case because the angle-of-attack on the vertical-axis marine and/or wind turbine blades inherently changes with the rotation of the turbine.
1) Mesh and Computational Domain
The software considers the CAD model created within SolidWorks© and automatically generates a Cartesian computational mesh in the computational domain. The fluid and solid domains are also distinguishing automatically. The resulting mesh employs the immersed boundary method; has two types of cells, namely Fluid cells; the cells located entirely in the fluid, and Partial cells are the cells which are partly in the solid and partly in the fluid i.e. the solid-fluid boundary [22].
During the process of mesh generation; mesh controls, a feature to better resolve the model specific geometry and/or flow peculiarities in a region, were employed to refine the mesh in the regions of high gradients. A local mesh control was applied to refine the mesh around and specifically at the leading and the trailing-edges of the turbine blades. A second mesh control was applied to refine the mesh within the rotating region and at the interface of the rotating region and stationery computational domain. The mesh around the turbine blades is shown in Fig. 4.
The initial mesh for the baseline, C1, configuration had a total of 1,391,906 cells of which 362,539 cells were contacting the turbine blade boundary i.e. the partial cells. Whereas, the mesh for the modified turbine had 1,524,945 cells of which 376,079 cells were at the solid-fluid boundary. It is to be noted that this cell count is for the C5 configuration and the other modified configurations had similar cell counts. The first cell dimension was ~9.38x10⁻⁵ m resulting in a y+ value of ~0.51 at the trailing and the leading-edge of the turbine blades. It is worth noting that the increased number of cells in the mesh for the modified turbines was due to the relatively more complex geometry of the modified blades because of the addition of tubercles at the leading-edge of the blades. It is worth mentioning that the number of cells in the mesh generated by a SolidWorks Flow Simulation Premium© is significantly less as compared to the meshes generated by other meshing tools. This is because there are cells in the mesh that can have multiple control volumes not being counted individually as cells, as these control volumes are not meshed separately [22]. It should be noted that, in Fig. 4, the mesh around the cross section of the tubercle crest is not shown because of the similarities with the mesh around the tubercle trough.
A time-step of 0.0026 s was automatically employed by the SolidWorks Flow Simulation Premium© based on flow conditions [22]. The time-step was averaged over the entire duration of the calculation because of a smaller time-step was employed at the start of the numerical simulation. Initially, the inlet of the computational domain was at a distance of 1.5D from the turbine while the outlet was at a distance of 2.5D from the turbine. Lateral dimensions of the computational domain were 1.5D x 2D. The rotating region
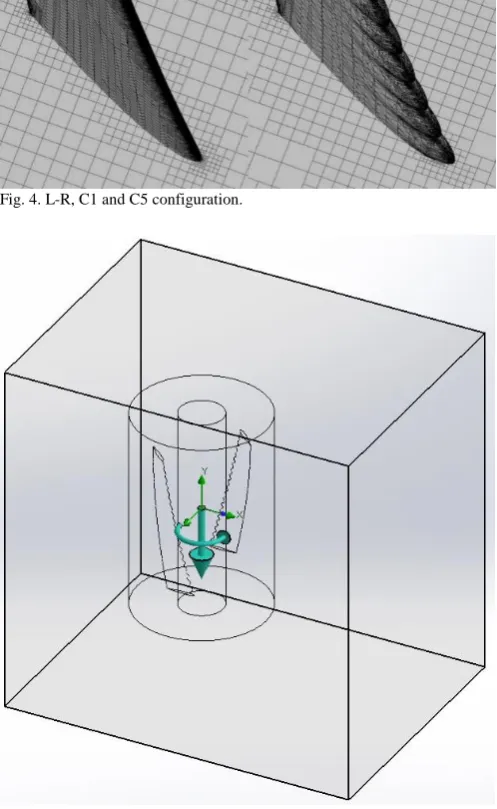
had an outside diameter of 2D while the inside diameter was at 0.5D. All the simulations completed without any numerical errors or unwanted vortex formation. The rectangular computational domain employed for the modified turbine, C5 configuration, is shown in Fig. 5. It should be noted that the other configurations had the same dimensions for the computational domain and therefore, are not shown here. The rotating region, the hollow cylinder, is visible as well. The velocity direction is indicated by the blue arrow, along the x-axis, while the direction of rotation of the turbine is indicated by the curved arrow, colored teal and pointing in the counter-clockwise direction. The teal arrow pointing along the y-axis represents the direction of the force of gravity.
1) Verification and Validation of the Numerical Methodology and Flow Conditions
[image:4.595.300.549.238.643.2]To verify the numerical methodology, the results of the numerical simulation were compared with the results from the experiments [20]. The simulation was performed at the design condition of the turbine, i.e. the rotational velocity was kept at 100 RPM and the fluid, water, flow velocity was set at 1.5 m s-1. The flow conditions resulted in a tip speed ratio and the Reynold’s for the turbine blade of 1.0 and 2.97x10⁵, respectively. The simulation was allowed to run Fig. 4. L-R, C1 and C5 configuration.
for a total of 2.4 s of physical time i.e. the time required by the turbine to complete four complete revolutions. The peak torque from the numerical simulation was at 7.59 Nm resulting in a power coefficient of 0.349 as compared to the peak torque from the experiment at 8.02 Nm which resulted in a power coefficient of 0.369. The result from the numerical simulation was within 5.5% of the experimental result, as shown in Fig. 12.
Once the initial numerical simulation was completed, the initial mesh for the baseline turbine, referred to as mesh 1, was refined, referred to as Mesh 2, to have a total of 1,664,620 cells, of which 372,357 were at the solid-fluid boundary. The cell count increased by 1.2 times from the initial mesh. The numerical simulation was performed at the same flow conditions as employed for the initial mesh and the results were compared with the simulation results from the initial mesh. It was noted that the difference in the maximum and the average torque produced by the turbine between the two mesh densities was minimal, at 0.52% and 0.75%, respectively. Therefore, the initial mesh with a mesh density of 794,265 cells m3 and 1,391,906 total cells was selected for the present study.
Once the mesh density was finalized, to investigate the effect of the size of the computational domain on the torque characteristics of the turbine, the outlet and inlet of the computational domain were moved to 2.7D and 1.62D away from the turbine, respectively. The lateral dimensions of the computational domain were changed to 1.62D x 2.16D. The mesh density, number of cells per meter cube of the computational domain, for the new computational domain was kept at a similar level as to the initial mesh density. It is worth noting that the larger computational domain, referred to as Domain 2, had 1.2 times larger volume than the initial computational domain and had total of 1,662,424 total cells. 370,952 of the cells were at the solid-fluid boundary. The results for average and the peak torque differed by 0.67% and 0.73%, respectively from the results of initial computational domain, Domain 1. Therefore, the initial computational domain size, Domain 1, was selected for the present study. Both, the mesh and the domain independence studies were carried out at the design point of the turbine. It is important to note that the baseline turbine, C1 configuration, was employed for the verification and validation of the numerical methodology and the mesh and the domain independence tests because of the availability of reliable geometrical and experimental data [20].
III. RESULTSANDDISCUSSION
The coefficient of torque and power of a turbine are given by the following relations, equations 4-5. The power and torque coefficients are related by equation 6 [23].
The addition of the tubercles at the leading-edge of the turbine blades alter the flow field around the turbine blades. The changes in the flow field include an alternating non-uniform pressure distribution around the turbine blades and the formation of a counter-rotating chord-wise vortex pair
between each tubercle crest, as discussed in the following sections. The figures for all the two-way comparisons are taken from the C1 and the C5 configurations, respectively.
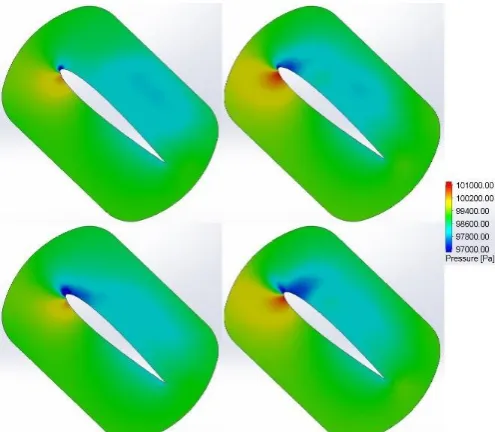
A. Non-Uniform Pressure Distribution
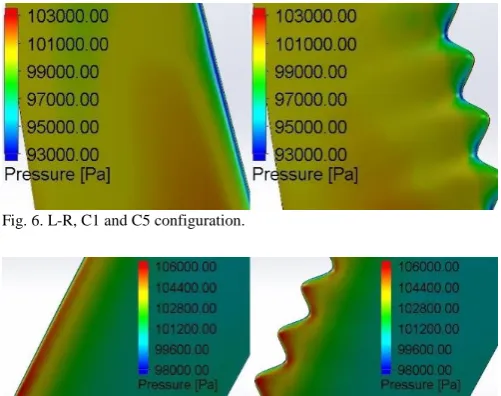
The pressure distribution around the turbine blades is shown in Fig. 6, a zoomed in view at the center-span, focusing on the suction side of the turbine blades. It is clear from Fig. 6 that there is an alternating non-uniform pressure distribution around the modified turbine blade. Referring to Fig. 6, in the modified turbine blade, there is a relatively steeper pressure gradient in the chord-wise direction behind the tubercle troughs. The absolute low pressure also occurs behind the tubercle troughs. As a result, the flow stalls behind the tubercle troughs before it stalls behind the tubercle crests. Fig. 7 shows a close-up view of the turbine blades with an emphasis on the stagnation region. It can be seen from Fig. 7 that the stagnation line, the region of maximum pressure at the leading-edge, is distorted in the modified turbine blade because of the integration of the tubercles at the leading-edge of the blades, while it is smooth in the baseline turbine blade. These trends are consistent with previous research [1-2, 4-6, 9, 18]. It should be noted that the similar trends were also found for all the remaining modified turbine blades, the C2-C4, and the SASW-LALW configurations. Therefore, the figures for the remaining modified turbine blades are not shown here.
B. Counter-Rotating Chord-wise Vortex Formation and Delayed Stall
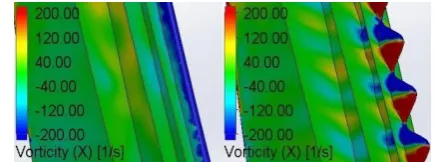
[image:5.595.299.550.391.589.2]In the modified turbine blades, a pair of counter-rotating vortices is formed between the tubercle crests, as shown in Fig. 8 via the vorticity surface plots around the turbine blades and the span-wise cut-plots at three locations along the turbine blade chord. The vorticity component shown is in the direction of free stream flow i.e. the x-axis. In Fig. 8, the red and blue colors represent the clockwise and the counter-clockwise rotation of the vortices, respectively. These vortices have high strength, vorticity, and small size, diameter, near the leading-edge of the turbine blade. It is clear from Fig. 8, that as these vortices travel in the chord-wise direction, their size increases and intensity decreases. Fig. 6. L-R, C1 and C5 configuration.
The diameter of these vortices lies within the range of 3.5 mm-4 mm in the cut-plot nearest to the leading-edge of the blades and increases to 8 mm-11 mm in the third cut-plot. The intensity of these vortices decreases from above 200 s-1 in the first cut-plot to ~150 s-1 in the following cut-plot. This trend is consistent with the previous research [5, 8-9, 17-18]. It can also be seen from Fig. 8 that no such vortices exist in the baseline turbine blade. These vortices re-energize the boundary layer and delay the stall [1-7, 9-15, 18] as shown in Fig. 9.
The streamlines, drawn relative to rotating reference frame using line integral convolution, around the turbine blade cross sections are shown in Fig. 9. The cross sections are taken at the center-span of the turbine blades, tubercle crest at 50% of the span and tubercle trough at 47.5% of the blade span of the C5 configuration. It can be seen from Fig. 9 that in the modified turbine blades, the flow is attached in a larger percent of the turbine blade chord behind the tubercle crest, top left, as compared to the corresponding location in the baseline turbine blade, bottom left. The flow is almost completely reversed at the corresponding location behind the baseline turbine blades. The severity of the stall is almost same behind the tubercle trough, top right, though very slightly less in the modified turbine blades as compared to the corresponding location in the baseline turbine blade, bottom right. This observation was also made by previous researchers [1-7, 9-15, 17-18].
C. The Effect of the Span-wise Positioning of the Tubercles on Turbine Performance
Fig. 10 shows the turbine blades, all of the sub-figures within Fig. 10 were rotated clock-wise by 90°, superimposed by the velocity streamlines, generated using line integral convolution, and velocity magnitude contours, both of these features were drawn relative to the rotating frame of reference. It can be clearly seen from the Fig. 10 that the flow separation occurs closest to the leading-edge in the C1 configuration and the stall progression is uniform along the span-wise direction. Meanwhile, for the modified turbine blades, C2-C5 configurations, the stall progression is non-uniform and the flow separation is further away from the
[image:6.595.59.279.186.267.2]leading-edge i.e. the flow is attached at more percent of the turbine blade in the chord-wise direction. This observation was also made by [2, 9-10]. It can also be seen that the flow behind the tubercle crests has more momentum, indicated by the relatively higher velocity magnitude, as compared with the flow behind the tubercle troughs. The addition of the tubercles at the leading-edge of the turbine blades prevents the entire turbine blade from stalling at once, unlike the baseline turbine blade. This contributes to the improved efficiency of the modified turbine in comparison with the baseline turbine. This observation has also been made in previous research [2-4, 9, 10].
[image:6.595.301.551.214.318.2]Fig. 8. L-R, C1 and C5 configuration.
Fig. 9. L-R, C1 and C5 configuration.
Fig. 10. Row 1; L-R, C2 and C3 configuration. Row 2; L-R, C4 and C5 configuration. Row 3; C1 configuration.
[image:6.595.306.546.352.765.2] [image:6.595.86.255.511.592.2]Fig. 11 shows zoomed in view of the mid-section of the turbine blades superimposed by the velocity streamlines, generated using line integral convolution, velocity vectors and velocity magnitude contours, all of these features were drawn relative to the rotating frame of reference. It can be noted from the Fig. 11 that the least amount of flow separation occurs in the C2 configuration, i.e. the configuration with the leading-edge tubercles applied only close to the blade tips, on 25% of the turbine blade span. This trend is consistent with [14, 16]. This delayed flow separation results in the most robust torque characteristics for C2 configuration, as mentioned in Table 3. It can also be noted from Table 3 that as more percentage of the leading-edge of the modified turbine blades is modified with the addition of the tubercles, moving from C3 to the C5 configurations, the torque characteristics of the modified turbines start resembling to the baseline turbine.
An improved overall performance of the turbine with the blades having leading-edge tubercles as compared to the turbine having blades without the leading-edge tubercles was noticed, as quantified in Table 3.
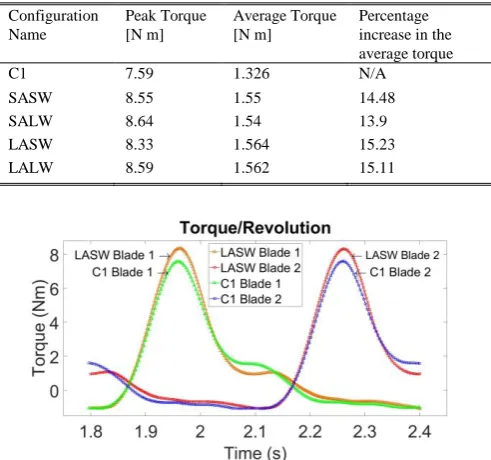
It is clear from Table 3 that C2-C5 configurations, with leading-edge tubercles added to the turbine blades, had an increase in both peak and the average torque output when compared with the baseline turbine, C1 configuration. In particular, among the configurations tested in the present study, the C2 configuration produced the most robust torque. The maximum torque produced by the C2 configuration was at 8.55 Nm, a 11.23% increase over the C1 configuration. The average torque over one complete rotation of the turbine increased by 14.48%, 1.55 Nm for the C2 configuration as compared to 1.33 Nm for the C1 configuration. A comparison of the torque output from turbine blades in one complete revolution, fourth revolution, is shown in Fig. 12. It is clear from Fig. 12 that the results from the numerical simulation are in agreement with the experimental results. It is also clear from the Fig. 12 that the blades of the C2 configuration stall gradually, contributing to the improved torque output from the modified turbine in comparison with the baseline turbine, C1 configuration. For Fig. 12, only the plots for C2 configuration are shown in comparison with the C1 configuration, as the C2 configuration was the most efficient when compared to the other modified configurations, C3-C5 configurations.
D. The Effect of the Tubercle Geometry Turbine Performance
The results from the numerical simulations indicate an improved overall performance of the turbine with the blades having leading-edge tubercles as compared to the turbine having blades without the leading-edge tubercles, as mentioned in Table 4, regardless of the tubercle amplitude and wavelength employed. A comparison of torque characteristics of the modified turbine, LASW configuration, with the baseline turbine is shown in Fig. 13. It is clear from the Fig. 13 that the LASW configuration has the more robust torque output. The plots in Fig. 13 shows only the LASW configuration compared with the C1 configuration because the LASW configuration produced the most torque output, among the modified configurations analyzed.
It can be deduced from the results that the LASW configuration had the most improved performance. This can be attributed to the fact that the LASW configuration had the least amount of flow separation among the configurations of the modified turbines analyzed in the present study. Fig. 14 shows velocity streamlines, drawn relative to the rotating TABLE 3
IMPROVEMENT IN THE TORQUE CHARACTERISTICS FOR VARIOUS CONFIGURATIONS
Configuration Name
Peak Torque [N m]
Average Torque [N m]
Percentage increase in the average torque
C1 7.59 1.326 N/A
C2 8.55 1.55 14.48
C3 8.27 1.545 14.15
C4 7.84 1.383 4.11
C5 7.66 1.407 5.67
[image:7.595.315.528.64.185.2]Fig. 12. Comparison of the torque output from turbine blades over one complete revolution.
TABLE 4
IMPROVEMENT IN THE TORQUE CHARACTERISTICS FOR VARIOUS CONFIGURATIONS
Configuration Name
Peak Torque [N m]
Average Torque [N m]
Percentage increase in the average torque
C1 7.59 1.326 N/A
SASW 8.55 1.55 14.48
SALW 8.64 1.54 13.9
LASW 8.33 1.564 15.23
LALW 8.59 1.562 15.11
[image:7.595.301.547.452.682.2]frame of reference, around the turbine blades. The difference in flow pattern between the various configurations is more prominent towards the tips of the turbine blades, where the tubercles are present.
Fig. 15 shows velocity streamlines and velocity magnitude, both of these features were drawn relative to rotating frame of reference, around the turbine blades, with a focus on the span-wise locations on the leading-edge where tubercles have been added. It is clear from Fig. 15 that the flow has the most momentum behind the tubercle crests in the LASW configuration, indicated by a higher velocity. This can be attributed to the fact that the LASW configuration had the largest tubercle amplitude and the smallest tubercle wavelength, which resulted in the relatively stronger counter-rotating chord-wise vortices, as shown in Fig. 16. This trend was also noted by [12, 18]. To elaborate, consider a delta-wing during flight, when the oncoming flow meets the leading-edge of a delta-wing, it gets divided in to two components. One of these components is directed in the span-wise direction, referred to as the span-wise flow. The other component is called the chord-wise flow, which is perpendicular to the span-wise flow. As the wingspan of a delta-wing decreases or the chord length of the wing increases, the span-wise flow also increases and as result, the strength of the wing-tip vortices produced by the wing also increases. Similarly, as the tubercle amplitude increases and its wavelength decreases, the local span-wise flow over the tubercle also increases, leading to the formation of stronger counter-rotating chord-wise vortices. Fig. 16 shows the vorticity contours around the various configurations of the
modified turbines analyzed in the present study. It can be seen from Fig. 16 that the strongest vortices are generated for the LASW configuration, followed by the LALW, SASW and the SALW configuration, respectively. The tubercles were applied to a quarter of the turbine blade span for the SASW-LALW configurations because of the fact that the C2 configuration had the most robust torque output, as explained in Section IV.C.
[image:8.595.43.290.114.190.2]The difference in pressure distribution around the turbine blade cross-sections for various configurations are shown in Fig. 17-18. The cross-sections were taken at the tubercle crests and troughs for Fig. 17 and Fig. 18, respectively. The tubercle crests were at 90% of the turbine blade span for all the configurations, SALW-LASW configurations, analyzed in the present study. The tubercle troughs were at 95% of the turbine blade span for the SALW and LALW configurations. Meanwhile, for the SASW and LASW configurations, the tubercle troughs were at 92.5% of the turbine blade span. Fig. 14. Row 1; L-R, SALW and SASW configuration. Row 2; L-R, LALW
and LASW configuration.
[image:8.595.303.553.161.376.2]Fig. 15. Row 1; L-R, SALW and SASW configuration. Row 2; L-R, LALW and LASW configuration.
[image:8.595.42.290.226.424.2]Fig. 16. Row 1; L-R, SALW and SASW configuration. Row 2; L-R, LALW and LASW configuration.
[image:8.595.305.553.546.760.2]It can be seen from Fig. 17 that on the suction side of the turbine blade cross-sections, decreasing the tubercle wavelength, moving from SALW to SASW and from LALW to LASW, leads to a relatively higher pressure behind the tubercle crests. An increase in the tubercle amplitude, moving from SALW to LALW and from SASW to LASW, leads to a relatively higher pressure behind tubercle crests. On the pressure side of the turbine blades, a slightly higher pressure exists behind the tubercle crests when the tubercle wavelength is decreased. On the other hand, increasing the tubercle amplitude leads to a slightly lower pressure behind tubercle crests.
It can be seen from Fig. 18 that on the suction side of the turbine blade cross-sections, decreasing the tubercle wavelength, moving from SALW to SASW and from LALW to LASW, leads to a relatively lower pressure behind the tubercle troughs. An increase in the tubercle amplitude, moving from SALW to LALW and from SASW to LASW, leads to a relatively lower pressure behind tubercle troughs. On the pressure side of the turbine blades, a slightly higher pressure exists behind the tubercle troughs when the tubercle wavelength is decreased. On the other hand, increasing the tubercle amplitude leads to a slightly lower pressure behind tubercle troughs. Therefore, it can be concluded that there is an alternating non-uniform pressure distribution around the turbine blades, which is not the case for the baseline turbine blades, as explained earlier.
E. Selection of The Optimum Configuration
The results from the present study indicate that all the modified turbines produce more average torque than the baseline turbine, but the configuration of the modified turbine, LASW shows most improvement in the average torque output, as explained in the previous sections. This turbine configuration was therefore selected as the optimum configuration, among all the configurations analyzed in the present study, for future research. The LASW configuration
had a tubercle amplitude of 0.018 m, 20% of the turbine blade chord, and a tubercle wavelength of 0.023 m, 25% of the turbine blade chord. For the LASW configuration, the tubercles were added near the turbine blade tips, covering 25% of the turbine blade span.
IV. CONCLUSION
In this novel study, the effect of the tubercle geometry and the application length of leading-edge tubercles on the turbine blade span was analyzed w.r.t. the torque characteristics of a vertical-axis marine turbine blade. It was found that the addition of tubercles at the leading-edge of the turbine blade improved torque characteristics of the turbine up to 15.23%, over one complete rotation of the turbine, for the LASW configuration. The performance of the modified turbines improved because of the delayed stall in the modified turbines in comparison with the baseline turbine, as explained earlier. It would be interesting to study the effect of the leading-edge tubercles away from the design condition of the turbine and to study the effect of leading-edge tubercles on turbine solidity.
REFERENCES
[1] Watts, P., and Fish, F. E., “The Influence of Passive, Leading Edge Tubercles on Wing Performance,” Proceedings of the Unmanned Untethered Submersible Technology (UUST01), 2001.
[2] Fernandes, Irelyn, Yogesh Sapkota, Tania Mammen, Atif Rasheed, Calvin Rebello, and Young H. Kim, "Theoretical and Experimental Investigation of Leading Edge Tubercles on the Wing Performance,"
Proceedings of the Aviation Technology, Integration, and Operations Conference, Los Angeles, CA, 2013. doi.org/10.2514/6.2013-4300
[3] Pedro, H. T. C., and Kobayashi, M. H., “Numerical Study of Stall Delay on Humpback Whale Flippers,” 46th AIAA Aerospace Sciences Meeting and Exhibit, AIAA Paper 2008-0584, Reno, NV, 2008.
[4] Miklosovic, D. S., Howle, L. E., Murray, M. M., & Frank E. Fish, “Leading-edge tubercles delay stall on humpback whale (Megaptera novaeangliae) flippers,” Physics of Fluids, Vol. 16, No. 5, 2004. [5] Weber, P. W., Howle, L. E., Murray, M. M., & Miklosovic, D. S.,
“Computational Evaluation of the Performance of Lifting Surfaces with Leading-Edge Protuberances,” Journal of Aircraft, Vol. 48, No. 2, 2011, pp. 591-600.
[6] Zoran Čarija, Emil Marušić, Zdenko Novak and Sanjin Fućak, “Numerical analysis of aerodynamic characteristics of a bumped leading edge turbine blade,” Engineering Review, Vol. 34, No. 2, 2014, pp. 93-101.
[7] JH Chen, SS Li and VT Nguyen, “The effect of leading edge protuberances on the performance of small aspect ratio foils,”
Proceedings of 15th International Symposium on Flow Visualization,
Minsk, 2012
[8] K.L. Hansen, R.M. Kelso, B.B. Dally and E.R. Hassan, “Analysis of the Streamwise Vortices Generated Between Leading Edge Tubercles,” Proceedings of 6th Australian Conference on Laser Diagnostics in Fluid Mechanics and Combustion, Canberra, 2011. [9] N. Rostamzadeh, K. L. Hansen, R. M. Kelso & B. B. Dally, “The
formation mechanism and impact of streamwise vortices on NACA 0021 airfoil's performance with undulating leading edge modification,” Physics of Fluids, Vol. 26, No. 10, 2014. dx.doi.org/10.1063/1.4896748
[10] K. L. Hansen, R. M. Kelso & B. B. Dally, “Performance Variations of Leading-Edge Tubercles for Distinct Airfoil Profiles,” AIAA Journal, Vol. 49, No. 1, 2011. doi.org/10.2514/1.J050631
[11] Ernst A. van Nierop, Silas Alben, and Michael P. Brenner, “How Bumps on Whale Flippers Delay Stall: An Aerodynamic Model,”
Physical Review Letters, Vol. 100, No. 5, 2008.
[image:9.595.42.290.408.624.2][12] Custodio, D., "The Effect of Humpback Whale-like Leading Edge Protuberances on Hydrofoil Performance," Master’s Thesis, Mechanical Engineering Dept., Worcester Polytechnic Institute, Worcester, MA 01609.
[13] Shi, Weichao, Mehmet Atlar, Rosemary Norman, Batuhan Aktas, and Serkan Turkmen, "Numerical optimization and experimental validation for a tidal turbine blade with leading-edge tubercles,"
Renewable Energy, Vol. 96, Part A, 2016, pp. 42-55.
[14] Ri-Kui Zhang and Jie-Zhi Wu, “Aerodynamic characteristics of wind turbine blades with a sinusoidal leading edge,” Wind Energy, Vol. 15, No. 3, 2012, pp 407-424.
[15] Giada Abate and Dimitri N. Mavris, "CFD Analysis of Leading Edge Tubercle Effects on Wind Turbine Performance," Proceedings of the 15th International Energy Conversion Engineering Conference, Atlanta, GA, 2017. doi.org/10.2514/6.2017-4626
[16] Giada Abate and Dimitri N. Mavris, "Performance Analysis of Different Positions of Leading Edge Tubercles on a Wind Turbine Blade," 2018 Wind Energy Symposium, Kissimmee, FL, 2018. doi.org/10.2514/6.2018-1494
[17] Ibrahim, I. H., and T. H. New, "A numerical study on the effects of leading-edge modifications upon propeller flow characteristics,"
Proceedings of Ninth International Symposium on Turbulence and Shear Flow Phenomena. Melbourne, 2015.
[18] Butt, F.R., and Talha, T., " A Numerical Investigation of the Effect of Leading-Edge Tubercles on Propeller Performance," Journal of Aircraft, 2019. https://doi.org/10.2514/1.C034845
[19] Gigabyte WINDFORCE 2X cooling system, “GV-R737WF2OC-2GD
(rev. 1.0),” [online database], URL:
https://www.gigabyte.com/Graphics-Card/GV-R737WF2OC-2GD-rev-10#ov [cited 19 March 2018].
[20] B. Yang, & X.W. Shu, “Hydrofoil optimization and experimental validation in helical vertical axis turbine for power generation from marine current,” Ocean Engineering, Vol. 42, pp. 35-46, 2012. [21] Trebunskikh, T. V., Ivanov, A. V., & Dumnov, G. E., “FloEFD
simulation of micro-turbine engine,” Proceedings of Applied Aerodynamics Conference on Modelling & Simulation in the Aerodynamic Design Process, Bristol, 2012.
[22] Mentor Graphics Corporation, Flow Simulation Technical Reference, 1st ed., 2016, pp 4,81.