ABSTRACT
The United States Environmental Protection Agency is currently in the process of adding or lowering the maximum contaminant levels of many organic compounds, including trihalomethanes (THMs). As a result, many water treatment facilities are expected to consider the use of processes such as ozone oxidation and granular activated carbon (GAC) adsorption. Since these processes are quite expensive, accurate design of these systems for the removal of humic substances, the precursors of THMs, is essential.
This work examined the effects of bench scale
coagulation, ozonation, and biodegradation processes on the adsorption of aquatic humic substances obtained from a swamp
lake in southeastern Virginia. The equilibrium adsorption
behavior was described by dividing each humic mixture into several fictive components and ideal adsorbed solution theory (lAST) was then used to find the Freundlich
parameters and initial concentration of each component.
lAST was found to provide adequate descriptions of humic substance adsorption, even though many assumptions in the
model were not considered to be valid for humic solutions.
This multicomponent adsorption model was used to show that compositional changes were responsible for increased
adsorbability upon ozonation and biostabilization.
Unfortunately, systematic changes in the lAST parameters
were not found to occur with increasing ozone dose, thereby
implying that accurate prediction and design of combined
ozone and GAC systems may be difficult. However, a
normalized adsorption isotherm showed some promise in this
regard although the technique may not be applicable to
kinetic systems.External mass transfer characteristics of humic
solutions were examined with a mini-column adsorber. The
free liquid diffusion coefficient was found to increase upon
coagulation while no significant changes were observed after
ozonation and biostabilization. Internal mass transfercharacteristics were examined with a pore and surface
diffusion model. The overall mass transfer rate was found
to increase after coagulation and after ozonation and
biostabilization. However, tests with three different ozone
doses showed no change in mass transfer rates with ozone
dose. In addition, the techniques used in this work were
not found to be capable of describing the mechanism of hximic
substance diffusion.
ACKNOWLEDGMENTS
As with any report of this type, the work and ideas
presented here represent the combined effort and help from
many others who certainly deserve plenty of credit.
Firstly, I would like to extend my appreciation to my
advisor. Dr. Fran DiGiano, for his guidance in helping me
understanding much of the theory and significance of the
results presented here. In addition, a tremendous amount of
help was provided by Joachim Fettig, who showed me how to
set up all of the laboratory experiments, how to use all of
the computer models, and how to interpret and understand the
results. The guidance of these two shows throughout this
work and, without them, a work of this nature would not have
been produced.
I also received helpful comments from several others
during the course of this project. Many suggestions were
recently provided by the remaining members of my committee,
Drs. Phil Singer and Casey Miller, whom I would like to
thank for the time they put into reading the previous draft
of this report and for providing their input. Significant
amounts of insight were provided by Joe Pedit, especially in
regard to the computational methods used by the adsorption
models. Additional thanks are extended to Emery Kong for
his help in setting up many of the experiments performed in
the first year of data collection. The members of the
machine shop, particularly Randy and Justin, are to be
congratulated for their excellent work and for their great
patience in the construction of the kinetic equipment and
the ozone reactor set up. The ozone reactor itself was the
result of the work of the UNC Glass Shop.
In addition, there are many who deserve recognition for
making my two years in Chapel Hill a fun and rewarding
experience. Most important of these has been Georgiana
Ference, who not only typed this manuscript, but also
provided the support necessary in time of need. Endless
hours of enjoyment were provided by those whom I met in
Craige Hall during the 1985-86 academic year, particularly
Mike Carter for all those one-on-one basketball games and
for making the final print of this report for me. Life in
the depths of Rosenau Hall was made enjoyable by the
presence of other students such as Bill O'Neill, Ed
Wallingford, Jan DeWaters, Anne Roche, Chang Wang, Joe
Pedit, Jim Garber, David Chang, etc. I would also like to
thank Dave Ference and the people at the Paramus, New
Jersey, office of Malcolm Pirnie, Inc., for allowing me to
use their computer equipment so that I could finish the word
processing on this final draft.
Finally, I would like to extend my appreciation to my
family for their continued support of the decisions I have
made in my life. Without them, I would not have been able
to go this far.
It is my hope that work such as this will not only help
eliminate the THM problem but will also help in the
continued effort to eliminate all causes of cancer. For
this reason, I have dedicated this work to the memory of my
grandmother, Dorothy Scott, and Georgiana's mother, Verna
Marie Ference, both of whom succumbed to this awful disease
TABLE OF CONTENTS
CHAPTER 1: INTRODUCTION ... 1
OBJECTIVES ... 2
CHAPTER 2: BACKGROUND...3
HUMIC SUBSTANCES...3
HUMIC SUBSTANCES AND HUMAN HEALTH ... 6
ACTIVATED CARBON ADSORPTION OF HUMIC SUBSTANCES ... 8
Activated Carbon ... 8
Adsorption of Humic Substances ... 11
Effects of Coagulation on Humic Substance
Adsorption...16
Effects of Ozonation on Humic Substance
Adsorption...17
Summary...19
MODELING HUMIC SUBSTANCE ADSORPTION ... 19
CHAPTER 3: EXPERIMENTAL PROCEDURES ... 22
PREPARATION OF HUMIC SOLUTIONS ...22
ANALYSIS OF HUMIC SOLUTIONS ... 31
DETERMINATION OF EQUILIBRIUM ADSORPTION BEHAVIOR ___ 41
DETERMINATION OF ADSORPTION RATE BEHAVIOR ... 43
Mini-Column Studies ... 43
Batch Rate Studies...47
CHAPTER 4: PROCEDURES FOR MODELING THE ADSORPTION OF
UNKNOWN MIXTURES...51
ADSORPTION EQUILIBRIA ... 51
Ideal Adsorbed Solution Theory...51
Fitting Isotherm Data...62
Example of the Procedure for Fitting
Jsotherms...65Making Predictions with the lAST Model...73
ADSORPTION KINETICS ... 76
Introduction ... 76
External Mass Transport ... 79
The Pore-Surface Diffusion Model ... 85
Determination of Internal Diffusion
Parameters...88
SUMMARY...91
CHAPTER 5: EQUILIBRIUM RESULTS ... 93
EFFECT OF LONG TERM STORAGE...93
EFFECT OF ALUM COAGULATION...96
EFFECT OF OZONATION AND BIOSTABILIZATION ... 102
EFFECT OF TREATMENT ON lAST PARAMETERS...112
THE NORMALIZED ADSORPTION ISOTHERM...114
CHAPTER 6: KINETIC RESULTS ... 123
EXTERNAL DIFFUSION ... 123
INTERNAL DIFFUSION ... 128
Homogeneous Diffusion Model Results ... 131
The Heterogeneous Diffusion Model ... 134
Comparing the Results of the
PDM, SDM, and HDM...145
CHAPTER 7: CONCLUSIONS AND RECOMMENDATIONS ... 149
CONCLUSIONS...149 RECOMMENDATIONS ... 153 APPENDIX A: ALGEBRAIC MANIPULATIONS USED TO
DERIVE THE lAST MODEL...156
APPENDIX B: ERROR ANALYSIS OF ISOTHERM DATA...160 REFERENCES...164
CHAPTER 1
INTRODUCTION
Research in the area of humic substances has steadily
increased since their implication in the formation of
trihalomethanes (THMs) during chlorination in drinking water
treatment (Rook, 1974). After a subsequent investigation
found THMs to be prevalent in treated waters on a nationwide
basis (Symons, et al., 1975), the United States Congress
enacted legislation that amended the Safe Drinking Water Act
to include a maximum contaminant level (MCL) for THMs at
0.10 mg/1 (Code of Federal Regulations, 1986a). Presently,
the United States Environmental Protection Agency (EPA) is
reviewing the addition of many organic contaminants to the
regulatory listing and plans to consider lowering the THM
standard in 1990 (Cook and Schnare, 1986).
These current and proposed regulations require the
removal of THMs and THM precursors in order to reduce human
health risks. Granular activated carbon (GAC) adsorbers are
considered to be very effective in removing many synthetic
organic chemicals and, as noted in the Code of Federal
Regulations (1986b), are suitable for the removal of THM
precursors. Therefore, the addition of MCLs to regulate
more organic contaminants and the potential lowering of the
adsorbers. The lower THM standard will also result in
increased demand for alternatives to chlorine oxidation,
such as ozone, and for the improvement of the coagulation
process to better remove the humic precursors of THMs. The
understanding of how the coagulation and ozonation processes
affect the adsorption of humic substances is required since
these processes typically precede GAC adsorbers in water
treatment systems. In addition, the large cost of processes
such as ozonation and GAC adsorption requires the ability to
optimally design the combination of processes such as
ozonation and GAC adsorption for humic substance removal.
OBJECTIVES
This research was aimed at examining the effects of
alum coagulation and the subsequent treatments of ozonation
and biodegradation on the adsorption behavior of aquatic
humic materials. In addition, current modeling methods were
tested to determine their applicability to humic substance
adsorption in bench scale systems and to search for a
quantitative relationship between the amount of ozone
CHAPTER 2
BACKGROUND
HUMIC SUBSTANCES
Humic substances are widely prevalent in natural
aquatic systems and may represent up to 8 0% of the dissolved
organic materials present in lake waters. These materials
primarily represent biodegradation products of dead plant
matter such as leaves, and bark leachates such as lignins.
These products are generally formed in soils and
subsequently reach aquatic systems by runoff or groundwater
movement. In their review of humic substances in lake
waters, Steinberg and Muenster (1985) also add that aquatic
humic substances are formed by the degradation of dead algal
and bacterial matter and, as a result, are more aliphatic in
nature than soil humic materials.
Although little is known about the structure of humic
materials, significant progress has been made in
understanding the role of humic substances in the aquatic
environment. Prakash and MacGregor (1983) note that humic
materials play a significant role in global carbon cycles
and are considered to benefit aquatic biological systems by
stimulating processes associated with cellular metabolism.
metals and pesticides (Carter and Suffet, 1982) ,
thereby-reducing short term toxicity.
Progress has also been made in understanding the
molecular nature of humic materials. A review of several
lake waters by Steinberg and Muenster (1985) reveals that
aguatic humic substances have elemental compositions (by
weight) in the range of 43-55% carbon, 35-50% oxygen, 3-6%
hydrogen, and small amounts of nitrogen, phosphorous,
sulfur, chlorine, and ash components. Oxidation studies
have further indicated the presence of highly substituted
aromatic rings interconnected by short aliphatic chains and
have also indicated the presence of fused aromatic and other
cyclic components (Liao, et al., 1982). Potentiometric
titrations by Narkis and Rebhun (1977) with two commercial
humic acids and a peat fulvic acid indicated the presence of
carboxylic and phenolic functional groups. Several authors
have proposed humic structures (Christman and Ghassemi,
1966; Dragunov, 1961) even though they exist in a multitude
of different species within any given system. Thus, the
best representation (shown in Figure 2-1) appears to be the
one presented by Trussell and Umphres (1978) where humic
substances are represented as an "amorphous mass of
polyhetero condensate with certain functional groups
protruding from its surface."
The physical nature of humic molecules is also becoming
better understood. Molecular weight distributions obtained
*
<
H
C — CH3
POLYHETERO CONDENSATE OF ORGANIC MOIETIES
reveal a wide range of molecular sizes from molecular
weights < 1000 to > 50,000 (Lienhard and Sontheimer, 1979;
Summers, 1986; Anderson, et al., 1986; Flogstad and
Odegaard, 1985). In addition, Ghosh and Schnitzer (1980)
modeled soil humic molecules in a manner similar to the way
that polymers are modeled. Therefore, a solution of humic
substances should be considered as a mixture of weak
polyelectrolytes covering a wide range of molecular sizes.
HUMIC SUBSTANCES AND HUMAN HEALTH
Humic substances have received a great deal of
attention since Rook (1974) first linked them with the
formation of chloroform and other trihalomethanes (THMs)
upon chlorination at the water treatment plant in Rotterdam,
the Netherlands. Several studies subsequently found THMs in
finished waters throughout the state of North Carolina
(Singer, et al.. 1981) and throughout the United States
(Symons, et al.. 1975). Shortly after Rook's discovery,
several researchers found chloroform to be carcinogenic to
mice and rats, the results of which suggested that a maximum
of 252 out of 300,000 annual cancer deaths could be
attributed to the drinking of chlorinated waters (Tardiff,
1977). In addition, epidemiological studies by Cragle,
et al. (1985), and by Cantor, et al. (1985), found
statistically significant relationships between the drinking
respectively, for several age groups and several areas of
the country.
Other health concerns noted for humic materials are the
formation of chlorination byproducts other than the THMs
(Norwood, et al.. 1981; Johnson and Randtke, 1983) and the ability of humic substances to complex with metals and
pesticides (as reviewed by Prakash and MacGregor, 1983).
The health implications of these matters are largely
unknown, a troubling problem since Fleischacker and Randtke
(1983) pointed out that THMs represent a small fraction of
the chlorinated byproducts in drinking waters.
The information provided about THMs in the mid 1970's
quickly received strong legislative attention. The Safe
Drinking Water Act (SDWA), originally passed in 1974, was
amended to include a maximum contaminant level (MCL) of
0.10 mg/1 for total THMs (Code of Federal Regulations,
1986a). Currently, the United States Environmental
Protection Agency (USEPA) is in the process of phasing in
new MCLs for many organic contaminants and plans to revise
the THM standard to a lower level in 1990 (Cook and Schnare,
1986).
The Code of Federal Regulations (1986b) also lists a
set of "generally available methods" that may be used to
meet the THM standard. Water suppliers are further required
to use higher cost approaches if the generally available
methods are found to be unsuccessful. Among the methods
coagulation prior to chlorination, ozonation, and activated
carbon adsorption to remove THM precursors. As a result of
the expected lowering of the THM standard, many facilities
are expected to make use of these options.
ACTIVATED CARBON ADSORPTION OF HDMIC SUBSTANCES
Activated Carbon
The understanding of humic substance adsorption onto
activated carbon requires the knowledge of both adsorbent
and adsorbate properties. For this research, the adsorbates
were aquatic humic materials, the properties of which were discussed above, while the adsorbent was activated carbon,
the characteristics of which will be described from reviews
provided by Smisek and Cerny (197 0) and by Mattson and Mark
(1971).
Activated carbons are produced from sources such as
coke, carbonized shells, and crushed charcoal by subjecting them to an activating gas such as steam. The resulting
material is generally considered to be comprised of microcrystallites of trigonally bonded carbon in
turbostratic layers. The turbostratic structure is subtly
different from the lattice structure of graphite in that the
layers are not linked together.
The microcrystallites are interconnected by
oriented within a given particle, thereby creating the openings known as pores. The porous nature of a given
carbon is determined by the source material and the
activation process. All activated carbons contain a wide variety of pore diameters which, as noted by Summers (1986),
have been categorized into three size ranges known as
micropores (rp < 1 nm), mesopores (1 nm < rp < 25 nm), and
macropores (rp > 25 nm). The distributions of pore volume
and surface area with respect to these pore sizes areimportant characteristics of an activated carbon. The micropores typically contain a range of 50 - 80 % of the total surface area of a carbon particle while as much as 98%
of the total surface area can be found in pores with rp < 10
nm.
The microcrystallites are also subject to forming
surface functional groups as a result of reactions with the activating gas. The nature of the groupings depends on both the activating gas and the activation process itself. For instance, activation at high temperatures with carbon
dioxide (CO2) yields basic surface oxides while activation at low temperatures with oxygen (O2) produces acidic surface
oxides.
Therefore, when considering the adsorption of humic materials, one must consider the physical and chemical
interior adsorption sites while interactions between humic functional groups and surface functional groups can also hinder or favor the adsorption process. These physical and chemical interactions are notably apparent in the literature
of humic substance adsorption.
Adsorption of Humic Substances
Humic substance adsorption has been shown to be strongly influenced by the distribution of carbon pore sizes. In experiments with nine different activated
carbons. Lee, et al. (1981), showed that those carbons
having the largest pore sizes adsorbed the most humic
material. Weber, et al. (1983), made the same observation
with three different carbons. These results were taken as evidence that humic substances may be physically excluded from many adsorption sites by pore constrictions smaller
than many humic molecules.
Further evidence of this nature of humic substance
adsorption was also provided by Lee, et al. (1981), when they separated a humic solution into various molecular
weight fractions and found better adsorbability for smaller
molecules than for larger molecules. In addition, their
work showed a strong correlation between the adsorption capacity of the < 1000 MW fraction and the volume in pores with radii < 70 A while the adsorption capacity of the > 50,000 MW fraction correlated well with the volume in
pores with radii < 400 A. Preferential adsorption of lower MW fractions has also been observed by McCreary and Snoeyink
(1980) and Summers (1986).
Interestingly, polymer scientists have found adsorption capacities to increase with molecular size (Fleer and
Lyklema, 1983) although these results were observed with
nonporous adsorbents. Similarly, adsorption capacities for
humic materials were observed to increase with molecular
weight for adsorption on kaolin clay (Manos and Tsai, 1980) as well as on a synthetic resin (Mantoura and Riley, 1975).
Summers (1986) hypothesized that the adsorption of humics, being similar to the adsorption of polymers, should also
indicate increased capacities for larger molecules on
activated carbon when pore size limitations are accounted
for. By combining estimated humic molecule radii from the work of Cornel, et al. (1986b), with pore surface area
distributions from his own work. Summers was able to present isotherms showing little effect of molecular size on humic
adsorbability. Thus, the molecular size dependence of
adsorption observed with the activated carbon work noted
earlier was shown to be due to the exclusion effect.
Ionic strength and pH conditions have been observed to have a profound influence on humic substance adsorption
(Weber, et al.. 1983; McCreary and Snoeyink, 1980). Changes in these conditions can alter adsorbability by altering
charge densities on the GAC surface and around humic
functional groups. In the most complete study to date on
the subject, Randtke and Jepsen (1982) observed
significantly increased adsorbability with the addition of
monovalent cations (K"*", Na"*") and an even more pronounced
increase in adsorbability with the addition of divalent
cations (Ca^"*", Mg^"^) . The study also found increased
adsorption capacities with decreasing pH and found anion concentrations to have no effect on adsorption capacities.
These results were attributed to three possible
mechanisms: (1) cation-adsorbate interactions in solution (such as the shielding and neutralization of humic
functional groups); (2) cation-adsorbate interactions in the adsorbed phase (similar to those of the solution phase
although a negative surface charge would create a greater
concentration of cations in the adsorbed phase thereby
enhancing the effects); and (3) interactions between cations and the surface that could reduce electrostatic repulsions
between the surface and humic molecule or form
surface-cation-adsorbate complexes.
However, Summers (1986) found that the GAC used in the above study was positively charged at pH values below 10.0 and observed the same effects. Therefore, any adsorption mechanism depending on attraction between cations and a negatively charged surface must be ruled out. As a result of his findings, Summers concluded that the enhanced
adsorption caused by cations must be due to cation-adsorbate interactions in the solution phase.
The enhanced adsorbability caused by cations may be explained by considering that humic molecules behave
similarly to polymeric molecules. Polymer science indicates that the most thermodynamically stable form of an uncharged
macromolecule is that of the random coil (Atkins, 1982). When the macromolecule contains negatively charged
substituents, as humic molecules do, electrostatic
repulsions force the configuration to become more linear. When the concentration of cations such as sodium is
increased, electrostatic repulsions are reduced due to the
accumulation of cations around the negatively charged
functional groups. Therefore, the macromolecule is allowed to adjust to a more coiled and compact nature that allows increased penetration into the microporous structure of the activated carbon.
Observations of this phenomenon were made by Ghosh and Schnitzer (1980) who used surface pressure and viscosity measurements to imply decreased molecular size with
increased ionic strength and decreasing pH. Figure 2-2 shows their proposed configurations and shows that the configuration of humic molecules is more linear under natural conditions. Similar observations were made by Cornel, et al. (1986b), when studying the effects of ionic strength and pH on the film diffusivities of humic
substances. As expected, their results show increased
diffusion rates with increased ionic strength and decreased
FULVIC ACID 1
ELECTROLYTE CONC'N (M) pH
0.001 0.005 0.010 0.050 0.100 2.0 3.5 6.5 9.5 LOW
CONCN -NA^ ^ ^ ^ f» ^Vj
r::^
- 3::^
HIGH
CONC'N ^
1^ ^ ^ ^ W' « 47
HUMIC ACID
ELECTROLYTE CONC'N (M) pH
0.001 0.005 0.010 0.050 0.100 6.5 8.0 9.5 LOW
CONC'N -N/S. ^ ^ ^ » - -^—1
^
HIGH
CONC'N ^
1^ ^ 4r ^
#
^ (^FIGURE 2-2: EFFECT OF IONIC STRENGTH AND pH ON HUMIC STRUCTURE (AFTER GHOSH AND SCHNITZER, 1980)
^W^S^^^F^
pH. These considerations show, once again, the importance
of pore size in relation to molecular size.
Effects of Coagulation on Humic Substance Adsorption
Several studies have been performed to understand the
effect of alum coagulation on humics adsorption. Semmens,
et al. (1986), found improved GAC filter performance with
coagulation and attributed this result to lower influent
concentrations and the removal of larger organics during
coagulation. In addition, coagulation was found to increase
adsorption capacity in isotherm studies by Randtke and
Jepsen (1981) and Lee, et al. (1981). However, Jodellah
(1985) found inconsistent results with various humic
solutions and concluded that the effect of alum coagulation
on humic adsorption was system specific.
Several reasons may be considered for the general
improvement in adsorbability observed with coagulation.
Randtke and Jepsen (1981) proposed that better adsorbing
aluminum-humic complexes were responsible. However, Lee,
et al. (1981), and Weber, et al. (1983), observed decreased
adsorbability when alum was added to an aluminum
concentration similar to that remaining after coagulation.
The results obtained by Jodellah (1985) showed that
alteration of the molecular size distribution by alum
coagulation, not the simple addition of aluminum ions, was
the most likely explanation for the observed results. Alum
concentrations that caused complete destabilization and sedimentation revealed a compositional change towards domination by smaller molecules. However, in cases where complete destabilization did not take place, the
distribution of sizes was dominated by larger molecules
formed by aggregation. Therefore, as long as alum
coagulation causes complete destabilization, improvement should be observed for humic substance adsorption.
Effects of Ozonation on Humic Substance Adsorption
Ozonation followed by activated carbon has received a considerable amount of attention because of the ability of ozone to break down organics into readily biodegradable substances and because of the ability of activated carbon filters to support biological growth. Thus, the activated
carbon process becomes capable of removing organics by adsorption or by biodegradation, thereby increasing the
length of time that a carbon filter can be run until all of the adsorption sites are exhausted.
Humic substance removals with ozone and GAC has
produced mixed results. Zabel (1985), in reviewing British
treatment plants, determined that ozonation provided little
benefit for the GAC process, even after conventional
treatment. Glaze, et al. (1981), found that GAC columns
receiving waters pretreated with ozone were outperformed by
GAC columns receiving non-ozonated waters in terms of
removing THM precursor material. This group also found that the GAC filters receiving ozonated water provided better removals than those not receiving ozonated water after the filters had reached exhaustion. Maloney, et al. (1985), found that pre-ozonation increased DOC removal in GAC beds although the same group (Neukrug, et al.. 1984) determined that the extra removals were not always cost effective.
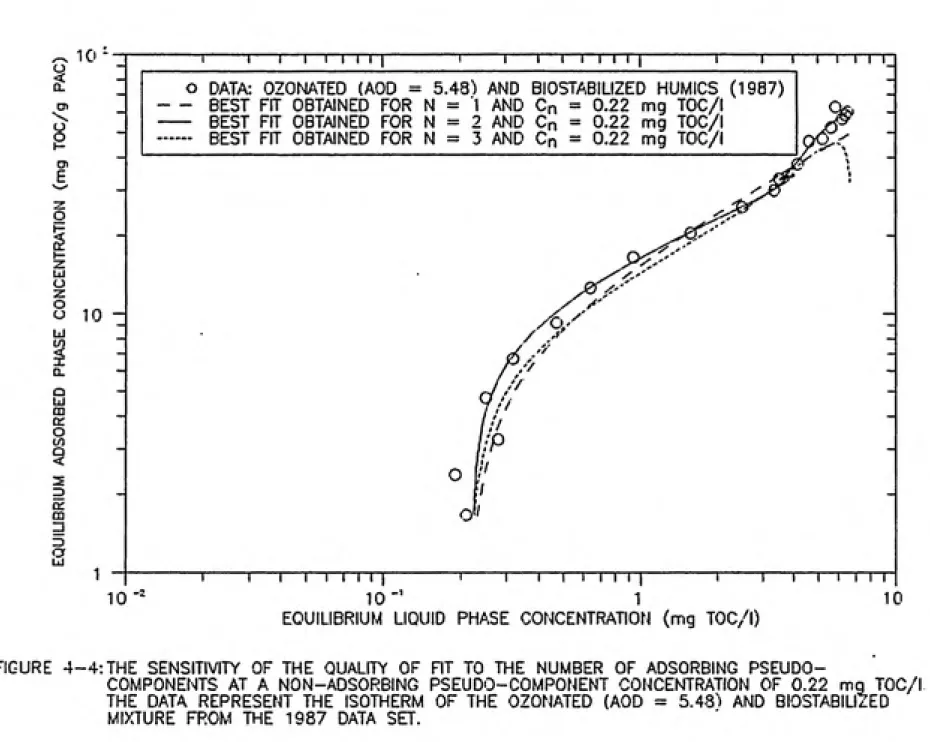
While bench scale work with adsorption isotherms generally indicate reduced adsorption capacities after ozonation of humic substances (Hubele, 1984; Chen, et al., 1987; Glaze, et al.. 1986), there have been exceptions. Benedek, et al. (1980) , and Somiya, et al. (1986) revealed insignificant changes in adsorbability while Kaastrup (1985) found significant increases in adsorbability. These
apparently contradictory results are explained by the fact that ozonation reduces the average molecular size of a mixture (indicating increased adsorbability) and also creates highly polar end products (indicating decreased adsorbability due to increased hydrophilicity). The combination of these two effects may be different for
different sources of humic material.
The increased biodegradability of humic substances after ozonation has been documented by Stephenson, et al.
(1979), Yamada, et al. (1986), and DeWaters (1987). Hubele
(1984) observed that the isotherm of an ozonated humic
mixture shifted towards increased adsorbability after the
mixture was biostabilized. This result would tend toindicate the biodegradation of the highly polar species
produced by ozonation.
Summary
The removal of humic substances by activated carbon has
been shown to be a function of system conditions. The
process is limited both physically (i.e., by size exclusion from pores) and chemically (i.e., humic functional group interactions between the solvent and the adsorbent surface), although at this stage the physical limitations seem to apply much more heavily when considering humic substance adsorption. In any event, one must obtain a thorough knowledge of system conditions before characterizing the
adsorption of humic material.
MODELING HUMIC SUBSTANCE ADSORPTION
As demand increases for the use of activated carbon
filters due to tighter control of THMs and other
disinfection byproducts, the need for accurate predictive models to aid in design also increases. Modeling of humic substance adsorption has been somewhat limited. It is often applied to carbon columns with fairly sophisticated kinetic approaches although, for lack of better knowledge, humic
solutions have been considered as single solutes. Examples
of this approach are the analyses of batch and column ratedata with the homogeneous surface diffusion model (HSDM), developed by Crittenden and Weber (1978), that used the Freundlich equation to describe the isotherms of humic materials (Lee, et al., 1983; Kaastrup, 1985; Jodellah,
1985; Summers, 1986).
However, isotherm results have shown that humic
solutions are multicomponent in nature (Weber, et al.^ 1983) and attempts have been made to model humic mixtures as such. Multicomponent equilibrium models, such as the ideal
adsorbed solution theory (lAST, Radke and Prausnitz, 1972) and the simplified version of lAST known as the simplified competitive adsorption model (SCAM, DiGiano, et al.. 1978) were shown to describe humic substance adsorption after dividing the humic mixture into a set of three fictitious components (Frick and Sontheimer, 1983). This approach has been extended to kinetic simulations by Crittenden, et al.
(1987b), who used lAST to describe a synthetic mixture as a set of hypothetical components and then incorporated the multicomponent equilibrium condition into a pore and surface diffusion model to describe subsequent column performance. Fettig and Sontheimer (1987) used SCAM to describe humic mixtures as three pseudo-components and obtained surface
diffusion coefficients from batch rate data and a
multicomponent surface diffusion model. In addition to
providing better descriptions of isotherm data, other
advantages to modeling humic solutions as multicomponent
systems may become apparent when attempts are made to modelcompetitive adsorption between humic materials and toxic
pollutants.
CHAPTER 3
EXPERIMENTAL PROCEDURES
PREPARATION OF HUMIC SOLUTIONS
Raw water was obtained from Lake Drummond, Virginia, on January 27, 1986. This lake, part of the Great Dismal Swamp in southeastern Virginia, is highly colored, low in pH and alkalinity, and serves as one of the water sources for the city of Chesapeake, Virginia. Werdehoff (1986) found that raw water from Lake Drummond had an elemental composition
(by weight) of 55.7% carbon, 4.3% hydrogen, 31.6% oxygen, 0.9% nitrogen, 1.5% ash, 6% dry loss. In addition, a study
by Liao, et al. (1982), identified many products of
potassium permanganate (KMnO^) oxidation and hydrolysis of
Lake Drummond humic and fulvic acids in order to postulate functional group characteristics. Of the identified
oxidation products, benzenecarboxylic acids were found to be most abundant, followed by aliphatic dibasic acids,
furancarboxylic acids, aliphatic monobasic acids,
(carboxyphenyl)glyoxylic acids, and aliphatic tribasic acids. These groups were also identified as hydrolysis
products although the order of abundance changed to
aliphatic dibasic acids, benzenecarboxylic acids, aliphatic monobasic acids, aliphatic tribasic acids, furancarboxylic
acids, and (carboxyphenyl)glyoxylic acids. These results
led to the hypothesis that the humic material in Lake
Drummond consists of single ring aromatic structures having
three to six alkyl, carboxylic, ketone, or hydroxyl
substituent groups; short aliphatic carbon chains connecting
these structures; and polycyclic ring structures.
After being returned to Chapel Hill, the raw water was filtered through 1.0 jum honeycomb filters to remove leaves and sediment prior to further treatment. This pre-filtered water was then stored in a cool, dark storage area for
future use.
Experiments using this water were conducted over the
course of two separate time periods. The first set of experiments was conducted from February through April of 1986 and will be referred to as the 1986 data set. The second set of observations was made from April through July of 1987 and will be referred to as the 1987 data set. The results of these two data sets will be shown individually due to possible changes in the composition of the
pre-filtered raw water between February, 1986, and April, 1987.
For both sets of data, alum coagulation was the first
stage of treatment. Jar tests were performed to find the optimal alum dose for coagulation at a pH of 6.5, the
coagulation pH reportedly used by the city of Chesapeake in their water treatment plant. The results, shown in
Figure 3-1 as percent UV-254 absorbance removed as a
function of alum dose, revealed a sharp increase in removal
t
100
UJ o z:
<
CD CH
O
(/) CD
<
lO
I >
o
o
UJ
a:
"1—I—I—I—I—I—I—r
100 150 200
ALUM DOSE (mg/l)
350
FIGURE 3-1: JAR TEST RESULTS FOR LAKE DRUMMOND HUMIC MATERIAL THE SHARP INCREASE IN HUMIC
SUBSTANCE REMOVAL OVER A SMALL INCREASE IN ALUM DOSAGE MAY BE INDICATIVE OF STOICHIOMETRIC INTERACTIONS BETWEEN HYDROLIZED ALUMINUM AND CARBOXYLIC ACID
at alum doses in the vicinity of 200-210 mg/1 as
AI2(304)3'18 H2O. This type of removal has been previously
observed for humic and fulvic acids (Randtke and Jepsen, 1981; Babcock and Singer, 1979; Narkis and Rebhun, 1977) and may be a result of stoichiometric reactions between thehydrolysis product of alum and the carboxylic acid
functional groups on the humic molecules.
As a result of the jar tests, coagulation was performed
at a pH of 6.5 and an alum dose of 200-210 mg/1 for both
data sets. The coagulation procedure involved pH adjustment of 3 liter samples of the pre-filtered water from 4.3 to 6.5
by the addition of 2.4 x 10" M sodium carbonate (Na2C03)
followed by simultaneous addition of a 3 g/1 alum solution
and the Na2C03 solution. The addition step was performed at
high mixing intensity and was immediately followed byflocculation for forty minutes at 3 0 revolutions per minute. The flocculated samples were allowed to settle overnight and were then vacuum filtered with 0.45 jum membrane filters. For both experimental runs, the filtrate solutions were
combined in a 5 gal glass carboy and stored in a
refrigerator for the prevention of biodegradation.
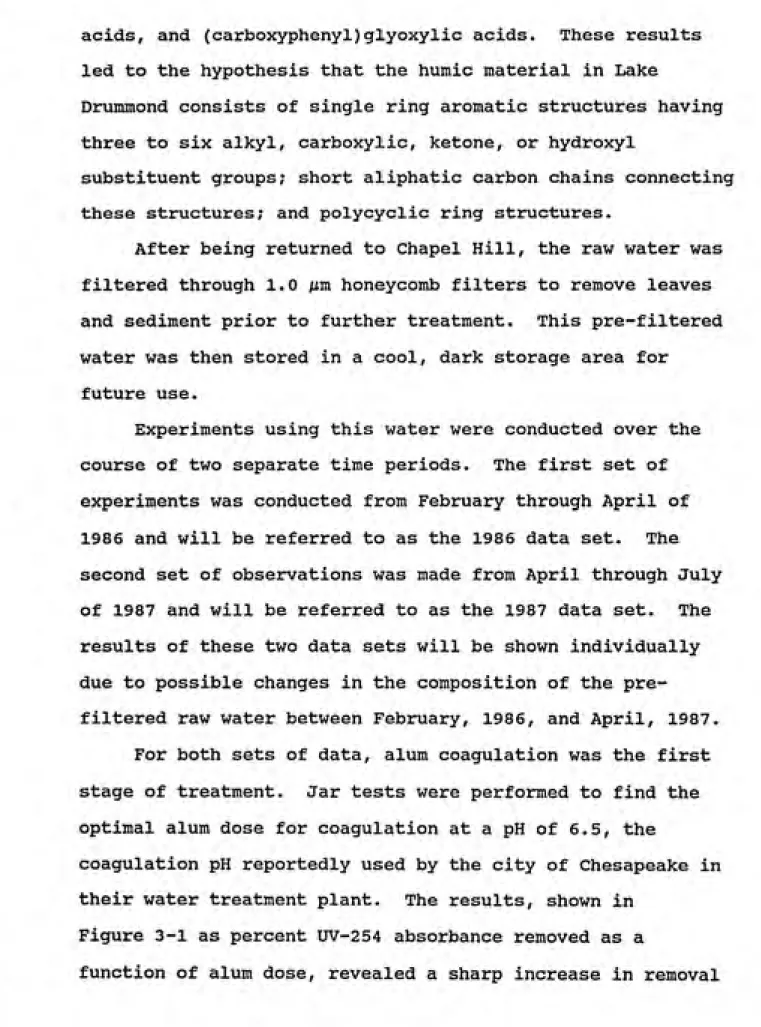
The coagulation stage was followed by treatment with
ozone (O3) and biodegradation. Batch ozonation was used for
the 1986 data set, wherein the coagulated sample (bufferedwith NaH2P04 and Na2HP04 to give a pH of 7.0) was combined
with an egual volume of distilled, deionized (DDI) water
(buffered with NaH2P04 to give a pH of 4.5) that had been
m
ozonated to a concentration of 25 mg O3/I. The ozonated
sample was then placed in the reservoir of a recycle batch
reactor (Figure 3-2), the column of which was previously
seeded with return activated sludge from the Chapel Hill
Wastewater Treatment Plant. The solution was recycled until
no further reduction in TOC was observed (the condition for biostabilization) and was then stored in a refrigerator.
The solutions from the 1987 data set were ozonated with
a semi-batch operation where ozone was bubbled through the
coagulated solution. The ozonation system, depicted in
Figure 3-3, utilized two circuits for the determination of
apparent ozone dose (ADD). The actual ozonation procedure
was as follows:
1. The ozone generator was turned on with ozone carried directly to the vent. The generator
was allowed to run for at least 15 minutes in
order to reach stabilization.
2. All four gas washing bottles were filled with 500 ml of 40 g/1 potassium iodide (KI).
3. The flow of ozone was directed to the
secondary circuit for a specified time period (2-3 minutes) and allowed to react with the KI
solutions.
4. The ozone flow was switched to the primary circuit to allow reaction with the coagulated
solution. Unreacted ozone flowed from the
reactor to the gas washing bottles to react with the KI solutions. This step was also carried out at a specified time period, depending on the desired ozone dose.
5. During Step 4, the gas washing bottles from the secondary circuit were emptied, rinsed, refilled with KI solution, and placed back on
the circuit.
AIR VENT
ANTHRACITE o
O ^
oCOLUMN
REACTOR
0
0
o
o
o o
^^^^^^^^^M
o ^
0 oo
o o 0
o
AIR
El
ililliiiii ...tf/^y
/^
iiiiiii iiPiiiiii
;*ss;:;:js;*s4«¥:*;s;:s;:
iiiiiiiiil
I j
x__^ ( )
PERISTALTIC
PUMP
RESERVOIR
k
i
OXYGEN
FLOW
CONTROL VALVES
r^
NITROGEN
DESSICATORS
VALVE
FLOW
METER
vfffffinnmfvfffffffvrvnvffrvffmmi
OZONE
GENERATOR
TO VENT
SECONDARY CIRCUIT
PRIMARY CIRCUIT
OZONE REACTOR
Kl Kl
FIGURE 3-3: SEMI-BATCH OZONATION APPARATUS
6. After the specified time period of Step 4, the ozone was redirected to the secondary circuit for the same time period as Step 3.
7. The gas flow was switched to vent and the
ozone generator was turned off. The oxygen tank was then shut off and the nitrogen tank
was opened. Nitrogen was allowed to pass
through the system for at least 15 minutes to
purge any residual ozone out of the system.
8. The nitrogen was then allowed to pass through the primary circuit for 2 hours to strip
unreacted ozone from the solution.
During Steps 7 and 8, the lodometric Method (Standard
Methods, 1975) was used to determine the amount of ozone
reacted in the secondary circuit before and after ozone
contact with the primary circuit. The ozone generation
rates were calculated from the amount of ozone reacted by
the following equation:
re = ([03JKI • V^i) / t (3-1)
where Tq is the ozone generation rate, [03]j^j is the amount
of ozone reacted in the KI solution, Vj^j is the volume of
the KI solution, and t is the time period for which the
ozone was passed through the KI solution.
After purging the primary circuit with nitrogen, the
same method was used to determine the amount of ozone
reacted with the KI solutions in the exhaust stream. Thus,
the ozone exhaust rate was calculated as follows:
^E = ([033kI • ^Ki) / t (3-2)
where r^ is the rate of ozone delivery through the exhaust from the reactor. The amount of ozone depleted in the
reactor was then calculated from
[03]r = [(r^avg " ^e) * t] / V^ (3-3)
where [03]j^ is the amount of ozone reacted in the humic
solution, r^ ^^^ is the average of the generation rates
calculated before and after ozonation of the humic solution,
and Vj^ is the volume of the humic solution in the reactor. The AOD was calculated by dividing [03]j^ by the TOC of the coagulated humic mixture prior to ozonation.
Using the above procedure, three batches of the
coagulated solution were ozonated at three separate ozone
dosages by varying the time of ozonation. After ozonation, the samples were biostabilized the same way as those of the
1986 data set with the exception that the bacterial seed was obtained from the effluent of a laboratory GAC column using ozonated humics as the adsorbate (DeWaters, 1987).
Prior to refrigeration and subsequent testing, all of
the above samples received 6.5 mM of Na"*" from the addition
of phosphate buffer (575.5 mg/1 NaH2P04 and 118.3 mg/1 Na2HP04) and the samples from the 1987 data set received 5 mg/1 of sodium azide (NaN3). The buffer was added to maintain a pH of 6.5 during the testing while the NaN3 was
added to inhibit biological growth in experiments performed on samples that were ozonated and not biostabilized. Tests
showed that this dose of NaN3 was not enough to prevent
bacterial removal over 7 days in these samples. Thus,
adsorption results will not be reported for ozonated and
non-biostabilized humic mixtures. However, NaN3 was added
to the other solutions from the 1987 data set to maintain consistency as the ozonated and non-biodegraded solutions were intended for comparisons with the rest of the solutions
from that data set.
ANALYSIS OF HUMIC SOLUTIONS
All of the solutions described above were characterized
by total organic carbon (TOC) content, a useful measure of
the concentration of unknown organic mixtures. Samples from the 1986 data set were analyzed with a Beckman Model 915-B TOC Analyzer. The Beckman analyzer uses high temperature
catalysis for combustion of organics to carbon dioxide (CO2)
and measures total carbon (TC) with an infrared (IR)
detector. Potassium hydrogen phthalate (KHP) was used to set up a linear calibration between the IR readout and TC. The manufacturer's specifications stated that the process resulted in a maximum error of ± 2% of full scale due to the linear assumption. In addition, the manufacturer reported a maximum error of repeatability of ± 2% of the full scale for
TC > 5.0 mg/1 and ± 4% of the full scale for TC < 5.0 mg/1.
When using this instrument, all samples were brought to a pH
of 2 with concentrated sulfuric acid (H2SO4) and purged with
nitrogen to remove inorganic carbon (IC) prior to analysis. This procedure would also remove volatile organic carbon
(VOC) implying that the TOC referred to in this report is
non-purgeable organic carbon.
The samples from the 1987 data set were analyzed with
O. I. Corporation's Model 7 00 TOC Analyzer. Samples
introduced into the 01 700 were automatically acidified with 5% phosphoric acid, purged to remove IC (as well as VOC), and analyzed to measure IC. After the purging step, sodium
persulfate (100 g/1 Na2S20g) was introduced to the sample in
a 100°C reactor to oxidize the organics to CO2. The CO2 was
subsequently purged to an IR detector and measured against a a linear KHP calibration to yield TOC (actually
non-purgeable organic carbon). The specifications for this
instrument indicate a ± 2% of full scale error as a result
of the linear assumption and a ± 2% of full scale error of repeatability for sample concentrations greater than
0.002 mg/1.
Measurements made on all of the samples yielded the results posted in Table 3-1 and provide several insights. The results for both pre-filtered samples indicate that Lake Drummond is extremely high in organic content. In addition, the results indicate a loss of 8% TOC in the pre-filtered sample between early February, 1986, and early April, 1987.
Some flocculation and sedimentation was observed to have
occurred in the pre-filtered waters over the fourteen month storage period. Biodegradation could conceivably account
#
TABLE 3-1
TOC Concentrations of the Humic Mixtures Tested
Humic Mixture
(mg O3/I)
1986 1987
TOC (mg/1)
1986 1987
Pre-Filtered
Coagulated
Ozone Dose #1 + Biostabilization Ozone Dose #2 + Biostabilization Ozone Dose #3 + Biostabilization
0.0 0.0 43.8 40.3
0.0 0.0 21.7 16.3
12.5 13.2 7.00 13.3
--- 39.6 --- 10.5
m
for some of the loss as well, although it is unknown as to
whether this phenomenon actually took place.
The coagulation results showed a 50.5% TOC reduction in
the 1986 data set and a 59.6% TOC reduction in the 1987 data
set, even though both experiments utilized the same range of
alum doses. The steepness of the curve for UV absorbance (a
surrogate for TOC) versus alum dose in Figure 3-1 shows that
it is extremely difficult to repeat the same TOC removal by
coagulation in the alum dose region used. In addition, the
TOCs for the coagulated mixtures allows the calculation of
the AODs for each of the ozonation and biostabilization
stages. The resulting AODs are posted in Table 3-2. For
the ozonation performed in the 1986 data set, AOD was
calculated based on the assumption that all of the ozone in
the DDI water reacted with the TOC of the coagulated
mixture. In addition, since equal volumes of the two
solutions were combined, the initial TOC was 10.85 mg/1 just
prior to ozonation.
Table 3-3 lists the values of TOC obtained immediately
after ozonation as well as the percent of coagulated TOC
removed due to the ozonation steps and due to the combined
ozonation and biostabilization steps. The results indicate
that 33% - 40% of the TOC removed by ozonation and
biostabilization was removed by the ozonation step in the
1987 data set while only 4% of the TOC removed by ozonation
and biostabilization was removed by the ozonation step in
the 1986 data set. This result indicates that the organics
TABLE 3-2
Apparent ozone Doses (AODs) for the
ͫ
arlous Osonatioa Stops
Humic Mixture
(mg O3/I)
1986
AOD
(mg 03/mg TOC)
1987 1986 1987
Ozone Dose #1
Ozone Dose #2
Ozone Dose #3
12.5 13.2
39.6
89.3
1.15 0.81
2.43
TABLE 3-3
TOC Removals Due to Ozonation and the Combined Treatments of Ozonation and
Biostabilization
TOC TOC After O3 and % TOC % TOC
AOD Data After Oo biostabilization Removed Removed by O3 &
(mg 03/mg TOC) Set (mg/1) (mg/1) by O3 --•---•--•-^
Biostabilization1.15 1986 10.7
0.81 1987 15.3
2.43 1987 13.9
5.48 1987 12.9
7.00 1.4
13.3 6.1
10.5 14.7
6.92 20.9
35.5 18.4
in the 1987 data set were much more readily oxidized by
ozone to CO2 as compared with organics in the 1986 data set.
This observation may also be indicative of the removal of
volatile ozonation products prior to TOC measurement in the
solutions of the 1987 data set. These differences may be a result of buffer conditions since the phosphate buffer usedin the 1986 data set may reduce the amount of radical OH*
reactions taking place due to the lower pH. Thus, the
ozonation step in the 198 6 data set may have been more
selective than the ozonation step in the 1987 data set. Any
additional differences in starting materials are noted in
Table 3-4.
Based on literature reports of a linear relationship
between ultraviolet absorbance at a wavelength of 254 nm
(UV-254) and TOC (Edzwald, et al.^ 1985; Singer, et al.,
1981), the possibility of using UV-254 as a surrogate for
TOC was investigated for the 1986 data set. UV-254 was
determined with a Varian Cary 219 Spectrophotometer and the
results are posted in Table 3-5 along with comparisons
between the percent removal of UV-254 and the percent
removal of TOC for a given treatment stage. In addition,
correlations between TOC and UV-254 are depicted in Figure
3-4 and are shown to be guite linear. However, the results
posted in Table 3-5 and Figure 3-4 show that coagulation, as
well as the combined treatments of ozonation andbiostabilization, removed more UV-254 than TOC. These
results imply that both treatment steps preferentially
TABLE 3-4
Characteristics of the Coagulated Humic Solutions Prior to and During Ozonation
1986 1987
TOC After Coagulation
% TOC Removed During Coagulation
Buffer During Ozonation
Ozone Contact Method
10.9 16.3
50.5 59.6
phosphate none
TABLE 3-5
UV-254 Values for the 1986 Humic Solutions and Comparisons Between UV-254
Removals and TOC Removals
Humic Mixture
UV-254
% UV-254
Removed from
Previous Stage
% TOC Removed from Previous Stage
Pre-Filtered 144.6
Coagulated 47.8
Ozonated & Biostabilized 10.4
66.9 78.2
#
50
40-^30
<
CO
0^
o
in <
^ 20
CM
I >
3
10-y
o PRE-FILTERED HUMICS
D COAGULATED HUMICS
A OZONATED & BIOSTABILIZED HUMICS
^
1—\—I—r15
TOTAL ORGANIC CARBON (mg/l)
FIGURE 3-4: CORRELATION BETWEEN TOTAL ORGANIC CARBON AND UV-254 ABSORBANCE FOR THREE HUMIC
MI>nrURES TESTED FROM THE 1986 DATA SET. SOLID LINES INDICATE THE BEST LINEAR FIT
remove humic molecules that absorb ultraviolet light at a wavelength of 254 nm. Semmens and Field (1980) noted this result for coagulation and several investigators have made the same observation for ozonation (Sierka and Amy, 1985; Somiya, et al.. 1986; Stephenson, et al.. 1979). Decreases
in UV-254 indicate the removal or oxidation of carbon-carbon
double bonds and chromophoric groups such a -OH and -NH2
(Anderson, et al.. 1986) and, therefore, the results suggest that the chemical composition of humic mixtures are
significantly changed by these treatments in comparison with organic content. Based on these results, one can conclude that the correlation between UV-254 and TOC is system
specific and should be judiciously applied.
DETERMINATION OF EQUILIBRIUM ADSORPTION BEHAVIOR
Adsorption isotherms were determined for all humic
solutions by using the bottle point method. This method can be carried out by using two different approaches. The first involves the addition of varying adsorbent doses to bottles containing a known volume and constant initial concentration
of the solution of interest while the second consists of the
addition of varying concentrations of the solution of
interest to bottles containing a known and constant mass of adsorbent. The former approach is termed as the "constant
Cq approach" while the latter is known as the "constant dose
approach." For solutions containing only one adsorbate.
both approaches would yield the same isotherm. However, due
to the heterogeneous nature of humic solutions, each approach yields a different result. In addition, the
constant Cq approach yields isotherms that are dependent on
the initial concentration, Cq, and the constant dose
approach yields isotherms that are dependent on the
adsorbent dose, D (Weber, et al.. 1983). These divergent results are caused by competitive adsorption among the different humic species. However, any multicomponent
equilibrium model can account for these dependencies and, as
a result, the constant Cq approach was used for all isotherm
studies. Another drawback to the bottle point method, as discussed by Wang (1986), is the possibility of
overpredicting equilibria observed in adsorption columns.
This was considered to be a result of the fact that the
bottle point method approaches equilibrium from high to low concentration while columns approach equilibrium from low to
high concentration.
In order to achieve sufficiently fast equilibration, powdered activated carbon (PAC) was used in the isotherm experiments. The PAC was prepared from Calgon F-400
granular activated carbon (GAC) by washing with DDI water in a Soxhlet Extractor, drying at 110°C, grinding to a 200/325 U.S. mesh size, and storing in bottles in an air-tight
dessicator. This procedure, described by Randtke and
Snoeyink (1983), was used to ensure that a representative sample of the "as received" GAC was used. Summers (1986)
showed that this carbon is positively charged below a pH of 10.0 and has a relatively small total surface area. In this manner, a batch of PAC was prepared for the 1986 data set
and another batch was prepared for the 1987 data set.
The test solution was transferred in 100 ml aliquots to a total of 13 to 2 0 bottles containing a range of PAC doses
from 5 mg/1 to 4000 mg/1. The bottles, including a control
bottle containing no PAC, were then placed on a tumbling apparatus for a period of 7 to 10 days at a temperature of 23°C. This equilibration time was determined to be adequate after tests showed little change in adsorption of humic
material after 7 days based on measurements of UV-254. At the end of the equilibration period, the bottles were
filtered with 0.45 um membrane filters to remove PAC and the TOC of each sample was then measured. Table 3-6 provides a summary of this procedure to elucidate any differences
between the 1986 and 1987 data sets.
DETERMINATION OF ADSORPTION RATE BEHAVIOR
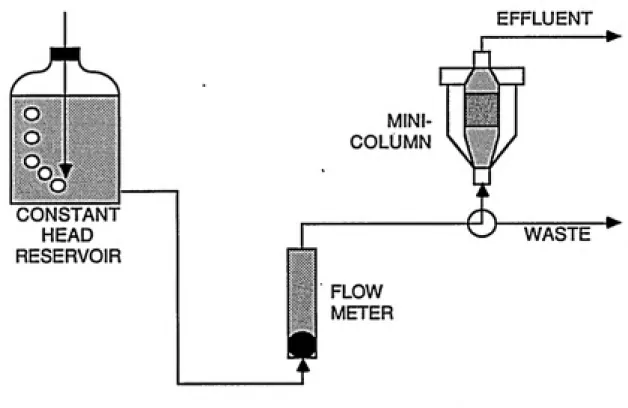
Mini-Column Studies
The external mass transfer characteristics were
determined through the use of a short, fixed-bed reactor
known as a mini-column. A theoretical treatment of how the
mini-column works is given in Chapter 4 as this section will
be devoted to procedure only. Figure 3-5 shows a schematic
TABLE 3-6
Methodology Differences Between the 1986
and 1987 Isotherm Studies
1986 1987
PH
[Na"^] from Phosphate Buffer (mM)
Sodium Azide (mg/1)# of Observations (Bottles)
Range of PAC Dosages (mg/1)
Equilibration Time (days)
Temperature (°C) TOC Analyzer
6.5 6.5
6.5 6.5
0.0 5.0
12 - 13 20
5 - 4000 5 - 4000
7-10 7
EFFLUENT
CONSTANT
HEAD
RESERVOIR
MINI-COLUMN
f
FLOW
METER
WASTE
FIGURE 3-5a: SCHEMATIC OF MINI-COLUMN SETUP
d
?
d
m
GLASS SUPPORT
MEDIA
GRANULAR ACTIVATED CARBON
GLASS
SUPPORT MEDIA
of the mini-column setup which was constructed on the basis
of work done by Cornel, et al. (1986b), and Roberts, et al.
(1985). The reactor, made of lucite, had an internal
diameter of 2 cm and two stainless steel screens, separated by 5 cm, between which the bed was placed.
A single batch of 18/2 0 mesh GAC was prepared from "as received" F-400 GAC in the same manner as the isotherm PAC
batches were prepared. Just prior to testing, a certain
amount of GAC was weighed, placed in DDI water, brought to
boiling, and immediately cooled to fill the pores with the
DDI water.
In the meantime, the column was filled with DDI water
and a GAC support material was placed in the column's cone
of expansion. This support material was 3 mm glass beads for the 1986 data set and was changed to 18/20 mesh crushed
glass tubing for the 1987 data set to better approximate the hydrodynamics of the carbon bed. The prepared GAC was then immersed in the column to form a layer over the glass
support. This step was followed by the addition of glass
beads or crushed glass to fill the column volume. The
column was then sealed and the effluent tube was filled to capacity with DDI water.
A constant head reservoir was filled with the solution to be tested and 250 ml of solution were allowed to pass
through the tubing and sent to waste just prior to the
mini-column. Since the tubing was estimated to hold a volume of
80 ml, this step was considered necessary in order to provide undiluted solution through the entire tube.
A stopcock was opened at a time previously determined to be zero such that the test solution would begin to flow
through the column. The flow meter was immediately checked
to confirm a steady flow rate of 25 ml/min and, at a time of 30 seconds, sampling was begun such that samples were taken over the course of one minute each. A sample was considered to be taken at the midpoint of the time range covered by the sample (i.e., the sample taken from t = 30 seconds to t = 90 seconds was considered to be taken at 60 seconds). This procedure was halted after 10.5 minutes of run time and was immediately followed by verification of flow rate with a graduated cylinder. The temperature was recorded and the TOC of each sample was subsequently measured to yield average concentrations over the time range of each sample.
Batch Rate Studies
Internal diffusion rates of humic substances were
determined in completely mixed batch reactors. Once again,
the theory of determining internal diffusion rates will be
discussed in Chapter 4, leaving this discussion to
procedures only.
The batch rate tests employed an impeller constructed
of polyvinylchloride (PVC) to provide the mixing. This
impeller was designed from a similar device in use at the
labs of the Engler-Bunte Institute at the University of Karlsruhe, Federal Republic of Germany (Fettig, 1986). A
GAC trap was located at the point of flow input to the
impeller as shown in Figure 3-6. This method of GAC contact with the aqueous solution prevents break-up of carbon
particles as is commonly observed in conventional batch
stirring systems. In addition, the device provides a
consistent hydrodynamic regime that should eliminate
variability in external mass transfer limitations. The trap consisted of two stainless steel screens (to keep the GAC from entering the entire solution) and an outer wall made of
PVC that was capable of being attached to the impeller. The
tests utilized the same batch of GAC that was used in the
mini-column and the GAC was prepared in the same manner (i.e., weighed, boiled in DDI water, and cooled to fill the pores). Twelve hours prior to testing, 3 liters of solution were transferred to a 4 liter glass beaker and the impeller, containing no GAC, was placed in the solution and attached to a motor which was immediately started. This step was run
to examine the possibility of humic substance adsorption to
PVC. After 11.5 hours, a 40 ml sample was taken from the beaker and analyzed for TOC. Comparisons between this value
of TOC and the initial TOC showed, in all cases, adsorption on PVC as negligible. The GAC was prepared in the next half
hour, transferred to the GAC trap one minute before start¬
up, and the trap was then attached to the impeller. The
impeller was immersed in the test solution and attached to
s _ /
J1111I iiifr—^'- 'iiTi «^>w.
^in^iii^lUiiM^y>
?
^m iiiii ͣͣͣyini%
GRANULAR ___ACTIVATED
CARBON
TRAP
FLOW
m
the motor which was immediately started. Samples were taken
at exponential intervals (i.e., short time intervals between
samples at the beginning of the run and long time intervals
near the end of the run) over a period of 190-225 hours and were immediately analyzed for TOC. This sampling method
allowed a more accurate measurement of the larger change in concentration with time at the beginning of the test.
CHAPTER 4
PROCEDURES FOR MODELING THE ADSORPTION OF UNKNOWN MIXTURES
ADSORPTION EQUILIBRIA
Ideal Adsorbed Solution Theory
Due to the heterogeneous nature of humic substance
mixtures, the model to be used must be able to describe
humic adsorption equilibria based on multicomponent
adsorption theories. Frick and Sontheimer (1983) showed that such a description is possible by using ideal adsorbed solution theory (lAST) to model the adsorption isotherms of
unknown mixtures when the mixtures were treated as a set of
three pseudo-components (PCs). The lAST model performs a non-linear curve fitting routine to minimize deviations between observed and calculated results by systematically adjusting the appropriate adsorption parameters. The
mathematical technique of this process will be shown below.
Conceptually, this process reduces the complexity of humic solutions such that each PC may be considered as
representative of a group of actual components having
similar adsorbabilities. While an appealing approach, the
limitations of extending lAST to model humic substance
adsorption must also be understood.
m
lAST was first developed by Myers and Prausnitz (1965)to describe and predict the adsorption of gaseous mixtures
on a thermodynamically consistent basis. Radke and Prausnitz (1972) then extended lAST to multisolute adsorption from dilute liquid solutions. As with any
equilibrium process, a favorable change in free energy must
accompany the adsorption of solutes from the bulk liquid phase to the adsorbed phase. This thermodynamic concept was incorporated with the following assumptions: (1) the solid phase is inert and has an identical specific surface area
for all adsorbates, (2) the bulk liquid phase is a dilute
solution obeying Henry's Law, and (3) the adsorbed phase is
solvent free and forms an ideal solution obeying Raoult's Law when solutes adsorb simultaneously at constant
temperature and spreading pressure.
Spreading pressure is defined as the change in
interfacial tension between the solid and adsorbed phases
resulting from the addition of solutes to a pure solvent
system. Therefore, a constant spreading pressure implies
that the interfacial tension must also be constant. Since
the adsorbed phase is considered to be two dimensional, the
interfacial tension is analogous to the three dimensional
pressure of the ideal gas law. The assumption that the adsorbed phase is solvent free (see assumption 3 above)
implies that the spreading pressure is equal to the
interfacial tension and, therefore, spreading pressure is
also analogous to three dimensional pressure.
The above assumptions lead to the following equation:
l/qi =Ji(Zi/q°i) (4-1)
Equation 4-1 relates the total amount of solute adsorbed,
qip, to the loadings, q'^, that would occur if each of the N
solutes were to adsorb singly from dilute solution at the same temperature and spreading pressure as the mixture. The mixture and single solute systems must be considered at the same temperature and spreading pressure since these two intensive variables set the equilibrium state of eachsolute. The total surface loading is defined as the sum of the individual solute loadings in the adsorbed phase mixture
as follows:
N
Thus, qj^ is the adsorbed phase concentration of solute i
when solute i is adsorbed from the bulk liquid phase. The
surface mole fraction, z^, used in Equation 4-1 is defined
as:
^i ^ ^i/^T ^°^ i = 1 to N. (4-3)
The assumptions made to arrive at Equation 4-1 seem
somewhat reasonable for the bulk liquid phase. However, PAC
and GAC are not inert materials as they contain many surface
functional groups that are capable of reacting with solute
functional groups (Mattson and Mark, 1971; Smisek and Cerny, 1970). In addition, the pore structure of activated carbons
can effectively exclude larger solutes from interior
adsorption sites (as evidenced by Lee, et al.. 1981) thereby implying that an identical specific surface area is not
available for all solutes.
For the adsorbed phase assumptions, a solute follows
Raoult's Law only as Zj^ approaches 1, especially if the
solute is significantly different from others in solution. Since, in this case, the adsorbing mixture is a natural humic solution containing a multitude of solutes, it would appear unlikely that any component would approach a mole fraction of unity in the adsorbed phase. Thus, humic
solutions are highly unlikely to follow the assumption of an ideal adsorbed phase. In addition, some of the PAC or GAC functional groups could conceivably attract water (the solvent) into the adsorbed phase via such mechanisms as
hydrogen bonding. Despite these drawbacks, lAST will be
shown to work reasonably well for humic solutions adsorbing
onto activated carbon.
At equilibrium, the chemical potential of the bulk
liquid phase must equal the chemical potential of the
adsorbed phase. As a result, the lic[uid phase concentration