Full Year Results
Presentation
Full Year ended 31 March 2016
@BritishLandPLC www.britishland.com #BLFY2016 $BLND
Results Overview
Chris Grigg
4
Results highlights
•
Another strong set of results
•
Underlying profits up 16% to £363m
•
NAV up 11% to 919p
•
Good performances across
the business
•
Rising rental growth and strong lettings
Well positioned for the future
•
Resilience built into the company
•
Optionality in our development pipeline
6
A resilient business
•
Quality of income
–
Long leases – 9 years to first break
–
High occupancy (99%)
–
Modern buildings
•
Over £1.4bn of Retail assets recycled
•
Strength of financing
–
Gearing at 32%
–
Long average debt maturity – over 8 years
–
Weighted average interest rate at 3.3%
Optionality embedded into our development pipeline
•
180,000 sq ft of offices
–
4 Kingdom Street
–
Clarges Mayfair
•
Glasgow Fort extension
•
100 Liverpool Street
•
1 Finsbury Avenue
•
Plymouth Leisure
•
1 Triton Square
•
Blossom Street
•
Meadowhall Leisure
•
2–3 Finsbury Avenue
•
Eden Walk, Kingston
•
Canada Water
Committed
Near term
Medium term
2017
2016
8
Aligning our strategy to long term trends
Key long term trends
Implications for British Land
Globalisation
Continued strength
of London
Transforming impact
of technology
Rise of omnichannel
Population growth
and urbanisation
Sharpened focus
on end user
Importance of
infrastructure
Blurring of work
and leisure
Placemaking lies at the heart of our business
Offices
Retail
Lifestyle orientated mixed use offices
Multi-let lifestyle centres
Regional
Attracting visitors from a wide
catchment for a planned trip
Local
Fitting into the daily life of
local communities
Campuses
Large, office-led mixed use
lifestyle campuses
Campus-lite
Smaller clusters
10
Our purpose and strategy is aligned around
Places People Prefer
Strategic focus
Customer Orientation
Right Places
Capital Efficiency
Expert People
Placemaking
We Connect
We Design
We Enhance
We Enliven
Values
Places People Prefer
How Britain shops today
90%
of shopping spend touches
the physical store
Source: IPF/Conlumino
<20 mins
average customer drive time
to BL assets
Source: Kantar Source: British Land surveys
Convenience ranked
#1
importance for a shopping trip
70%
more click and collect than
national average
39%
of food eaten out
of home in the UK
28%
of BL visitors
use F&B/leisure
Source: ONS/British Land surveys12
A well positioned multi-let portfolio
BL regional centres BL local centres BL asset catchments
Average rent
to sales ratio
10
%
Annual footfall of
330
m
90
%
of our car parking
spaces are free
Potential to reach
60%
Our data shows both regional and local can succeed
Off-peak
Meadowhall Glasgow Fort
Ealing
Broadway
Doncaster
Wheatley
Regional
Regional
Local
Local
Size (‘000 sq ft)
1,500
510
470
232
Drive time (mins)
24
16
10
12
Frequency
of visit
33 pa
50 pa
70 pa
52 pa
Dwell time (mins)
118
78
69
55
Annualised spend
£3,358
£2,751
£3,056
£2,798
14
32%
18%
16%
13%
9%
3%
9%
Attracting a more diverse occupier base
Lettings and renewals by sector by rent
Retailers taking space in
non-traditional locations
Letting/renewals
ahead of ERV
8.0
%
Fashion & Footwear
General Retail Food & Leisure
Health & Beauty Electrical & Mobile Phone
DIY Other
Our Retail operational metrics remain strong
+3.0%
+2.4%
Foot
fa
ll
Ret
ail
er
in
-store sal
es
Regional
+2.9%
+3.2%
Total multi-let
portfolio
Local
+2.2%
+3.2%
Ahead of market by
440 bps
Ahead of market by
200 bps
3.4%
3.5%
3.3%
Ahead of market by
200 bps
ERV
gr
ow
th
16
Local: Providing convenience and quality at
Old Market, Hereford
Footfall
+11.5%
Rent to sales
8%
ERV
+4.9%
Regional: Expanding and improving Glasgow Fort
Footfall
+6.7%
Leisure/F&B
13%
ERV
+4.7%
18
Investment driving performance at Meadowhall
•
On site with a
£60m
refurbishment
•
Attracting new occupiers
•
Substantial leisure
extension planned
New additions
Delivering growth across our London campuses
Our 3 campuses as
a % of office assets
>
70
%
Paddington Central
Broadgate
Regent’s Place
20
Regent’s Place: A model for our
campus approach
•
A more diverse occupier base
•
Significant rental growth
–
25% ERV growth over last
three years
–
Rent reviews 30% above
previous passing rent
•
Further growth from development
ERV growth in FY2016
13.3
%
TMT Government Financial Services Manufacturing General RetailProfessional and Corporate Other
33%
3%
17%
19%
3%
12%
13%
Transforming Broadgate into a London destination
•
Buildings for a wide range of occupiers
•
Increasing and diversifying retail offer
22
100 Liverpool Street
•
Major development opportunity
•
Significant retail and leisure
Significant potential at Paddington Central
•
Progressing public realm improvements
and campus completion
•
Due to top out at 4 Kingdom Street
this month
•
New co-working space opening at
2 Kingdom Street
24
A focus on campuses driving Office performance
•
Our actions contributed
45% of the valuation uplift
–
ERV growth a key driver
•
Lettings/renewals 6% ahead of ERV
–
Setting new rental highs
at Leadenhall
•
Offices portfolio c10% reversionary
•
Rent reviews a more
important element
•
Overall, leasing activity
added over £13m of rent
ERV growth FY2016
Canada Water
•
Roger Madelin appointed
Financial Review
Lucinda Bell
Highlights
FY to 31 March
2015
2016
Change
%
Underlying Profit (£m)
313
363
16.0
Underlying Earnings per Share (p)
30.6
34.1
11.4
Dividend per Share (p)
27.7
28.4
2.5
Valuation Performance
12.1%
6.7%
EPRA Net Asset Value per Share (p)
829
919
10.9
LTV
35%
32%
28
Underlying profit up £50 million
£m
313
18
15
27
(4)
(6)
FY 2015 Developments Like for like rental growth Financing activities Investment activity Administrative expenses FY 2016
363
Net rental income
1.5% 4.2% 2.3% Retail Offices Total585
23
15
40
(43)
FY 2015 Developments Like for like rental growth Acquisitions Disposals FY 2016
620
1.4% 6.8% 3.4% Retail Offices Total£m
30
Financing Costs
£m
(201)
27
(11)
10
(5)
FY 2015 Financing activity Acquisitions Disposals Completion of developments
FY 2016
(180)
Income statement
FY to 31 March
2015
2016
Change
%
Net Rental Income (£m)
585
620
35
6.0
Fees & Other Income
1(£m)
17
17
-
-
Administrative Expenses
1(£m)
(88)
(94)
(6)
6.8
Net Finance Costs (£m)
(201)
(180)
21
(10.4)
Underlying Profit (£m)
313
363
50
16.0
Underlying Earnings per Share (p)
30.6
34.1
3.5
11.4
Dividend per Share (p)
27.7
28.4
0.7
2.5
1 Fees & other income and administrative expenses have been restated to reflect the change in presentation of the results of Broadgate Estates, a wholly owned subsidiary of the
32
Valuation performance
FY to March 2016
Valuation
£bn
Uplift
£m
Uplift
%
Yield
Compression
bps
ERV
Growth
%
NEY
%
Weighting
%
Retail & Leisure
7.3
184
2.4
13
2.4
5.0
49
Offices & Residential
7.0
761
11.8
21
9.6
4.4
49
Canada Water
0.3
5
1.7
13
0.5
3.2
2
Total
14.6
950
6.7
17
5.3
4.7
100
- Of which Standing
Investments
13.9
857
6.4
- Of which
Development
0.7
93
9.4
Valuation growth drivers – Retail & Leisure
FY to March 2016 Valuation
£bn
Uplift
£m
Uplift
%
Yield Compression
bps
ERV Growth
%
H1
H2
FY
H1
H2
FY
H1
H2
FY
Regional
2.8
86
2.8
0.2
3.0
11
4
15
1.7
1.8
3.5
Local
2.4
61
1.5
1.1
2.6
7
2
9
1.0
2.2
3.3
Multi-let
5.2
147
2.2
0.6
2.8
9
3
12
1.4
2.0
3.4
Dept St + Leisure
1.0
59
3.4
2.5
6.0
19
17
37
0.2
0.2
0.4
Superstores
0.8
(20) (1.7) (0.5) (2.1)
(5)
1
(6) (0.9) (0.3) (1.3)
Solus/Other
0.3
(2) (0.1) (0.4) (0.5)
1
1
2
0.1
0.0
0.1
34
Valuation growth drivers – Offices & Residential
FY to March 2016 Valuation
£bn
Uplift
£m
Uplift
%
Yield Compression
bps
ERV Growth
%
H1
H2
FY
H1
H2
FY
H1
H2
FY
West End
3.9
458
8.1
4.6
12.8
24
3
28
4.1
5.6
9.9
City
2.9
288
8.5
2.4
11.1
16
(4)
12
4.8
4.3
9.3
Offices
6.8
746
8.3
3.7
12.1
20
-
21
4.4
5.0
9.6
Residential
0.2
15
6.7 (0.3)
5.7
Offices &
Residential
7.0
761
8.2
3.5
11.8
Growth in diluted EPRA net asset value
829p
68p
17p
34p
(26p)
(3p)
Mar 15 Offices & Residential
Retail & Leisure Underlying Profit Dividends Finance transaction costs Mar 16 Stamp duty change 13p
919p
36
Strength of debt metrics
Proportionally Consolidated
31 Mar 2015
31 Mar 2016
Loan to Value (LTV)
35%
32%
Loan to Value pro-forma for 2012 bond conversion
32%
29%
Weighted Average Interest Rate
3.8%
3.3%
Interest Cover
2.6x
3.0x
Average Maturity of Drawn Debt (years)
8.7
8.1
Group
31 Mar 2015
31 Mar 2016
Loan to Value (LTV)
28%
25%
Available undrawn facilities
£1.2bn
£1.2bn
Weighted Average Interest Rate
3.3%
2.6%
Offices to Let Residential to Sell Pre sold/ pre let 100 Liverpool Street 1 Finsbury Avenue & 1 Triton Square 5 Kingdom Street & Blossom Street Retail Residential
0
200
400
600
800
1,000
1,200
1,400
1,600
Development programme
•
Current speculative commitment
£0.5bn, 100% of costs fixed
•
Speculative development
commitment is 4%, limit of 10%
•
Expecting to commit to
100 Liverpool Street in early 2017
•
Optionality across the
development pipeline
•
Further medium term opportunities
at Canada Water, Eden Walk
and Meadowhall
Committed
Near-Term Pipeline
38
Future income growth
Annualised Gross Rents Cash Flow Basis
£m
Accounting Basis £m
Current Passing Rent 610
641
Contracted Uplifts 77
Total Contracted Rent 687
Developments – Under Construction 16 14
RPI linked leases 7 7
Reversion 47 39
Potential Rent in 5 Years excl Near Term Developments 757 701
Near Term Developments - 100 Liverpool Street 10 7
Near Term Developments - 1 Triton Square 15 9
Near Term Developments - 1 Finsbury Avenue 3 1
Near Term Developments - Other 41 36
Potential Rent in 5 Years incl Near Term Developments 826 754
Increase 35% 18%
Valuation rent, includes assumptions on outstanding rent review settlements
RPI-linked leases assumed at 2.6% per annum and uplift at rent review based on ERVs determined by the Group’s valuers Excludes owner occupier space
Outlook
Chris Grigg
40
Outlook
•
British Land is well positioned
•
Operationally and financially resilient
•
Significant development pipeline with optionality
42
Gross investment
activity in 2016
-1,600 -1,200 -800 -400 0 400 800 1,200Broadly balanced investment activity
Investment Activity
Disposals Acquisitions & Capital Investment Net Spend
£52m £648m (£267m) Net Spend £m 2013 2014 2015 2016 £21m
£1,257m
Note: 2015 restated to exclude post period end acquisition of 1 Sheldon Square, which is now included in 2016.
£484m
Investment Activity
From 1 April 2015
Retail
£m
Offices
£m
Residential
£m
Total
£m
Development Spend
17
140
30
187
Capital Spend
99
19
2
120
Purchases
100
232
–
332
Sales
(420)
(139)
(59)
(618)
Net Investment
(204)
252
(27)
21
Gross Investment
636
530
91
1,257
44
Acquisitions
From 1 April 2015
Area
Price
(Gross)
£m
Price
(BL Share)
£m
Annual
Passing
Rent
£m
2Completed
1 Sheldon Square
Offices
London
210
210
10
Hercules Unit Trust unit purchase
1Retail
Various
95
95
5
19–33 Liverpool Street
Offices
London
22
22
1
Chester, Broughton development land
Retail North West
5
3
–
Teesside Leisure Park
Retail
North East
2
2
–
Total
334
332
16
1 Units purchased over the course of the period. £95m represents purchased GAV 2 BL share of net rent topped up for rent frees
45
Disposals
From 1 April 2015 Area Price (Gross) £m Price (BL Share) £m Annual Passing Rent £m1 Completed
Parkgate Shopping Park, Rotherham Retail Yorkshire 170 120 6
39 Victoria Street Offices London 139 139 5
Birstall Shopping Park, Leeds Retail Yorkshire 107 31 2
PREF – France & Portugal Retail Europe 67 43 4
Hatters Way, Luton & Hylton Riverside, Sunderland Retail Various 45 34 2
560 London Road, Camberley Retail South 38 38 2
Debenhams, Oxford Retail South 23 23 1
The Hempel Collection Residential London 20 20 –
Superstore disposals Retail Various 154 122 6
B&M, Daventry Retail Midlands 9 9 1
Bedford Street Residential London 4 4 –
Aldgate Place Residential London 1 1 –
Exchanged
Aldgate Place Residential London 32 16 –
The Hempel Collection Residential London 18 18 –
Total 827 618 29
1
46
Strong operational performance
Outperformance
in 2016
BL footfall performance vs Experian benchmark
+440
bps
UK Market (Experian Index) British Land
80 85 90 95 100 105 110 115
Mar-10 Sep-10 Mar-11 Sep-11 Mar-12 Sep-12 Mar-13 Sep-13 Mar-14 Sep-14 Mar-15 Sep-15 Mar-16
Continued ERV growth in Retail
Rental growth on
multi-let assets
Portfolio rental growth vs IPD
3.4
%
Source: IPD Index Mar-13 = 100 95.0 97.5 100.0 102.5 105.0 107.5 110.0Mar-13 Sep-13 Mar-14 Sep-14 Mar-15 Sep-15 Mar-16
48
BL property outperformance vs IPD – 5 years
100
400
200
120
280
140
0 50 100 150 200 250 300 350 400 450Retail Offices Total
5 years ended 31 March 2016
Outperformance bps pa
BL property outperformance vs IPD – 3 years
50
270
130
60
150
60
0 50 100 150 200 250 300Retail Offices Total
Outperformance bps pa
3 years ended 31 March 2016
50
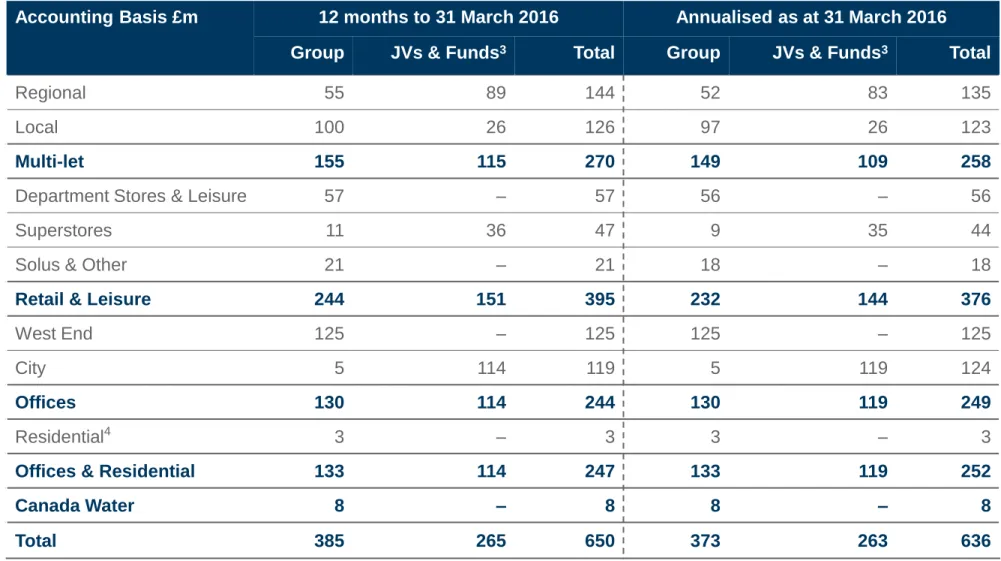
Gross rental income
1,2Accounting Basis £m 12 months to 31 March 2016 Annualised as at 31 March 2016 Group JVs & Funds3 Total Group JVs & Funds3 Total
Regional 55 89 144 52 83 135
Local 100 26 126 97 26 123
Multi-let 155 115 270 149 109 258
Department Stores & Leisure 57 – 57 56 – 56 Superstores 11 36 47 9 35 44 Solus & Other 21 – 21 18 – 18
Retail & Leisure 244 151 395 232 144 376
West End 125 – 125 125 – 125
City 5 114 119 5 119 124
Offices 130 114 244 130 119 249
Residential4 3 – 3 3 – 3
Offices & Residential 133 114 247 133 119 252
Canada Water 8 – 8 8 – 8
Total 385 265 650 373 263 636
Table shows UK total
1 Excluding developments under construction and assets held for development. 2
Gross rental income will differ from annualised rents due to accounting adjustments for fixed & minimum contracted rental uplifts and lease incentives
3 Group’s share of properties in joint ventures and funds including HUT at share 4 Stand-alone residential
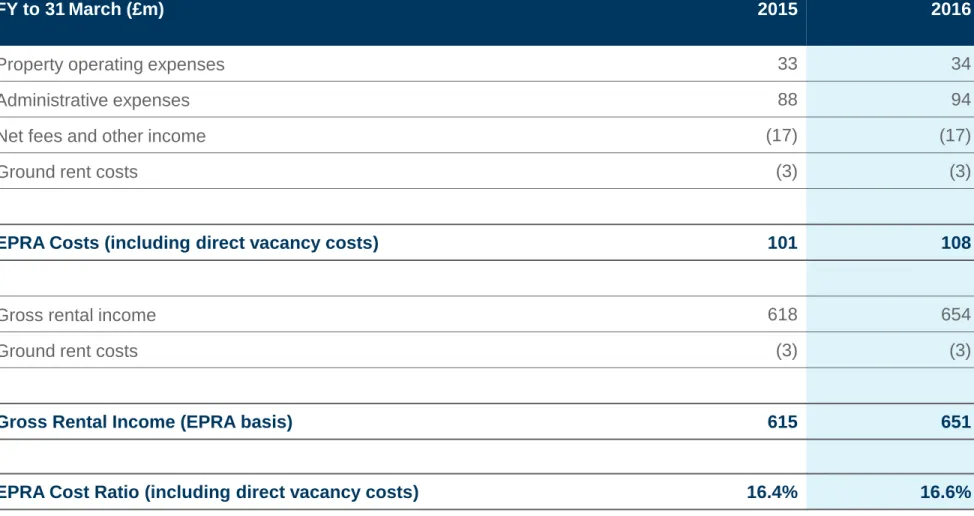
Operating costs metric
FY to 31March (£m) 2015 2016
Property operating expenses 33 34
Administrative expenses 88 94
Net fees and other income (17) (17)
Ground rent costs (3) (3)
EPRA Costs (including direct vacancy costs) 101 108
Gross rental income 618 654
Ground rent costs (3) (3)
Gross Rental Income (EPRA basis) 615 651
EPRA Cost Ratio (including direct vacancy costs) 16.4% 16.6%
Table shows figures on a proportionately consolidated basis which includes the Group's share of joint ventures and funds and excludes non-controlling interests in the Group's subsidiaries.
52
Administrative Expenses
FY to 31
March (£m)
2015
2016
Personnel Costs
49
50
Share Scheme Costs
13
10
Other Administrative Expenses
23
33
Total – British Land
185
93
Broadgate Estates
3
5
Total – Group
88
98
Capitalised Costs
–
(4)
Total Administrative Expenses
88
94
FY17 income statement guidance
–
Rental Income
–
Virtually fully let portfolio with contracted gross rent of £636m as at 31 March 2016.
–
Like-for-like growth, given portfolio nearly full, will be driven by rental growth and
full year impact of FY16 leasing.
–
Property outgoings likely to be similar to FY16 as a percentage of gross rents.
–
Administrative costs and fee income
–
Expected to be broadly in line with FY16 levels.
–
Financing
–
Weighted average interest rate now 3.3% on gross debt of £5.1bn.
–
Capitalised interest expected to be at a similar level to FY16.
–
2012 Convertible Bond
–
As in FY16, underlying EPS will be diluted for the 2012 convertible bond.
–
For earnings calculations, the interest payable on the 2012 convertible bond of £6m
will need to be added back and the number of shares increased by 58 million
.
–
Dividend
–
3% increase in 2017.
–
Other
54
Reconciliation of underlying profit before tax
FY to 31 March (£m)
2015
2016
IFRS Profit before tax attributable to shareholders of the Company
1,734
1,312
Net valuation movement
(1,473)
(861)
Profit on disposal of investment and trading properties
(32)
(63)
Deferred and current taxation of joint ventures & funds
(2)
1
Capital financing costs / (income)
47
(31)
Add non-controlling interests
39
5
Underlying Profit
313
363
Dilution adjustments
6
6
EPRA balance sheet (proportional consolidation)
£m
31 March 15
Group
JVs &
Funds
31 March 16
Total properties
13,677
9,787
4,861
14,648
Adjusted net debt
(4,918)
(3,357)
(1,408)
(4,765)
Other net liabilities
(124)
(101)
(108)
(209)
EPRA Net Assets (undiluted)
8,635
6,329
3,345
9,674
Dilution impact of 2012 convertible bond
400
400
–
400
EPRA Net Assets (diluted)
9,035
6,729
3,345
10,074
Loan to Value (LTV)
135%
25%
32%
Average interest rate
3.8%
2.6%
3.3%
Interest cover
2.6x
3.4x
3.0x
Average maturity of drawn debt (years)
8.7
7.2
8.1
56
Reconciliation of EPRA NAV & NNNAV
31 March 15
31 March 16
£m
pence
£m
pence
Balance Sheet (IFRS) Net Assets
8,565
840
9,619
935
Deferred tax arising on revaluation movements
13
5
Mark to market on effective cash flow hedges and
related debt adjustments
257
198
Adjust to fully diluted on exercise of share options
37
36
Adjust to dilute for 2012 convertible bond
400
400
Surplus on trading properties
96
93
Less non-controlling interests
(333)
(277)
EPRA NAV
9,035
829
10,074
919
Deferred tax arising on revaluation movements
(13)
(24)
Mark to market of debt and derivatives
(663)
(410)
At 31 March 2016 Group £m JVs & Funds £m Less non-controlling interest £m £m
Gross Debt (principal value) 3,552 1,665 (128) 5,089
IFRS adjustments:
Issue costs and premia (18) (4) 1 (21)
Fair value hedges 197 – – 197
Other Items 30 – – 30
IFRS gross debt 3,761 1,661 (127) 5,295
Market value of derivatives (30) 45 (3) 12
Cash (114) (239) 9 (344)
IFRS net debt 3,617 1,467 (121) 4,963
Adjustments:
Remove market value of derivatives (12)
Remove fair value hedges (159)
Other adjustments (27)
Adjusted net debt 4,765
58
Adjusted net debt – proportionally consolidated (£bn)
4.9 4.8 0.3 0.3 (0.6) (0.1) Mar 15 Net Debt
Acquisitions Development & Capex
Disposals Operating Cashflow after cash dividends
Mar 16 Net Debt
LTV
35%
LTV
32%
Debt maturity – group (£m)
Debenture & loan notes (Secured) Bank Term Loan (Secured) US Private Placements (Unsecured)
Convertible Bond (Unsecured) Bank RCF Drawn (Unsecured) Bank RCF Undrawn (Unsecured)
Year to March 0 200 400 600 800 1,000 2017 2018 2019 2020 2021 2022 2023 2024 2025 2026 2027 2028 2029 2030 2031 2032 2033 2034 2035 2036 2037
1 2022 pro-forma for 1 year extension of bank syndicated RCF, agreed post year end
60
Debt maturity – joint ventures and funds
1
(£m)
1 At British Land share (including share of HUT)
JVs – Securitisations Funds – Bank drawn Funds – Bank undrawn JVs – Bank drawn
0 200 400 600 800 1,000 2017 2018 2019 2020 2021 2022 - 2026 2027-2036 Year to March
Debt Financing – Diverse profile
Debentures & loan notes (Secured) Bank RCFs Drawn (Unsecured) US Private Placements (Unsecured)
Bank Term Loan (Secured) JVs Securitisations
JV & Funds Term Loans (Secured)2
1 Proportionally Consolidated
2 HUT’s debt shown at our share (£0.4 billion) within JV & Funds
Diverse Debt Profile
1(31 March 2016)
•
Over £1bn of debt financing activity
since 31 March 2015
•
WAIR reduced by 50 bps to 3.3% from
3.8%
•
£350m 0% convertible bonds due 2020
(issued June 2015)
-
Flexible settlement options
-
Competitive terms
-
Further diversifying sources of finance
•
£110m tender on 6.75% 2020 debentures
•
Reduced pricing and extended various
bank loans and facilities
Convertible Bonds (Unsecured)
£0.6bn £0.8bn £0.3bn £0.8bn £0.6bn £1.5bn £0.5bn
62
Number of shares
Number of shares (m)
31 Mar 15
31 Mar 16
IFRS Basic
Weighted Average
1,016
1,025
Underlying and IFRS Diluted
Weighted Average
1,022
1,089
1EPRA Diluted
1Weighted Average
1,080
1,089
Period End
1,090
1,096
Major property holdings
At 31 March 2016
(excl. developments under construction)
BL Share
%
Sq ft
000’s
Rent
£m pa
1Occupancy
Rate %
2Lease
Length yrs
31
Broadgate
50 4,724 226 99.3 7.8
2
Regent's Place
100 1,590 79 98.7 7.4
3
Paddington Central
100
806 33 99.8 7.8
4
Meadowhall Shopping Centre
50 1,500 80 98.3 6.9
5
Sainsbury's Superstores
450 2,526 56 100.0 14.0
6
The Leadenhall Building
50 603 37 97.8 11.6
7
Debenhams, Oxford Street
100 363 11 100.0 23.0
8
Teesside Shopping Park
100 569 15 99.1 5.7
9
Glasgow Fort Shopping Park
100 510 14 94.2 6.5
10 Drake's Circus Shopping Centre
100 570 16 98.4 5.2
1 Annualised EPRA contracted rent including 100% of Joint Ventures & Funds
2 Includes accommodation under offer or subject to asset management at 31 March 2016 3 Weighted average to first break
64
Top 20 occupiers & occupier split by industry
As at 31 March 2016 % of Contracted Rent
UBS AG1 5.7% Tesco plc 5.6% Debenhams 5.3% J Sainsbury plc 4.6% Kingfisher (B&Q) 2.6% HM Government 2.2% Next plc 2.1% Virgin Active 1.8% Facebook 1.7% Spirit Group 1.6% Alliance Boots 1.5% Wesfarmers 1.4% Visa Inc 1.4% Dixons Carphone 1.4%
Marks & Spencer plc 1.4%
Arcadia Group 1.3%
Dentsu Aegis 1.3%
Herbert Smith 1.2%
RBS 1.1%
TJX Cos Inc (TK Maxx) 1.0%
General Retail 18%
Fashion & Beauty
15%
Banks & Financial services2 16% Supermarket 12% Professional & Corporate 8% Food/Leisure 9% DIY 6% TMT 7%
Occupier Split by Industry (%)
Other 8%
1 Rent contracted on both 5 Broadgate and 1-3 Finsbury Avenue/100 Liverpool Street lease
whilst UBS move. 3.0% pro-forma for run off of UBS rent at 1-3 Finsbury Avenue/ 100 Liverpool Street.
Portfolio valuation by sector
At 31 March 2016 Group JVs & Funds1 Total1 Change %2
£m £m £m H1 H2 FY
Regional 1,052 1,792 2,844 2.8 0.2 3.0
Local 1,893 485 2,378 1.5 1.1 2.6
Multi-let 2,945 2,277 5,222 2.2 0.6 2.8
Department Stores & Leisure 1,004 1 1,005 3.4 2.5 6.0
Superstores 153 628 781 (1.7) (0.5) (2.1)
Solus & Other 333 – 333 (0.1) (0.4) (0.5)
Retail & Leisure3 4,435 2,906 7,341 1.8 0.7 2.4
West End 3,904 – 3,904 8.1 4.6 12.8
City 104 2,782 2,886 8.5 2.4 11.1
Offices 4,008 2,782 6,790 8.3 3.7 12.1
Residential4 173 61 234 6.7 (0.3) 5.7
Offices & Residential3 4,181 2,843 7,024 8.2 3.5 11.8
Canada Water 283 – 283 2.6 (0.9) 1.7
Total 8,899 5,749 14,648 4.7 2.0 6.7
Standing Investments 8,204 5,673 13,877 4.5 1.9 6.4
Developments 695 76 771 6.9 3.1 9.4
1 Group’s share of properties in joint ventures and funds including HUT at ownership share
2 Valuation movement during the period (after taking account of capital expenditure) of properties held at the balance sheet date, including developments
(classified by end use), purchases and sales ³ Including committed developments
66
Retail Portfolio Valuation
–
Previous Classification basis
At 31 March 2016 Valuation
1Change %
2ERV Growth %
3NEY Yield
Compression
£m
H1
H2
FY
H1
H2
FY
H1
H2
FY
Shopping parks
43,346
1.1
0.3
1.3
0.9
1.9
2.8
5
2
7
Shopping centres
2,205
3.8
0.9
4.7
2.0
1.9
3.9
14
5
18
Superstores
781
(1.6)
(0.5)
(2.1)
(0.9)
(0.3)
(1.3)
(5)
1
(6)
Department stores
606
2.9
3.0
6.0
–
0.3
0.3
12
13
25
Leisure
403
4.2
1.8
6.1
0.3
0.3
0.6
22
23
54
Retail & Leisure
57,341
1.8
0.7
2.4
0.9
1.5
2.4
8
5
13
1 Group’s share of properties in joint ventures and funds including HUT at share
2 Valuation movement during the period (after taking account of capital expenditure) of properties held at the balance sheet date,
including developments (classified by end use), purchases and sales
3 As calculated by IPD
4 Solus/Other assets under current Retail segmentation previously included in Shopping Parks 5 Including committed developments
Portfolio weighting
At 31 March 2015 % 2016 (current) % 2016 (current) £m 2016 (pro-forma1) % Regional 20.2 19.4 2,844 19.0 Local 16.8 16.3 2,378 15.9 Multi-let 37.0 35.7 5,222 34.9Department Stores & Leisure 7.1 6.9 1,005 6.7
Superstores 6.7 5.3 781 5.2
Solus & Other 2.8 2.3 333 2.2
Retail & Leisure 53.6 50.2 7,341 49.0
West End 23.9 26.6 3,904 28.0
City 18.8 19.7 2,886 19.3
Offices 42.7 46.3 6,790 47.3
Residential2 1.9 1.6 234 1.8
Offices & Residential 44.6 47.9 7,024 49.1
Canada Water 1.8 1.9 283 1.9
Total 100.0 100.0 14,648 100.0
1 Pro forma for developments under construction at estimated end value (as determined by the Group’s external valuers) and post period end transactions 2 Stand-alone residential
68
Portfolio net yields
1,2
At 31 March 2016 EPRA net initial yield % EPRA topped up net initial yield %3 Overall topped up net initial yield %4 Net equivalent yield % Net reversionary yield % Regional 4.3 4.4 4.5 4.8 4.8 Local 4.8 5.1 5.2 5.2 5.2 Multi-let 4.5 4.7 4.8 5.0 5.0
Department Stores & Leisure 4.7 4.8 6.4 5.1 4.0 Superstores 5.3 5.3 5.3 5.2 5.2 Solus & Other 5.6 5.6 5.6 5.1 4.7
Retail & Leisure 4.7 4.8 5.1 5.0 4.9
West End 3.5 3.9 4.0 4.4 4.6 City 3.2 4.4 4.5 4.4 5.3
Offices 3.4 4.2 4.2 4.4 4.9
Canada Water 2.8 2.8 2.8 3.2 3.4
Total 4.1 4.5 4.7 4.7 4.9
1 Including notional purchaser's costs
2 Excluding developments under construction, assets held for development and residential assets 3 Including rent contracted from expiry of rent-free periods and fixed uplifts not in lieu of rental growth 4 Including fixed/minimum uplifts (excluded from EPRA definition)
Portfolio net yields
1,2 –
Previous Classification basis
At 31 March 2016
EPRA net
initial
yield %
EPRA topped
up net initial
yield %
3Overall topped
up net initial
yield %
4Net
equivalent
yield %
Net
reversionary
yield %
Shopping parks
4.7 4.9 4.9
5.1 5.0
Shopping centres
4.5 4.6 4.7 4.9 4.9
Superstores
5.3 5.3
5.3
5.2 5.2
Department stores
3.9 3.9 5.6 4.2 3.5
Leisure
6.1 6.1 7.6 6.4 4.8
Retail & Leisure
4.7 4.8 5.1 5.0 4.9
1 Including notional purchaser's costs
2 Excluding developments under construction, assets held for development and residential assets 3 Including rent contracted from expiry of rent-free periods and fixed uplifts not in lieu of rental growth 4 Including fixed/minimum uplifts (excluded from EPRA definition)
70
Portfolio yield & ERV movements
1
At 31 March 2016 NEY3 ERV Growth %2 NEY Yield Compression3 bps
% H1 H2 FY H1 H2 FY
Regional 4.8 1.7 1.8 3.5 11 4 15 Local 5.2 1.0 2.2 3.3 7 2 9
Multi-let 5.0 1.4 2.0 3.4 9 3 12
Department Stores & Leisure 5.1 0.2 0.2 0.4 19 17 37
Superstores 5.2 (0.9) (0.3) (1.3) (5) 1 (6)
Solus & Other 5.1 0.1 0.0 0.1 1 1 2
Retail & Leisure 5.0 0.9 1.5 2.4 8 5 13
West End 4.4 4.1 5.6 9.9 24 3 28
City4 4.4 4.8 4.3 9.3 16 (4) 12
Offices 4.4 4.4 5.0 9.6 20 (0) 21
Canada Water 3.2 0.2 0.2 0.5 11 1 13
Total 4.7 2.3 3.0 5.3 13 3 17
1 Excluding developments under construction, assets held for development and residential assets 2 As calculated by IPD
3 Including notional purchaser’s costs
Lease length and occupancy
1
At 31 March 2016 Average Lease Length (yrs) Occupancy Rate (%)
To Expiry To Break Occupancy Occupancy (underlying)2
Regional 7.9 6.9 95.8 97.8 Local 8.7 7.5 98.9 99.6
Multi-let 8.3 7.2 97.3 98.6
Department Stores & Leisure 19.7 19.6 100.0 100.0 Superstores 14.2 13.8 100.0 100.0 Solus & Other 10.5 10.5 100.0 100.0
Retail & Leisure 10.6 9.8 98.0 99.0
West End 9.5 7.5 97.8 98.1 City 10.2 8.3 98.4 99.1
Offices 9.8 7.9 98.1 98.6
Canada Water 7.5 7.4 98.4 99.1
Total 10.2 9.0 98.0 98.8
1 Excluding developments under construction, assets held for development and residential assets 2 Including accommodation under offer or subject to asset management
72
Annualised rent & estimated rental value (ERV)
1
At 31 March 2016 Annualised Rents (Valuation Basis) £m2 ERV £m Average Rent (£psf) Group JVs & Funds Total Total Contracted3 ERV
Regional 54 84 138 155 32.8 35.9 Local 97 27 124 134 24.2 24.7
Multi-let 151 111 262 289 28.0 29.7
Department Stores & Leisure 51 – 51 44 15.3 13.1 Superstores 9 35 44 43 21.4 20.8 Solus & Other 18 – 18 16 18.8 16.0
Retail & Leisure 229 146 375 392 24.0 24.3
West End 125 – 125 165 51.5 60.6 City 5 94 99 162 50.0 60.3
Offices 130 94 224 327 51.0 60.4
Residential4 3 – 3 4
Offices & Residential 133 94 227 331
Canada Water 8 – 8 9 18.7 21.6
Total 370 240 610 732 30.1 32.6
1 Excluding developments under construction and assets held for development
2 Gross rents plus, where rent reviews are outstanding, any increases to ERV (as determined by the Group’s external valuers),
less any ground rents payable under head leases, excludes contracted rent subject to rent free and future uplift
3 Annualised rent, plus rent subject to rent free 4 Stand-alone residential
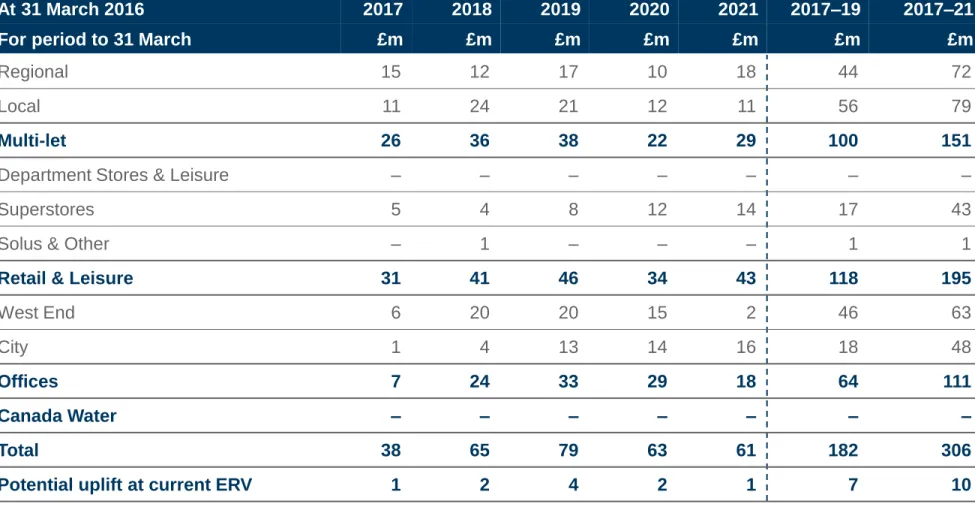
Rent subject to open market rent review
1
At 31 March 2016 2017 2018 2019 2020 2021 2017–19 2017–21 For period to 31 March £m £m £m £m £m £m £m
Regional 15 12 17 10 18 44 72
Local 11 24 21 12 11 56 79
Multi-let 26 36 38 22 29 100 151
Department Stores & Leisure – – – – – – –
Superstores 5 4 8 12 14 17 43
Solus & Other – 1 – – – 1 1
Retail & Leisure 31 41 46 34 43 118 195
West End 6 20 20 15 2 46 63
City 1 4 13 14 16 18 48
Offices 7 24 33 29 18 64 111
Canada Water – – – – – – –
Total 38 65 79 63 61 182 306
Potential uplift at current ERV 1 2 4 2 1 7 10
Table with previous classification provided on Company website
74
Rent subject to lease break or expiry
1
At 31 March 2016 2017 2018 2019 2020 2021 2017–19 2017–21 For period to 31 March £m £m £m £m £m £m £m
Regional 13 12 9 13 9 34 56 Local 9 6 8 11 9 23 43
Multi-let 22 18 17 24 18 57 99
Department Stores & Leisure – 1 – – – 1 1 Superstores – – – – – – – Solus & Other 1 – – – 6 1 7
Retail & Leisure 23 19 17 24 24 59 107
West End 10 8 10 4 19 28 51 City 17 3 17 14 8 37 59 Offices2 27 11 27 18 27 65 110 Canada Water 1 – 1 – 1 2 3 Total 51 30 45 42 52 126 220 % of contracted rent 7.3% 4.4% 6.5% 6.1% 7.6% 18.2% 31.9%
Potential uplift at current ERV 3 4 3 11 4 1 18 23
1 Excluding developments under construction, assets held for development and residential assets 2 Based on office space only
ERV resetting to market
At 31 March 2016
2017
2018
2019
2020
2021 2017–19 2017–21
For period to 31 March
£m
£m
£m
£m
£m
£m
£m
ERV expiring – existing portfolio
138
33
56
46
54
127
227
Developments – Under Construction
6
10
–
–
–
16
16
Total Rent Resetting to Market
excluding Near Term Developments
44
43
56
46
54
143
243
Near term developments – Expiries
(28)
–
–
–
–
(28)
(28)
Near term developments – Completions
2
2
20
68
–
24
92
Total Rent Resetting to Market
including Near Term Developments
46
45
76
114
54
167
335
ERV of current vacancies
2,314
14
Vacant & Income Expiring
181
349
1 Rent is based on ERV, reflecting current valuation, expires to first break
2 Including space under offer of £4m and space subject to asset management of £1m 3 Including £2m of vacant space at recently completed developments
76
Contracted rental increases (cash flow basis)
At 31 March 2016
2017
2018
2019
2020
2021 2017–19 2017–21
For period to 31 March
£m
£m
£m
£m
£m
£m
£m
Expiry of rent free periods
49
10
3
–
–
62
62
Fixed uplifts (EPRA basis)
–
1
1
–
–
2
2
Fixed & minimum uplifts in lieu
of rental growth
5
1
2
1
1
8
10
77
Multi-let assets
Regional – Breadth and depth of Retail and
Leisure, attracting visitors from a wide catchment
Local – Convenience and accessibility, with retail, social and civic space fitting into
the daily life of local communities
Bath Southgate Shopping Centre Basildon Mayflower Shopping Park Londonderry Lisnagelvin Shopping Centre
Chester Broughton Shopping Park * Bath Weston Lock Shopping Park Mansfield St. Peter’s Shopping Park
Edinburgh Fort Kinnaird Shopping Park * Barrow-In-Furness Cornerhouse Shopping Park Milton Keynes Kingston Centre Shopping Park
Glasgow Fort Shopping Park * Barrow-In-Furness Hindpool Shopping Park Newmarket Studlands Shopping Park
Kingston-upon-Hull, St. Stephens Shopping Centre Bradford Forster Shopping Park Newport Harlech Shopping Park
Kingston Eden Walk Shopping Centre Bury Woodfields Shopping Park Oldham Elk Mill Shopping Park
Nottingham Giltbrook Shopping Park Cheltenham Gallagher Shopping Park * Orpington Nugent Shopping Park
Peterborough Serpentine Green Shopping Centre Colchester Tollgate Shopping Park Oxford Botley Road Shopping Park
Plymouth Drake Circus Shopping Centre Dartford Prospect Place Shopping Park * Preston Deepdale Shopping Park *
Sheffield Meadowhall Shopping Centre Denton Crown Point Shopping Park Stafford Queens Shopping Park *
Speke New Mersey Shopping Park * Doncaster Wheatley Shopping Park Swindon Orbital Shopping Park
Stockton on Tees Shopping Park Dumfries Cuckoo Bridge Shopping Park Wakefield Westgate Shopping Park
Ealing Broadway Shopping Centre Walsall Crown Wharf Shopping Park *
Fareham Whiteley Shopping Centre Woking Lion Shopping Park
Hereford Old Market Shopping Centre York Clifton Moor Shopping Park
Inverness Shopping Park * Leeds Westside Shopping Park Leicester Beaumont Shopping Centre Lincoln Valentine Shopping Park * Llandudno Mostyn Champneys Shopping Park *
78
Superstores
Stand-alone Superstores1 In Multi-let assets2 Total Exposure1,2,3
Store Size ‘000 SQ FT Number of stores Valuation (BL share) £m Capital Value psf WALL to FB yrs Number of stores Valuation (BL share) £m Capital Value psf WALL to FB yrs Number of stores Valuation (BL share) £m Capital Value psf WALL to FB yrs >100 8 177 351 12.4 5 357 538 13.0 13 534 457 12.8 75–100 13 270 467 17.9 2 55 415 12.8 15 325 457 17.0 50–75 16 256 404 12.6 1 12 196 11.1 17 268 385 12.3 25–50 8 52 226 8.3 3 32 457 14.6 11 84 281 10.4 0–25 2 8 177 9.1 17 80 436 11.1 19 88 387 10.9 March 2016 47 763 383 13.9 28 536 482 12.7 75 1,299 419 13.5 March 2015 57 924 395 14.5 29 529 491 13.9 86 1,453 426 14.4
Geographical Spread Gross Rent (BL Share) Lease Structure
London & South 57% Tesco £37m RPI and Fixed 8%
Rest of UK 43% Sainsburys £30m OMRR 92%
Other £5m
1 Excludes £8m non-foodstore occupiers in superstore led assets, and £10m Sainsburys Newquay, sold post period end 2 Excludes non food-format stores e.g. Asda Living
Under Construction/completed in period developments
At 31 March 2016 Sector BL Share Sq ft PC Calendar Year Current Value Cost to CompleteERV Let & Under Offer Resi End Value Resi Sales Exchanged & Completed % '000 £m £m1 £m2 £m £m £m
5 Broadgate Offices 50 710 Completed 469 8 19.2 19.2 – –
Yalding House Offices 100 29 Completed 37 1 1.9 – – –
Whiteley Leisure, Fareham Retail 50 57 Completed 12 1 0.6 0.6 – –
Glasgow Fort, M&S & Retail
Terrace Retail 75 112 Completed 35 3 2.0 1.7 – –
Total Completed in Period 908 553 13 23.7 21.5 – –
4 Kingdom Street Offices 100 147 Q2 2017 81 64 9.5 – – –
Clarges Mayfair Mixed Use 100 192 Q4 2017 404 107 6.2 – 456 259
Glasgow Fort (MSCP &
Additional retail/leisure units) Retail 75 12 Q3 2016 2 5 0.4 0.2 – –
The Hempel Phase 1 Residential 100 25 Q2 2016 26 2 – – 50 36
The Hempel Phase 2 Residential 100 32 Q3 2016 48 12 – – 72 8
Aldgate Place, Phase 1 Residential 50 221 Q2 2016 44 14 – – 79 55
Total Under Construction 629 605 204 16.1 0.2 657 358
Retail Capital Expenditure3 107
Data includes Group's share of properties in Joint Ventures & Funds (except area which is shown at 100%)
1 From 1 April 2016
2 Estimated headline rental value net of rent payable under head leases (excluding tenant incentives) 3 Capex committed and underway within our investment portfolio relating to leasing and asset management
80
Near term and medium term developments
At 31 March 2016 Sector BL Share % Sq ft '000 Start On Site Total Cost1 £m Status
Near term Pipeline
100 Liverpool Street Offices 50 520 2017 279 Consented
1 Triton Square 2 Offices 100 217 2017 370 Pre-submission
1 Finsbury Avenue Offices 50 303 2017 150 Consented
5 Kingdom Street 3 Offices 100 240 2017 228 Consented
Blossom Street, Shoreditch Mixed Use 100 340 2017 256 Consented
Plymouth Leisure Retail 100 102 2016 41 Consented
New Mersey Shopping Park, Speke – Leisure Retail 66 66 2016 20 Consented
Crawley Homewares Park Retail 100 52 2016 26 Consented
Aldgate Place, Phase 2 Residential 50 145 2016 59 Consented
54 The Broadway, Ealing Residential 100 34 2016 21 Consented
Total Near Term 2,019 1,450
Retail Capital Expenditure 4 90
Medium term Pipeline
2–3 Finsbury Avenue Offices 50 550 Submitted
Eden Walk Shopping Centre, Kingston Mixed Use 50 562 Submitted
Canada Water Masterplan 5 Mixed Use 100 5,500 Pre-submission
Forster Retail Park, Bradford, Phase 3 Retail 100 63 Consented
Meadowhall Leisure Retail 50 330 Pre-submission
Glasgow Fort – Retail Extension Retail 75 60 Consented
Putney High Street Residential 100 110 Consented
Total Medium Term 7,175
80
1 Total cost including site value. Excludes notional interest as interest is capitalised individually on each development at our capitalisation rate 2 Existing net areas, scheme in early design stages
3 210,000 sq ft of which is consented
4 Forecast capital commitments within our investment portfolio over the next 2 years relating to leasing & asset enhancement 5 Assumed net area based on gross area of up to 7m sq ft