MATHEMATICAL MODELING AND AVAILABILITY ANALYSIS OF A
CRYSTALLIZATION SYSTEM USING MARKOV PROCESS
Shri Ram*
Dr. Rajiv Khanduja**
ABSTRACT
This paper deals with the mathematical modeling and availability analysis of crystallization
system of a sugar plant. The crystallization system of sugar plant consists of three subsystems
with three possible states: full working, reduced capacity working and failure. Failure and
Repair rates for all the subsystems are assumed to be constant. Formulation of the problem is
carried out using Markov Birth-Death process using probabilistic approach and a transition
diagram represents the operational behavior of the system. Interrelationship among the full
working and reduced working states has been developed. A probabilistic model has been
developed, considering some assumptions. Data in feasible range has been selected from a
survey of sugar plant and the effect of each subsystem on the system availability is tabulated in
the form of availability matrices, which provides various availability levels for different
combinations of failure and repair rates of all subsystems.
Keywords: Availability evaluation, probabilistic approach, transition diagram, availability
matrices.
*P.G. Student, Department of Mechanical Engineering, Yamuna Institute of Engineering & Technololgy (YIET), Gadholi, Yamuna-Nagar, Haryana, India.
I. INTRODUCTION
The sugar industry is becoming quite complex with large capital investment on process automation to enhance the reliability of system. Invariably, the proper maintenance of such systems and the frequency of maintenance are some of the issues that are gaining importance in industry. The production suffers due to failure of any intermediate system even for small interval of time. The cause of failure may be due to poor design, system complexity, and poor maintenance, lack of communication and coordination, defective planning, lack of experience. Thus, to run a process plant highly experienced maintenance personnel are required. The failed subsystem can however be inducted back into service after repairs/replacements. The rate of failure of the subsystems in the particular system depends upon the operating conditions and repair policies used. A probabilistic analysis of the system under given operative conditions is helpful in forecasting the equipment behavior which further helps in design to achieve minimum failure in the system i.e. to optimize the system working. A sugar plant is a complex system comprising of various systems: feeding, crushing, refining, evaporating, sulphonation, crystallization etc. These systems are connected in complex configuration. One of the most important functionaries of a sugar plant is crystallization system. The optimization of each system in relation to one another is imperative to make the plant profitable for operation. Effectiveness of sugar plant is mainly influenced by the availability of the plant, and its capability to perform as expected. The present paper provides a probabilistic model to achieve the maximum availability.
II. LITERATURE REVIEW
random. Resulting effects vary from minor inconvenience to loss of service time and sometimes to loss of material, equipments and even life.
III. SYSTEM DECRIPTION
Crystallization unit consists of three subsystems in series configuration with the following description:
Subsystem Ai (i = 1 to 3): It consists of three crystallizer units connected in parallel. The failure of any one reduces the capacity of the system and, hence, loss in production. Complete failure occurs when more than one unit fail at a time.
Subsystem Bj (j = 1 to 5): It consists of five centrifuge units connected in parallel. Complete failure occurs when more than two units fail at a time.
Subsystem Ck (k = 1 to 3): It consists of three sugar grader units connected in series. The failure of any one causes the complete failure of the system.
IV. ASSUMPTIONS
The assumptions used in the probabilistic model are as follows:
1. Failure/repair rates are constant over time and statistically independent.
2. A repaired unit is as good as new and performance wise for a specified duration. 3. Sufficient repair facilities are provided.
4. Standby units (if any) are of the same nature and capacity as the active units. 5. System failure/repair follows exponential distribution.
6. System may work at a reduced capacity/efficiency. 7. There is no simultaneous failure among the system.
V. NOTATIONS
The following notations are addressed for the purpose of mathematical analysis of the system: A¡ , Bj ,Ck : represent good working states of respective crystallizer, centrifuges and sugar grading units
a,b,c : represent failed states of respective crystallizer, centrifuges and sugar grading units
Φ4, Φ5, Φ6 : respective mean constant failure rates of A¡ , Bj ,Ck
λ4, λ5 , λ6 : respective mean constant repair rates of A¡ , Bj ,Ck d/dt : represents derivative w.r.t ‘t’
This system consists of 17 states as:
State 0- Full capacity working with no standby State 1to5- Reduced capacity working
States 6 to 16- System in failed state due to complete failure of one or other unit of the system
VI. MATHEMATICAL MODELING
Simple probabilistic approach gives the following differential equations, associated with the transition diagram of crystallization system
P0 (t) (d/dt+Φ4+ Φ5+ Φ6) =P1 (t) λ4+P2 (t) λ5+P14 (t) λ6
…...1
P1 (t) (d/dt+ λ4+ Φ4+ Φ5+ Φ6) =P0 (t) Φ4+P12 (t) λ4+P3 (t) λ5+P13 (t) λ6……….2
P2 (t) (d/dt+ λ5 +Φ4+ Φ5+ Φ6) =P0 (t) Φ5+P3 (t) λ4+P4 (t) λ5+P15 (t) λ6……….…...3
P3 (t) (d/dt+ λ4+ λ5+Φ4+ Φ5+ Φ6) =P2 (t) Φ4+P1 (t) Φ5+P10 (t) λ4+P5 (t) λ5+P11 (t) λ6…..4
P4 (t) (d/dt+ λ5+Φ4+ Φ5+ Φ6) =P2 (t) Φ5+P5 (t) λ4+P6 (t) λ5+P16 (t) λ6………5
P5 (t) (d/dt+ λ4+ λ5+Φ4+ Φ5+ Φ6) =P4 (t) Φ4+P3 (t) Φ5+P9 (t) λ4+P7 (t) λ5+P8 (t) λ6…...6
P6 (t) (d/dt+ λ5) = P4 (t) Φ5………...7
P7 (t) (d/dt+ λ5) = P5 (t) Φ5………..8
P8 (t) (d/dt+ λ6) = P5 (t) Φ6………..9
P9 (t) (d/dt+ λ4) = P5 (t) Φ4 ………10
P10 (t) (d/dt+ λ4) = P3 (t) Φ4 ………..11
P11 (t) (d/dt+ λ6) = P3 (t) Φ6………...12
P12 (t) (d/dt+ λ4) = P1 (t) Φ4 ………..13
P13 (t) (d/dt+ λ6) = P1 (t) Φ6 ………..14
P14 (t) (d/dt+ λ6) = P0 (t) Φ6 ………..15
P15 (t) (d/dt+ λ6) = P2 (t) Φ6 ………..16
P16 (t) (d/dt+ λ6) = P4 (t) Φ6 ………..17
VII. STEADY STATE ANALYSIS
The steady state behavior of the system can be analyzed by setting t →∞ and d/dt→ 0; The
limiting probabilities from equations (1) – (17) and Solving these equations recursively, we get: P0 = (P1 λ4+ P2 λ5+ P14 λ6) / (Φ4+ Φ5+
Φ6)
P1= P0 X3P2= P0 X4 P3= Φ5 X 3 P0 / λ5 P4= P0 X5 P0
P5= X3 P0 (Φ5 / λ5) ^3 P6 = P0 X5 Φ5 / λ5
P7 = P0 X3(Φ5 / λ5) ^2
P8= P0 Φ6 X3 (Φ5) ^2 / λ6 (λ5) ^2 P9 = P0 Φ4 X3 (Φ5) ^2/ (λ4 (λ5) ^2) P10 = (P0 X3 Φ4 Φ5) / λ4 λ5
P11= P0 Φ4 X3 / λ4
International Journal of Research in Engineering & Applied Sciences 33 http://www.euroasiapub.org
P14= P0 Φ6 / λ6 P15 = P0 Φ6 X4 / λ6
P16= P0 Φ6 X5 / λ6
Let the values are to be as:
X1= Φ4+ Φ5- [(Φ5 λ5)/ (λ5+Φ4)] X2= λ4 + [(λ4 λ5) / (λ5+Φ4)] X3= λ5+ [(λ4 λ5)/ (Φ5+ λ4)]
X4= (Φ4+ Φ5- λ4 X3) / λ5 X5= λ5 (Φ5/ λ5) ^2 + Φ5 X4
The probability of full capacity working P0 is determined by using the normalizing condition
۾ܑ ൌ
ୀ
P0 [1 + X3 + X4 + ( Φ5 / λ5) X3 + X5 + ( Φ5 / λ5)^3 X3 + ( Φ5/ λ5) X5 + ( Φ5 / λ5)^2 X3+ (
Φ5 / λ5)^2 X3 ( Φ6 / λ6) + ( Φ5 / λ5)^2 X3 ( Φ4 / λ4) + ( Φ5 / λ5) X3 ( Φ4/ λ4) + ( Φ4/ λ4) X3 + ( Φ6 / λ6) (Φ5 / λ5) X3 + ( Φ6 / λ6) X3 + ( Φ6 / λ6) + ( Φ6 / λ6) X4 + ( Φ6 / λ6) X5] =1
P0 = 1 / [1 + X3 + X4 + ( Φ5 / λ5) X3 + X5 + ( Φ5 / λ5)^3 X3 + ( Φ5/ λ5) X5 + ( Φ5 / λ5)^2 X3+ ( Φ5 / λ5)^2 X3 ( Φ6 / λ6) + ( Φ5 / λ5)^2 X3 ( Φ4 / λ4) + ( Φ5 / λ5) X3 ( Φ4/ λ4) + (
Φ4/ λ4) X3 + ( Φ6 / λ6) (Φ5 / λ5) X3 + ( Φ6 / λ6) X3 + ( Φ6 / λ6) + ( Φ6 / λ6) X4 + ( Φ6 /
λ6) X5]
AV= [1+( Φ4 +Φ5- λ4 X3) / λ5 + ( Φ5/ λ5)^2 λ5 + Φ5 X4 + X3 (1+( Φ5/ λ5) + ( Φ5/ λ5)^2)] / [1 + X3 + X4 + ( Φ5 / λ5) X3 + X5 + ( Φ5 / λ5)^3 X3 + ( Φ5/ λ5) X5 + ( Φ5 / λ5)^2 X3+ ( Φ5 /
λ5)^2 X3 ( Φ6 / λ6) + ( Φ5 / λ5)^2 X3 ( Φ4 / λ4) + ( Φ5 / λ5) X3 ( Φ4/ λ4) + ( Φ4/ λ4) X3 + ( Φ6 / λ6) (Φ5 / λ5) X3 + ( Φ6 / λ6) X3 + ( Φ6 / λ6) + ( Φ6 / λ6) X4 + ( Φ6 / λ6) X5]
AV=P0 (1+X3+X4+X3B5+X5+X3B5³)
VIII. PERFORMANCE ANALYSIS
Table 1 Availability matrices for ‘crystallizer’ subsystem of crystallization system
AV
λ4
Φ4
0.010 0.015 0.020 0.025 0.030
International Journal of Research in Engineering & Applied Sciences 34 Constant values are as: Φ5=0.06, λ5=0.10, Φ6=0.02, λ6=0.10
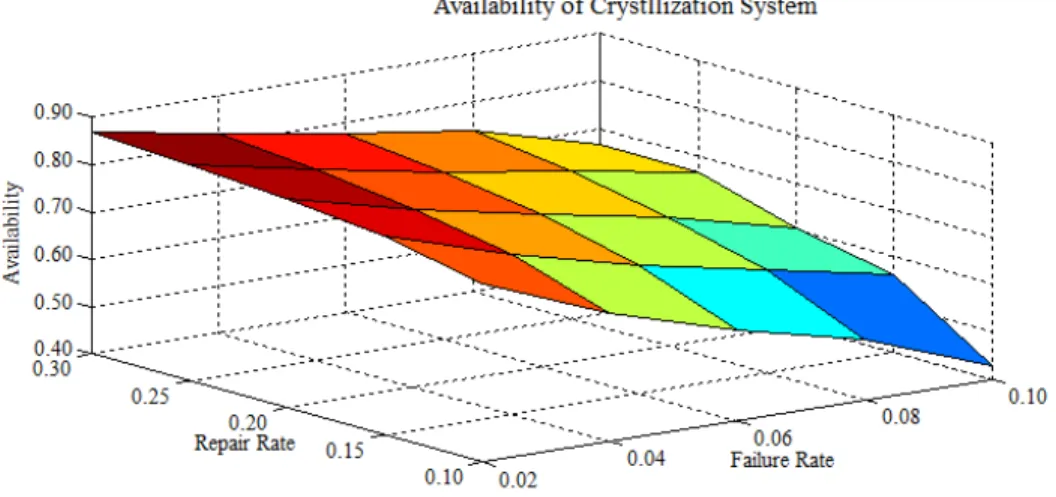
Figure1.Effect of failure and repair rate of ‘crystallizer’ subsystem on system availability
Table 2 Availability matrices for ‘centrifuge’ subsystem of crystallization system
AV
Constant values are as: Φ4=0.006, λ4=0.02, Φ6=0.02, λ6=0.10
0.008 .747414 .762642 .770427 .775126 .778252 0.010 .337900 .452413 .483281 .515731 .540467
λ5
0.10 0.15 0.20 0.25 0.30
0.06 .777588 .780605 .778724 .775222 .771193
0.08 .756784 .767281 .769577 .7687 .766448
0.10 .73303 .75116 .757975 .760031 .759805
0.12 .70783 .733138 .744528 .749675 .751641
International Journal of Research in Engineering & Applied Sciences 35 http://www.euroasiapub.org
Figure2.Effect of failure and repair rate of ‘centrifuge’ subsystem on system availability
Table 3 Availability matrices for ‘sugar grading’ subsystem of crystallization system
AV
Constant values are as: Φ4=0.006, λ4=0.02, Φ5=0.06, λ5=0.10
Figure3.Effect of failure and repair rate of ‘sugar grading’ subsystem on system availability
IX. RESULTS AND DISCUSSION
Table 1 and figure 1 illustrates the variation of system availability with change in failure rate and repair rate of crystallizer subsystem. As failure rate of crystallizer increases from 0.002 (once in 500 hrs) to 0.010(once in 100 hrs), the system availability decreases drastically by 45%. Similarly as repair rate of washer increases from 0.010(once in 100 hrs) to 0.030(once in 33.33hrs), the system availability increases appreciably by 7%. Table 2 and figure 2 illustrates the variation of system availability with change in failure rate and repair rate of centrifuge subsystem. As failure rate of centrifuge increases from 0.06 (once in 16.6 hrs) to 0.14(once in 7.14 hrs), the system availability decreases by 38.2%. Similarly as repair rate of centrifuge
λ6 Φ6
0.10 0.15 0.20 0.25 0.30
0.02 .777588 .820518 .843811 .858433 .868466 0.04 .672094 .738926 .777588 .802789 .820518
0.06 .591804 .672094 .721002 .75392 .777588
International Journal of Research in Engineering & Applied Sciences 36 increases from 0.10(once in 10 hrs) to 0.30(once in 3.33hrs), the system availability increases by 6%. Table 3 and figure 3 reveals the variation of system availability with change in failure rate and repair rate of sugar grading subsystem. As failure rate of sugar grading increases from 0.02 (once in 50 hrs) to 0.10(once in 10 hrs), the system availability decreases by 66%. Similarly as repair rate of sugar grading increases from 0.10(once in 10 hrs) to 0.30(once in 3.33hrs), the system availability increases appreciably by 9.1%.
X. CONCLUSIONS
Probabilistic models for various subsystems of a sugar plant have been developed and analyzed in real environment. The steady state availability expressions have been derived. The inter-relationships among various working units in the operating environment have been developed. These indicate the critical juncture of profitable operation. Decision matrices have been developed which help in deciding maintenance strategies and performance level. The effect of each unit behavior on the system performance has also been analyzed through decision matrices and availability plots. Desired level of performance has been established and the practical values of states of nature and courses of action have been determined.
REFERENCES
[1] Gupta,S., and Tewari,P.C. “The development of a performance model of power generation system of a thermal plant for performance evaluation using Markov technique and probabilistic approach ”JIEM,Issn-2013-0953,PN-387-406
[2] Shankuntla, S. , Lal, V.S. and Bhatia, S. “Availability analysis of a system can benefit the industry in terms of higher productivity and low maintenance cost” (2011)
[3] Khanduja, R, Tewari, P.C. and Kumar, D., “Availability analysis of bleaching system in a paper plant”. Udyog Pragti, The journal for practicing managers, vol. 32, pp 24-29, 2008.
[4] Khanduja, R., Tewari,P.C. and Chauhan, R.S., (2009), Performance analysis of screening unit in a paper using genetic algorithm.Tewari, P.C, Khanduja, R, and Gupta, M., “Performance enhancement for crystallization unit of a sugar plant using genetic algorithm”, Journal of Industrial Engineering , (2012) ,8:1
International Journal of Research in Engineering & Applied Sciences 37 http://www.euroasiapub.org
[6] Garg, H., Sharma, S.P. and Rani, M. “The starting point of reliability theory is that life time of systems or components cannot be predicted reliably because failures are random”.International Journal of Math and Mechanical,8(4),(2012),PN-86-96
[7] Srinath, L.S., “Reliability Engineering”, 3rd edition, East-West Press Pvt. Ltd., New Delhi, (1994).
[8] Blishke, W.R. and Murthy, D.N.P., Case studies in reliability and maintenance, wiley, USA, (2003).
[9] Khanduja, R., Tewari, P.C. and Kumar, D.(2009), Steady state behavior and maintenance planning of the bleaching system in a paper plant. J.Ind. Eng. Int., 7 (12), 39-44, Winter 2011, ISSN: 17355702.
[10] Rafael, P.O. and Delia, M.C.,(2004), A multiple system governed by a quasi-birth –and-death process. Journal of reliability engineering & system safety, 84 (2), 187-196.