Probability Matrix Decomposition Based Collaborative Filtering
Recommendation Algorithm
Yili Tan and Huijuan Zhao
Department of Statistics, College of Science, North China University of Science and Technology, Hebei, 063210, China E-mail: [email protected]
Yourong Wang
Department of Basic, Tangshan College, Hebei, 063000, China Min Qiu
Public Mathematics Department, Hubei University of Automotive Technology, Hubei, 442002, China
Technical Paper
Keywords: probability matrix decomposition, collaborative filtering, recommendation algorithm
Received: April 8, 2018
With the development of the society, the increased amount of information has extensively appeared on the Internet. It includes almost all the content we need. But information overload makes people unable to correctly find the information they need. Collaborative filtering recommendation algorithm can recommend items for users according to their demands. But traditional recommendation algorithm which has defects such as data sparsity needs to be improved. In this study, the collaborative filtering recommendation algorithm was analyzed, an improved collaborative filtering recommendation algorithm based on the probability matrix decomposition was put forward, and the feasibility of the algorithm was verified. Moreover the traditional algorithms including user based collaborative filtering algorithm, item based collaborative filtering algorithm, singular value decomposition based collaborative filtering algorithm and basic matrix based collaborative filtering algorithm were tested. The test results demonstrated that the proposed algorithm had a higher accuracy compared to the traditional algorithms, and its mean absolute error and root-mean-square error were significantly smaller than those of the traditional algorithms. Therefore it can be applied in the daily life.
Povzetek: V sestavku je predstavljena dekompozicija verjetnostne matrike s priporočilnim algoritmom na osnovi skupinskega filtriranja.
1
Introduction
He increased amount of information which appeared due to the development of Internet technology increases the difficulty of finding the target information. Therefore, many recommendation algorithms were proposed. Such recommendation algorithms can filter information according to the personal preference; hence they have been universally applied in fields such as web browsing, film recommendation and e-commerce [1]. Li [2] analyzed the sales records in the current tea leaves sales system by combining Hadoop distributed system with the traditional collaborative filtering algorithm to obtain the recommendation rules which could satisfy the preference of customer and help users find the tea leaves they needed. Yu et al. [3] proposed the weighed cloud model attributes based service cluster algorithm and calculated the user score similarity using the weighed Pearson correlation coefficient method of service cluster algorithm and the user service selection index weight. They found that the algorithm could accurately calculate service recommendation credibility, satisfying the demands of users on service credibility, and enhance the success rate of the user service selection. The collaborative filtering algorithm has high degree of individualization and
automation, but it exhibits a few problems such as sparsity and system extensibility. Therefore, in this study a probability matrix decomposition based collaborative filtering algorithm was put forward to correct up the defects of the traditional collaborative filtering algorithm and performed simulation experiments. The experimental results suggested that the mean absolute error (MAE), the root-mean-square error (RMSE) and the accuracy of the algorithm could reach the expected levels. This work provides a reference for the application of probability matrix decomposition based collaborative filtering recommendation algorithm in the searching of Internet information.
2
Collaborative filtering
recommendation algorithm
2.1.1
Collaborative filtering algorithm based
on users
User based collaborative filtering algorithm focuses on users. It recommends using user-item score matrix. It firstly searches for users which are similar to the target users and then recommends the selection of the searched users to the target users. The algorithm has two functions, i.e. one for calculating the similarity between adjacent users to establish matrix and one for recommending the target users using algorithm evaluation method.
2.1.2
Collaborative filtering algorithm based
on items
Item based collaborative filtering algorithm can provide recommendations to users based on evaluation data after establishing user-item evaluation data model. In details, it calculates the similarity between different items to determine the preference of target users and then recommends similar items to target users. The algorithm has functions for calculating the similarity between items, establishing similarity matrix and recommending target users by scoring similar items using algorithm evaluation method.
2.2
Collaborative recommendation
algorithm based on probability matrix
decomposition
The probability matrix decomposition can reflect the information of users and items to low-dimensional characteristic space in the aspect of probability and then analyze the concerns of uses about items using the linear combination of low-dimensional vectors [4].
Item score matrix could be expressed as
i j
F
; a matrixM
a i whose mean value was 0 and variance was2
M
and a random number matrixN
a j whose meanvalue and variance were 0 and 2 N
respectively wereproduced by MATLAB [5], in which a refers to the dimension of decomposition,
M
a i refers toa-dimensional characteristic square matrix of users, and a j
N
refers to the a-dimensional characteristic square matrix of item. Vector Mm and
N
n were the corresponding potential characteristic vectors. In general,T
i j a i a j
F
M
N
. The matrix T
a i a j i j
M
N
F
was obtained through the learning of machine training.
Suppose the mean value of the error between actual score
F
mn and predicted scoreF
mn
as 0 and the variable
of
F
mn andF
mn as Gaussian distribution of 2 F
, thenthe probability distribution is
2
(
mn mT n|0,
F)
q F
M N
.2
( | T , )
mn m n F
q F M N was obtained through translation. Then the condition of the score matrix F was:
2 2 1 1
( |
, ,
)
(
|
,
)
j i TF mn m n F mn
m n
q F M N
K F M N
I
, (1)
Where
I
mn stands for indicator function, Imn1means user m has scored item n, and Imn0 means user m
has not scored item n.
As M and N could not include each other, the mean value of M and N was 0, and
2 M
and 2 N
had Gaussiandistribution, then
2 2
1
(
|
)
(
|0,
)
i
M m M
m
Q M
K M
I
, (2)
2 2
1
( |
)
(
|0,
)
i
N n N
n
Q N
K N
I
, (3)
Where Q stands for probability.
The joint probability distribution of M and N can be obtained from equation (1), (2) and (3).
2 2 2
2 2 2
1 1 1 1
( , | , , , )
( | , ) ( |0, ) ( |0, )
F M N
j j
i i
T
mn m F mn m M n N
m n m n
q M N F
K F M N I K M I K N I
(4)The logarithm of the probability distribution of M and N was calculated:
2 2 2
2
2 2 2
1 1 1 1
ln ( , | , , , )
1 1 1
( )
2 2 2
F M N
j j
i i
T T T
mn mn m n m n n n
m n m n
F M N
q M N F
I F M N M N u N
. (5)
The maximum solution of equation (5) was replaced with the minimum solution of error function containing normalization parameters [6]:
2 2
2 min
1 1 1 1
1
( ) ( )
2 2 2
j j
i i
T
mn mn m n m n
m n m n
M N
L I F M N M N
, (6) Where 2 2 F M M and 2 2 F N N . As M2 2N, then target
function was:
2 2 2
min
1 1 1 1
1 ( ) ( ) 2 2 j j i i T
mn mn m n m n
m n m n
L I F M N M N
(7) The relationship between regularization parameter
and2 2 2
, ,
F M N
can be obtained from the equation (7).
The algorithm calculated function using stochastic gradient descent method [7]. It could obtain the decline direction of numerical values using derivatives and then calculate variables constantly on this direction until the minimal point was obtained.
The solution of the point suggested that the updating formulas of Mm,Nn were transformed to the following
formulas in each iteration: T
mn m n
l F
M N
, (8)(
)
m m n m
M
M
l N
M
, (9)(
)
n n m n
Where
stands for the learning rate of the stochastic gradient descent.3
Experiment
3.1
Experimental data
A 100k data set originated from the movies provided by GroupLens project team from University of Minnesota were used in the experiment, denoted as data set A.
Data set A included 100,000 scores for 1,682 movie items given by 943 users. Each user scored 20 movie items at least. The score was an integer between 0 and 5. The more the user liked the movie the higher was the score. The sparseness of the data set A suggested the percentage of the movie items which were not scored by the users, i.e. 1-100,000/(943×1682) ≈ 0.937.
The 100,000 scores in data set A were randomly divided into two disjoint sets, the training and the testing set. The training set which included 80% of the data was expressed as S1, while the testing set which included 20% of the data was expressed as S2. The data set A was divided 10 times to perform cross validation on the algorithm.
To enhance the recommendation efficiency of the algorithm, batch processing module was added. The 100000 scores were divided into 10 batches. 10000 scores were processed every time. This way, the computational quantity of the system and the convergence instability of the model produced in calculation could be reduced.
The collaborative filtering recommendation algorithm based on probability matrix decomposition performed as follows.
Input: training set and testing set
Output: Predicted score and square root error Data such as regularization parameter were set The number of movies and users were set.
If the iteration epoch < max epoch, then the 100000 scores were divided into 10 groups, 10,000 in each group, for separate processing.
If the patch processing was lower than 10, then the loss function q was calculated, and then matrix calculation was performed.
End
The predicted scores in the testing set were revised to positive integers through rounding off, and then square root error was calculated.
End
3.2
Scoring criteria
3.2.1
MAE
The MAE measure included the calculation of the absolute and average values of the difference between a predicted score and a real score [8]; hence it could be used for detecting the average difference between a predicted score and a real score. The smaller the value of MAE was, the more accurate the algorithm was.
1
ek ek
MAE e M and k N d x
c
, (11) where
ek
d stands for the predicted score of the user e
on item k, ek
x stands for the real score of the user e on the
item k, set M and N stand for the sets of users and items in the testing set, and c stands for the number of
ek
d or xek .
3.2.2 Root-mean-square error
Root-mean-square error refers to the average value of quadratic sum of the error between the two scores. The smaller the root-mean-square error was, the more accurate the prediction was [9].
2
1
( ek ek)
RMSE e M and k N d x
c
, (12)where
ek
d stands for the predicted score of the user e on item k,
x
ek stands for the real score of user the e on item k, set M and N stand for the sets of users and items in the testing set, and c stands for the number ofd
ek orek
x
.3.2.2
Accuracy
Accuracy could be expressed as:
X Accuracy
R
, (13)
Where
|
ek ek ek
Xd d x , i.e. set X was the set of the
predicted scores which were equal to the real scores in the testing set,
ek
d D (D was the set of the predicted scores), and
ek
x R (R was the set of the real scores).
Both, the corrected probability of an item and the prediction accuracy, could be recommended to users.
3.3
Design of experiment
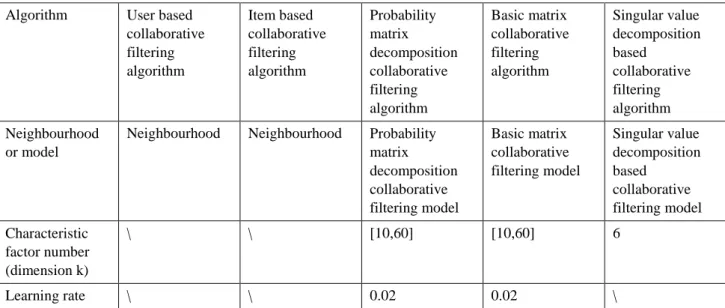
The specific content of the experiment was as follows. To analyze the application performance of probability matrix decomposition based collaborative filtering algorithm in the experimental aspect, the movie evaluation mentioned in the preceding text was taken as the data set, and the user based collaborative filtering algorithm, the item based collaborative filtering algorithm and the probability matrix decomposition based collaborative filtering algorithm were compared. To better analyze the application performance of the probability matrix decomposition based collaborative filtering algorithm, the other two algorithms, i.e. the basic matrix based collaborative filtering algorithm and the singular value decomposition based collaborative filtering algorithm, were also tested. The parameter setting of the algorithms is shown in Table 1.
collaborative filtering algorithm and the singular value decomposition based collaborative filtering algorithm used in the performance comparison were developed by referring to the relevant literature and revised according to the data which needed to be detected. The characteristic factor number of singular value decomposition based collaborative filtering algorithm was fixed, 6. The setting of characteristic factor number of the basic matrix collaborative filtering algorithm was the same as the probability matrix decomposition collaborative filtering algorithm, [10, 60], and the unit stepping was set to10.
4
Experimental results and analysis
4.1
MAE and RMSE
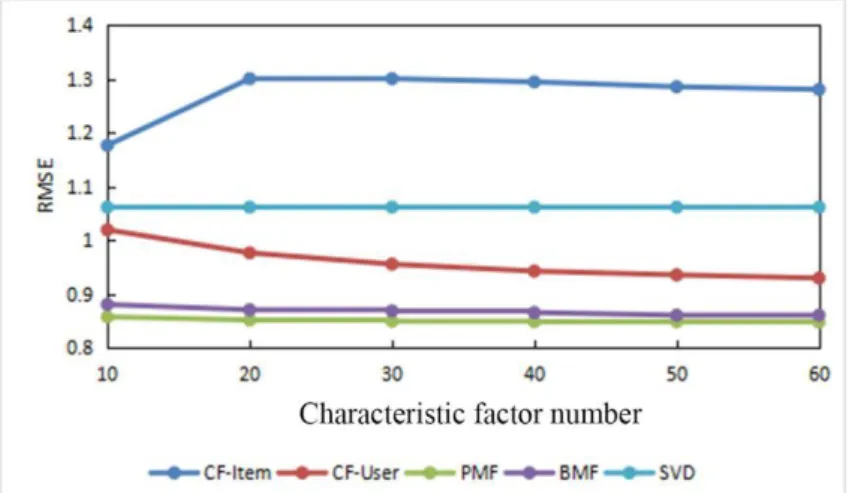
It could be noted from the Figure 1 and 2 that the predictive recommendation performance of the user based collaborative filtering algorithm was the poorest, and the prediction performance of the singular value decomposition based collaborative filtering algorithm was not affected by characteristic factor number, but was poorer than that of the user based collaborative filtering algorithm. The performance of the user based collaborative filtering algorithm was far worse than that of the probability matrix decomposition collaborative filtering algorithm and the basic matrix based collaborative filtering algorithm. The performance of the probability matrix decomposition collaborative filtering algorithm and the basic matrix based collaborative filtering algorithm was similar, but the probability matrix decomposition collaborative filtering algorithm was still superior. The reason why there was a significant difference between the performance of the user based collaborative filtering algorithm and the item based collaborative filtering algorithm is the score given by a scorer was probably affected by the view of other scorers who had the same interests. The reason why the performance of the singular value decomposition based collaborative filtering algorithm in the prediction and
recommendation was significantly poorer than that of the basic matrix collaborative filtering algorithm and the probability matrix decomposition collaborative filtering algorithm was the fact that the singular value decomposition based collaborative filtering algorithm was actually an improved version of the item based collaborative filtering algorithm and therefore had similar shortcomings as the original algorithm, i.e., the matrix obtained after the preprocessing had data distortion compared to the original matrix, which could have affected the accuracy and the similarity of the score prediction. But the performance of the singular value decomposition based collaborative filtering algorithm was better than of the item based collaborative filtering algorithm, indicating the improved accuracy of the singular value decomposition based collaborative filtering algorithm.
It could be noted from the Figure 1 that the values of the root-mean-square error (RMSE) corresponding to the basic matrix based collaborative filtering algorithm and the probability matrix decomposition collaborative filtering algorithm gradually decreased with the increase of the characteristic factor number; the larger the characteristic factor number, the smaller the decrease amplitude. When the characteristic factor number was 50, the value of RMSE was the minimum, and the prediction accuracy was the highest; when the characteristic factor number was between 10 and 20, the decrease amplitude of RMSE of the basic matrix based collaborative filtering algorithm and the probability matrix decomposition collaborative filtering algorithm was large, around 1.14% and 0.700% respectively. It was found that the values of the RMSE of the two algorithms were lowly sensitive to the characteristic factor number, especially of the probability matrix decomposition collaborative filtering algorithm. When the characteristic factor number was larger than 40, the fluctuation of the RMSE was quite small.
Similar to Figure 1, the MAE corresponding to the basic matrix based collaborative filtering algorithm and Algorithm User based
collaborative filtering algorithm
Item based collaborative filtering algorithm
Probability matrix decomposition collaborative filtering algorithm
Basic matrix collaborative filtering algorithm
Singular value decomposition based
collaborative filtering algorithm Neighbourhood
or model
Neighbourhood Neighbourhood Probability matrix decomposition collaborative filtering model
Basic matrix collaborative filtering model
Singular value decomposition based
collaborative filtering model Characteristic
factor number (dimension k)
\ \ [10,60] [10,60] 6
Learning rate \ \ 0.02 0.02 \
the probability matrix decomposition based collaborative filtering algorithm also decreased with the increase of the characteristic factor number and reached the minimum values, 0.675 and 0.666 respectively, when the characteristic factor number was 60. Moreover it was noted that when MAE was taken as the evaluation index, the curves of the basic matrix collaborative filtering algorithm and the probability matrix decomposition based
collaborative filtering algorithm nearly coincided, and the prediction performance was also close. Moreover, since the RMSE is more sensitive to the measurement error, the probability matrix decomposition based collaborative filtering algorithm had an advantage over the basic matrix collaborative filtering algorithm due to the addition of the regularization term.
Figure 1: Variation of the RMSE of the five algorithms with the increase of the characteristic factor number.
Figure 2: Variation of the MAE of the five algorithms with the increase of the characteristic factor number.
4.2
Accuracy
It was found from the comparison of the RMSE and the MAE between the five algorithms that the prediction performance of the CF-User, the item based collaborative filtering algorithm and the singular value decomposition based collaborative filtering algorithm was significantly different from the basic matrix based collaborative filtering algorithm and the probability matrix decomposition based collaborative filtering algorithm. Therefore, only the accuracy of the basic matrix based collaborative filtering algorithm and the probability matrix decomposition based collaborative filtering algorithm were considered. The results are shown in Table 2.
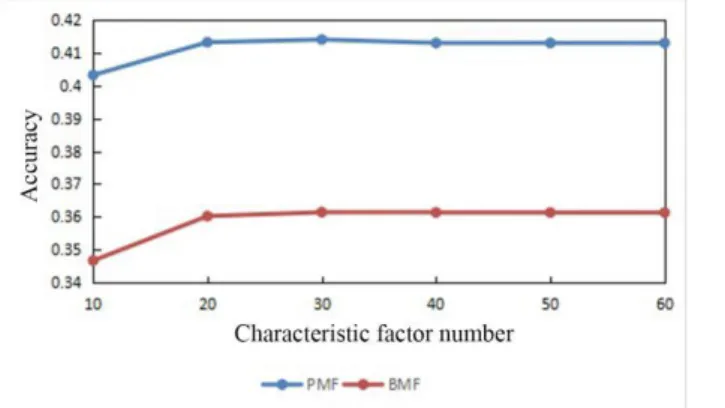
It could be noted from Figure 3 that the tendency of the accuracy of the basic matrix collaborative filtering algorithm and the probability matrix decomposition based collaborative filtering algorithm was opposite to the
tendencies of the MAE and the RMSE. When the characteristic factor number was small, the accuracy was low; the accuracy increased first and then tended to be stable with the increase of the characteristic factor number
Characteristic factor number
PMF BMF
10 0.40321 0.34666
20 0.41321 0.36022
30 0.41403 0.36142
40 0.41300 0.36134
50 0.41299 0.36132
60 0.41298 0.36132
Figure 3: The accuracy of the basic matrix based
and nearly had no fluctuation when the characteristic factor number was larger than 30. It was because the effective information increased with the increase of the characteristic factor number. The accuracy of the probability matrix decomposition based collaborative filtering algorithm was much higher than that of the basic matrix based collaborative filtering algorithm. Therefore the proposed algorithm could improve the searching speed and preciseness.
Figure 4: Comparison of the accuracy of the probability matrix decomposition based collaborative filtering algorithm (PMF) and the basic matrix based collaborative filtering algorithm (BMF).
The recommendation system which can filter diversified data is an effective filtering approach [10]. It can recommend individual information to users according to users’ requirements. Therefore it can be convenient for information collection and has been extensively applied on the Internet. Wei et al. [11] put forward project category similarity and interestingness measure based collaborative filtering recommendation algorithm which could recommend information to users through calculating project categories and interestingness and had high prediction preciseness. In a study of Chen et al. [12], a mixed recommendation system was put forward to recommend users with learning projects searching. In the test, the algorithm effectively collected information, suggesting a favorable performance.
5
Conclusion
In conclusion, the probability matrix decomposition based collaborative recommendation algorithm was put forward in this study, and then it was developed for data searching recommendation. Afterwards the MAE, the RMSE and the accuracy of the algorithm were tested. Moreover the MAE values, the RMSE values and the accuracy of the CF-User, the item based collaborative filtering algorithm, the singular value decomposition based collaborative filtering algorithm and the basic matrix based collaborative filtering algorithm were compared. The testing results suggested that the improved collaborative recommendation algorithm had the highest preciseness and accuracy, and the preciseness and the accuracy became the largest and stable when the characteristic factor number was more than 40. Therefore it could be applied in a computer searching system. This work
provides a reference for the progress of the collaborative recommendation algorithm.
6
Acknowledgement
This study was supported by the Fund of Natural Science of Hebei (A2015209040).
7
References
[1] Wang W, Wu YH, Wu YY. (2016). A Multi-stage Heuristic Algorithm for Matching Problem in the Modified Miniload Automated Storage and Retrieval System of E-commerce. Chinese Journal of Mechanical Engineering, 29(3):1-8.
[2] Li L. (2017). Analytical Application of Hadoop-Based Collaborative Filtering Recommended Algorithm in Tea Sales System. International Conference on Applications and Techniques in Cyber Security and Intelligence. Edizioni della Normale, Cham, 434-441.
[3] Yu Z Y, Wang J D, Zhang H W, Niu K. (2016). Services recommended trust algorithm based on cloud model attributes weighted clustering. Automatic Control & Computer Sciences, 50(4):260-270.
[4] Zhang F, Yang J, Tai Y, Tang J. (2015). Double Nuclear Norm Based Matrix Decomposition For Occluded Image Recovery and Background Modeling. IEEE Trans Image Process, 24(6):1956-1966.
[5] Simpson R, Devenyi G A, Jezzard P, Hennessy TJ, Near J. (2017). Advanced processing and simulation of MRS data using the FID appliance (FID-A)-An open source, MATLAB-based toolkit. Magnetic Resonance in Medicine, 77(1):e56841.
[6] Ando T, Bai J. (2015). Selecting the Regularization Parameters in High-dimensional Panel Data Models: Consistency and Efficiency. Econometric Reviews, 151014164537003.
[7] Wu K, Sun Y, Huai Y, Jia SQ, Chen X, Jin YQ. (2015). Multi-perturbation stochastic parallel gradient descent method for wavefront correction. Optics Express, 23(3):2933-44.
[8] Franses P H. (2015). A note on the Mean Absolute Scaled Error. International Journal of Forecasting, 32(1):20-22.
[9] Nuutinen M, Virtanen T, Häkkinen J. (2016). Performance measure of image and video quality assessment algorithms: subjective root-mean-square error. Journal of Electronic Imaging, 25(2):023012. [10] Knobelsdorff P M G V, Reiferscheid F, Straakholder
T M, Wirtz MS. (2004). Wird der Algorithmus des European Resuscitation Council zur kardiopulmonalen Reanimation eingehalten?. Intensivmedizin Und Notfallmedizin, 41(1):22-28. [11] Wei S, Ye N, Zhang S, Huang X, Zhu J. (2012).