172 Soni and Gautam, 2017 @IJART-2016, All Rights Reserved INTERNATIONAL JOURNAL OF APPLIED RESEARCH AND TECHNOLOGY
ISSN 2519-5115 RESEARCH ARTICLE
Clustering Based Analytical Review for Improving the Quality of Primary
Education in MP
1
Mukesh Kumar Soni 2
S. S. Gautam
1,2
Faculty of Science & Technology, MGCGV Chitrakoot Satna MP
Corresponding author: Mukesh Kumar Soni
Received: April 13, 2017 Revised: June 21, 2017 Published: June 30, 2017
ABSTRACT
Data mining is a powerful analytical tool that enables educational institutions to better allocate resources and staff, and proactively manage student outcomes. The management system can improve their policy, enhance their strategies and thereby improve the quality of that management system. Data mining techniques capabilities provided effective improving tools for student performance. Different clustering algorithms have been used to measure the performance of students such as hierarchical agglomerative clustering, K- means and model based clustering to identify groups of students with similar skill profiles a clustering algorithm based on large generalized sequences to find groups of students with similar learning characteristics based on their traversal path patterns. The main indicator of the quality of elementary education can be visualized in terms of its product like the learners achievement both in scholastic and co-scholastic areas i.e. the performance in various subjects of study and habits, attitudes, values and life skills necessary for becoming a good citizen. Quality issues in elementary education will revolve around the quality of infrastructure and support services, opportunity time, teacher characteristics and teacher motivation, pre-service and in-service education of teachers, curriculum and teaching-learning materials, classroom processes, pupil evaluation, monitoring and supervision etc.
173 INTRODUCTION
Education plays an important role in the progress of an individual‟s mind and country. People are made aware of what is going on in the world and can understand these issues and take necessary measures, if they are educated. Education tames the astray mind, nurturing its capabilities the same way, training builds a clever dog. Education plays an essential role in the overall personality development of individual. What is more important is provision of quality education rather than opening schools without taking care about quality issues. With the passage of time it was realized that education is necessary for all without any discrimination on the basis of caste and creed. Gradually various national, international and state boards and organizations of school education came into existence to serve some or the other purposes. Hence there is a need for study about qualitative and graspable syllabus, pedagogy, simple and efficient examination and evaluation, accreditation and affiliation etc.
Data mining is a powerful analytical tool that enables educational institutions to better allocate resources and staff, and proactively manage student outcomes. The management system can improve their policy, enhance their strategies and thereby improve the quality of that management system (Sukany et al, 2012). Data mining techniques capabilities provided effective improving tools for student performance. It showed how useful data mining can be in higher education in particularly to predict the final performance of student, on working on performance, many attributes have been tested, and some of them are found effective on the performance prediction. The job title was the strongest attribute, then the university type, with slight effect of degree and grade (Qasem & Eman). Data Mining could be used to improve business intelligence process including education system to enhance the efficacy and overall efficiency by
optimally utilizing the resources available. The performance, success of students in the examination as well as their overall personality development could be exponentially accelerated by thoroughly utilizing Data Mining technique to evaluate their admission academic performance and finally the placement (Sonali et al, 2012).
Quality Education and K-means Clustering
Objective of the Study
If we focus in the size of the system, it is bound to have certain limitations, which can be grouped under administrative and non-administrative problems. Keeping in view the educational facilities available in the country at that time, the goal was far too ambitious to achieve within a short span of ten years. Hence, the target date was shifted a number of times. Till 1960, all efforts were focused on provision of schooling facilities. It was only after the near realization of the goal of access that other components of UEE, such as universal enrolment and retention, started receiving attention of planners and policy makers. It is the Quality of Education, which is at present in the focus in all programmes relating to elementary education in general and primary education in particular. Therefore there is need to measure the quality achievements of studied schools through various quality indicators. So that we make a golden plan for educated and brighter india
Literature
One of the fundamental concepts operating within the data mining hyperspace is the cluster, which is formed of sets of feature vectors that are understood by examining their standard deviations. The tighter the vectors cluster, the better it is for classification purposes. In this case, the clusters are considered as good features, or gestalts. Both rule induction and neural network data mining techniques fall under the category of machine learning (Hand, 1999), and they are based on various sophisticated and high-speed modeling techniques for predicting outcomes or uncovering hidden patterns. Cluster detection is inherently unsupervised data mining (Berry and Linoff, 1997) and decision trees are used for supervised data mining. Clustering has been developed to establish a recommendation model for students in similar situations in the future
(Wang & Shao, 2004) for grouping web documents using clustering methods in order to personalize e-learning based on maximal frequent item sets (Su et al., 2008) for providing personalized course material recommendations based on learner ability (Wang & Shao, 2004) and to recommend to students those resources they have not yet visited but would find most helpful (Girones & Fernandez, 2006). Data mining assumes the existence of spherical multi-Euclidean dimensions (Delmater and Hancock, 2001). The n-dimensional Euclidean space, or Euclidean hyperspace, is called feature space, where any given coordinates of ordered triples or ordered pairs are viewed as feature vectors.
175 algorithm to solve the problem of
allocating new students (which places new students into classes so that the gaps between learning levels in each class is minimum and the number of students in each class does not exceed the limit (Zukhri & Omar, 2007).
METHODOLOGY
Data Collection: Any valid data set / report of MP government‟s agencies is used for secondary data.
Data Pre-Processing: Data is to be pre-processed to remove the noisy and unwanted data. Data pre-processing includes following processes:
Data cleansing: Noisy data and irrelevant data are removed from the collection. Data cleaning routines attempted to fill in missing values, smooth out noise while identifying outliers, and correct inconsistencies in the data
Data transformation: In this phase selected data is transformed into forms appropriate for the mining procedure. Data transformation involves the smoothing, aggregation, generalization, normalization; attribute construction, data reduction, discretization etc.
Current Status of Elementary Education in Madhya Pradesh
Education is the fourth necessity for man after food, clothing and shelter, in today‟s competitive world. Education is a process of instruction which is aimed at the all-round development of individuals and the provision of necessary tools and knowledge to understand and participate in day to day activities of today‟s world. It forms the basis for lifelong learning and
inspires individuals with the confidence to face challenges. It provides individuals with the skills to become more self-reliant and enhances their ability to manage their health and nutrition related activities and to plan for the future. Education is also a fundamental requirement in a democracy. Through education people become more informed and responsible citizens, capable of exercising wise choices and finding their voice in politics.
Table -1: Literacy Rate: India & Madhya Pradesh (Source: State education report – MP)
Year
India Madhya Pradesh
Persons Male Female Gap in
literacy Persons Male Female
Gap in literacy
1981 43.6 56.4 29.8 26.6 38.6
1991 52.2 64.1 36.3 24.8 44.7 58.5 29.4 29.2
2001 64.8 75.3 53.7 21.6 63.7 76.1 50.3 25.8
2011 74.0 82.1 65.5 16.6 70.6 80.5 60.0 20.5
Table -2: Literacy rate by sex (Source: State education report – MP)
S.No. India/State
Literacy Rate
Persons Male Female Gender Gap in
Literacy
1 India 74.0 82.1 65.5 16.6
2 Uttarakhand 79.6 88.3 70.7 17.6
3 Orissa 73.5 82.4 64.4 18
4 Chattisgarh 71.0 81.5 60.6 20.9
5 Madhya Pradesh 70.6 80.5 60.0 20.5
6 Uttar Pradesh 69.7 79.2 59.3 19.9
7 Jharkhand 67.6 78.5 56.2 22.3
8 Rajasthan 67.1 80.5 52.7 27.8
9 Bihar 63.8 73.4 53.3 20.1
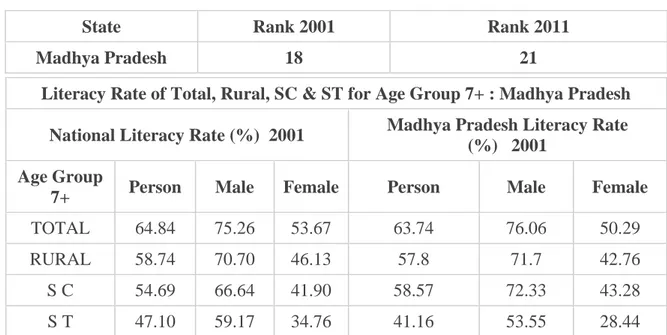
Table -3: Status of Madhya Pradesh (Source: State education report – MP)
State Rank 2001 Rank 2011
Madhya Pradesh 18 21
Literacy Rate of Total, Rural, SC & ST for Age Group 7+ : Madhya Pradesh
National Literacy Rate (%) 2001 Madhya Pradesh Literacy Rate
(%) 2001
Age Group
7+ Person Male Female Person Male Female
TOTAL 64.84 75.26 53.67 63.74 76.06 50.29
RURAL 58.74 70.70 46.13 57.8 71.7 42.76
S C 54.69 66.64 41.90 58.57 72.33 43.28
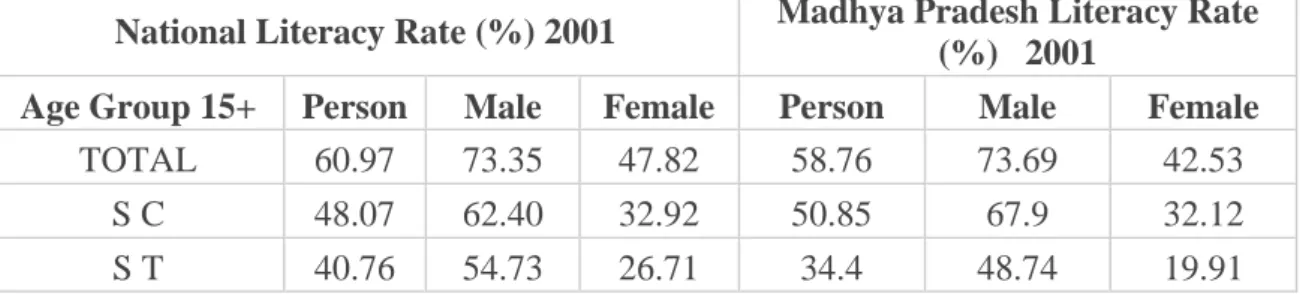
177 Table -4: Literacy Rate of Rural, SC & ST for Age Group 15+ (Source: State education
report – MP)
National Literacy Rate (%) 2001 Madhya Pradesh Literacy Rate
(%) 2001
Age Group 15+ Person Male Female Person Male Female
TOTAL 60.97 73.35 47.82 58.76 73.69 42.53
S C 48.07 62.40 32.92 50.85 67.9 32.12
S T 40.76 54.73 26.71 34.4 48.74 19.91
Table -5: Literacy Rate of Rural, SC & ST for Age Group 15+ (Source: State education report – MP)
National Literacy Rate (%) 2001
Madhya Pradesh Literacy Rate (%) 2001
Age Group 15+ Person Male Female Person Male Female
TOTAL 60.97 73.35 47.82 58.76 73.69 42.53
S C 48.07 62.40 32.92 50.85 67.9 32.12
S T 40.76 54.73 26.71 34.4 48.74 19.91
Table -6: National Literacy Rate (Source: State education report – MP)
National Literacy Rate (%) 2011 Madhya Pradesh Literacy
Rate (%) 2011
Age Group 7+ Person Male Female Person Male Female
TOTAL 74.04 82.14 65.46 70.63 80.53 60.02
RURAL 68.91 78.57 58.75 65.29 76.64 53.20
Decadal Increase in
Literacy Rate 9.20 6.88 11.79 6.89 4.47 9.73
Decadal Increase in
Literacy Rate Rural 10.17 7.87 12.62 7.49 4.94 10.44
A strong focus on quality issues in elementary education underpins all efforts under SSA, which will increasingly become centre stage, as the programme advances. There is a clear outcome orientation within the programme, reflecting an understanding that inputs of different kinds, whether in the form of additional teachers, training programmes, textbooks etc. must translate into tangible outcomes that reflect improvement in the quality of classroom transactions, pedagogic practices and learning outcomes of children. SSA includes several features that seek to improve the quality of
elementary education, (a) ensuring basic provisioning to enable improvement in the quality of classroom transactions; (b) large scale capacity building of States, for undertaking interventions for quality enhancement; and (c) evaluation of quality related processes and assessment of learning outcomes.
Some Basic Parameters of Elementary Quality Education
co-scholastic areas i.e. the performance in various subjects of study and habits, attitudes, values and life skills necessary for becoming a good citizen. The factors associated with success in these areas, which relate to conditions of learning and learning environment, are also sometimes considered as indicators of quality of elementary education. Thus ensuring quality in the inputs and processes becomes necessary if quality achievement is aimed at.
Quality issues in elementary education will therefore, revolve around the quality of infrastructure and support services, opportunity time, teacher characteristics and teacher motivation, pre-service and in-service education of teachers, curriculum and teaching-learning materials, classroom processes, pupil evaluation, monitoring and supervision etc. Indeed improvement of quality in these parameters and its sustenance is a matter of grave concern for the whole system of education.
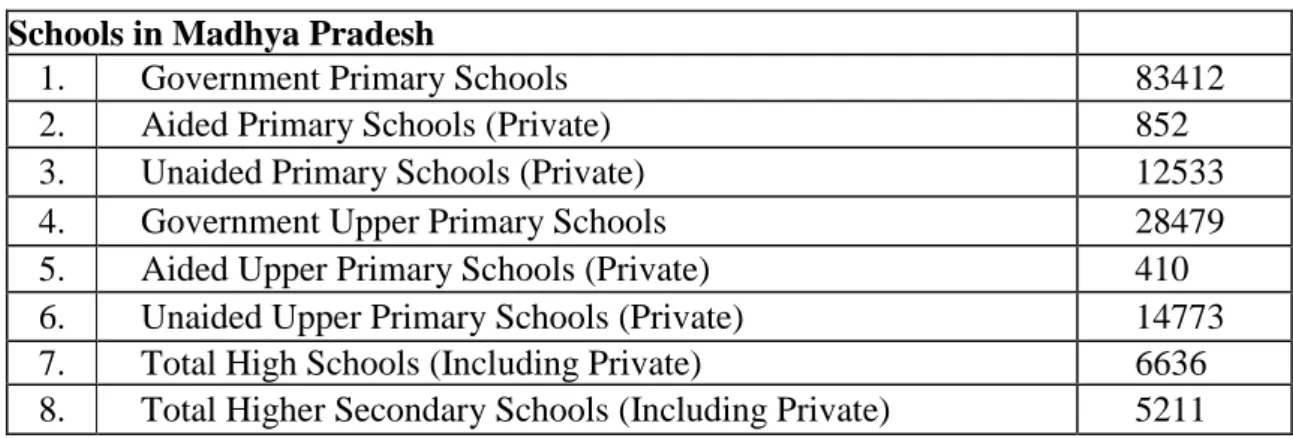
Table -7: Status of Schools in MP
Schools in Madhya Pradesh
1. Government Primary Schools 83412
2. Aided Primary Schools (Private) 852
3. Unaided Primary Schools (Private) 12533
4. Government Upper Primary Schools 28479
5. Aided Upper Primary Schools (Private) 410 6. Unaided Upper Primary Schools (Private) 14773 7. Total High Schools (Including Private) 6636 8. Total Higher Secondary Schools (Including Private) 5211
Table -8: Status of Attendance, Retention Rate, Completion Rate
S.N. Educational Indicators Primary Upper Primary
Boys Girls Total Boys Girls Total
1 Average Attendance 87.86 85.94 86.90 88.38 86.24 87.20
2 Dropout Rate 9.88 10.51 10.30 9.34 9.42 9.39
3 Retention Rate 90.12 89.49 89.70 90.66 90.58 90.61
4 Overall Repetition Rate 9.28 9.56 9.42 7.28 7.25 7.26
5 Completion Rate 80.40 85.92 83.06 72.58 71.97 72.29
The socio-economic background of children acts as a determinant for access to schools, which differ in terms of resources and quality. There are many well-equipped private schools, mainly located in cities, catering to the elite strata3 and there has
been a steady increase in enrolment in these schools. These schools enhance gender and social inequality. Similarly, the children of urban poor that includes migrants, slum and pavement dwellers, sex
179 learning attainment. Despite a „no
detention policy‟, many children repeat their grades and many fail to learn adequately and eventually drop out because of ineffective teaching and a discriminatory attitude of teachers towards them.
It is evident that the social background of children in all three clusters determines both their access to education and the type of schools they go to. The existence of different types of schools has made access even more unequal, because schools differ considerably in terms of physical and academic resources, further increasing inequality in participation and learning outcomes of children. Many children from disadvantaged groups have not benefited even after five years of schooling, as the schools fail to cater to their educational needs due to inadequate academic and physical resources. Thus, social inequalities and disparities continue to persist in Indian society, and their nexus with numerous interacting influences pose a formidable challenge for ensuring equity in education. The challenge, therefore, is to move from increasing enrolment to achieving greater inclusion and quality by providing equal opportunity to all children, irrespective of their social background.
CONCLUSION
Bringing children within the fold of education is not enough, providing them quality education by ensuring equal learning opportunities for all, retaining them for the entire schooling cycle and ensuring adequate learning are the real challenges that need to be met with a sense of urgency. The National Policy on Education (NPE), 1986 suggested provision of essential facilities for achieving universal access to comparable quality education and laid special emphasis on removal of disparities.11 It also emphasized improving learning attainment of disadvantaged children at a faster rate to bring them at par with the
others. The post-NPE period, especially the 1990s, witnessed many schemes like the District Primary Education Programme (DPEP) and Sarva Shiksha Abhiyan (SSA) to help bridge the social and gender gap in elementary education.
The growing inequality in educational access and participation has its roots in India‟s patriarchal and caste based stratified social structure. Despite many constitutional safeguards (Articles 38, 15, 16, 17, and 21A) and enabling policies, social and economic divisions between different social groups remain stark. Opportunities and resources are not distributed fairly and the access to them is determined by the position of individuals in society based on caste, class and gender, leading to disparity in education. Despite the constitutional safeguards, these groups continue to lag behind the mainstream population in every aspect of life as social and regional disparities are intertwined problems resulting from an uneven spread of educational facilities across states.
REFERENCES
Ayers, E., Nugent, R., & Dean, N. (2009). A Comparison of Student Skill Knowledge Estimates. In International Conf. on Educational Data Mining, Cordoba, Spain, 1-10.
Barker-Plummer, D., Cox, R., Dale, R. (2009). Dimensions of difficulty in translating natural language into fist order logic. In International Conference on Educational Data Mining, Cordoba, Spain, 220-228.
Berry, M., and Linoff, G. Data Mining Technique: For Marketing, Sales, and Customer Support. New York: Wiley Computer Publishing, 1997.
Berthold, M. (1999). “Fuzzy Logic.” In M. Berthold and D. Hand (eds.), Intelligent Data Analysis.Milan: Springer, 1999.
Mining, Journal of Educational Technology Systems Volume 36, Number 4 / 2007-2008
Chandra & Nandhini, (2010). Knowledge mining from student data, European journal of scientific research, vol 47 no. 1
Chen, C., Chen, M., & Li, Y. (2007). Mining key formative assessment rules based on learner portfiles for web-based learning systems. In IEEE International Conference on Advanced Learning Technologies, Japan, 1-5.
Delmater, R., and Hancock, M. (2001). Data Mining Explained: A Manager‟s Guide to Customer-Centric Business Intelligence. Boston: Digital Press, 2001.
Fung G. (2001). A Comprehensive Overview of Basic Clustering Algorithms, Edition – 2, June 22, 2001
Girones, M., & Fernandez, T.A. (2006) Ariadne, a guiding thread in the learning process‟s labyrinth. In International Conference on Current Developments in Technology-Assisted Education, Sevilla, 287-290.
Hand, D. (1999). “Introduction.” In M. Berthold and D. Hand (eds.), Intelligent Data Analysis.Milan: Springer, 1999.
Hardof-jaffe, S., Hershkovitz, A., Abu-kishk, H., Bergman, O., & Nachmias, R. (2009). How do students organize personal information spaces?. In International Conference on Educational Data Mining, Cordoba, Spain, 250-258.
Mirza Edin, (2012), Data Mining approach for predicting student performance, journal of economics and business, Vol 10, issue 1,may 2012
Myller, N., Suhonen, J., Sutinen, E. (2002). Using Data Mining for Improving Web-Based Course Design. In International Conference on Computers in Education, Washington, 959- 964.
Nugent, R., Ayers, E., Dean, N. (2009). Conditional subspace clustering of skill mastery: identifying skills that separate students. In International Conference on Educational Data Mining, Cordoba, Spain, 101-110.
Qasem A. & Eman N, (2012).Using data mining techniques to build a classification model for predicting employees performance, IJACSA,vol 3 no. 2,.
Sonali et al, (2012). Data Mining in Education: Data classification and Decision tree approach, International journal of education, business, e-management and e-learning, vol 2 no. 2
Sukany M. et al, (2012) Data mining:performance improvement in education sector using classification & clustering algorithm, ICCCE ,April 2012.
Tang, T.Y. and Mccalla, G. (2002). Student modeling for a web-based learning environment: a data mining approach. In Conference on Artificial intelligence, Edmonton, Canada, 967-968.
Wang, F.H., and Shao, H.M. (2004). Effective personalized recommendation based on time-framed navigation clustering and association mining. In Expert System in Application Journal, 27, 365-377.
Westphal, C. and Blaxton, T. (1998). Data Mining Solutions: Methods and Tools for Solving Real-World Problems. New York: Wiley Computer Publishing, 1998.