International Journal
of
Innovative Computing
Journal Homepage: http://se.cs.utm.my/ijicClassification of SIM Box Fraud Detection
Using Support Vector Machine and Artificial
Neural Network
Abdikarim Hussein Elmi, Roselina Sallehuddin, Faculty of Computing
Universiti Teknologi Malaysia 81310 Skudai, Johor, Malaysia
[email protected], [email protected]
Subariah Ibrahim, Azlan Mohd Zain
Faculty of Computing Universiti Teknologi Malaysia 81310 Skudai, Johor, Malaysia,
[email protected], [email protected]
Abstract— SIM box fraud is classified as one of the dominant types of fraud instead of subscription and superimposed types of fraud. This fraud activity has been increasing dramatically each year due to the new modern technologies and the global superhighways of communication, resulting the decreasing of the revenue and quality of service in telecommunication providers especially in Africa and Asia. This paper outlines the Artificial Neural Network (ANN) and Support Vector Machine (SVM) to detect Global System for Mobile communication (GSM) gateway bypass in SIM Box fraud. The suitable features of data obtained from the extraction process of Customer Database Record (CDR) are used for classification in the development of ANN and SVM models. The performance of ANN is compared with SVM to find which model gives the best performance. From the experiments, it is found that SVM model gives higher accuracy compared to ANN by giving the classification accuracy of 99.06% compared with ANN model, 98.71% accuracy.
Keywords: SIM box fraud, Artificial Neural Network, Support Vector Machine.
I.INTRODUCTION
According to the Cambridge Advanced Learner’s Dictionary, fraud is an intentional deception or cheating intended to gain an advantage while fraud in communication
committing most types of fraud. For example, simple methods like social engineering can be used to obtain access codes and makes implementation of fraud feasible. Finally, a single phone call made is directly convertible to money. Since fraud has direct impact to the telecom companies as well as their customers, the detection and prevention of fraud has become a priority (Pandya, 2013).
Fraud detection methods continuously evolve from time to time (Zou et al., 2012). There is no comprehensive published research on this area mainly due to the lack of publicly available data to perform the experiment. Any broad research published publicly about fraud detection methods will be utilized by fraudsters to evade from detection (Azgomi, 2009). The data to be used for the experiments contains confidential information of customers and in most cases law and enforcement authorities prohibit exposing the confidential information of customers, making them difficult to access them difficult to access (Hilas and Sahalos, 2005; Suman and Nutan, 2013). Moreover, many fraud detection problems involved huge data sets that are constantly evolving (Bolton and Hand, 2002). For example, the data sets can be large as tenth of thousands of calls per weekday for an organization with 3 or 4 thousand employees to hundreds of millions of calls for national carriers. Processing these data sets in a search for fraudster’s activities or calls requires more than mere novelty of statistical model, and also need fast and efficient algorithms. Existing research work is mainly focusing on subscription and superimposed types of fraud which are the dominant types of fraud in telecom industries worldwide. However, another type of fraud called SIM box bypass fraud has become a challenging threat to telecom companies in some parts of Africa and Asia. The success of this fraud depends on obtaining SIM cards. Therefore the effects of SIM box bypass fraud vary across countries. In countries where unregistered SIM cards are not allowed and the government laws recognize the SIM box devices as illegal equipment, the effect is less compared to countries where obtaining of SIM cards by customers is very cheap or even free and government laws do not prohibit unregistered subscribers. The fact that this type of fraud is not a problem for all telecom companies worldwide might justify the reason why the publicly available research on this type of fraud is very limited.
SIM box fraud takes place when individuals or organizations buy thousands of SIM cards offering free or low cost calls to mobile numbers. The SIM cards are used to channel national or international calls away from mobile network operators and deliver them as local calls, costing operators' millions in revenue loss (Telenor, 2010). A SIM box is VoIP gateway device that maps the call from VoIP to a SIM card (in the SIM box) of the same mobile operator of the destination mobile. The paper is aims to identify a set of suitable descriptors and features from Customer Database Record (CDR) in order to detect the SIM box fraud. It was found that a total of nine features found from the derivation of the attributes in CDR. Multilayer Perceptron (MLP) in Artificial Neural Network and Support Vector Machine (SVM) are promising solutions to this type of problem as they can learn complex patterns within a noisy data. SVM has
recently found considerable attention in classification problems due to its generalization capabilities and speed of processing. Therefore SVM will also be applied in this problem. The models were developed and the best model of ANN and SVM will be compared so that the best model to classify the SIM box fraud detection can be determined.
The remainder of this paper is structured as follows. The previous research works of fraud detection as well as theoretical implementation of ANN and SVM are briefly reviewed in section 2. Section 3 describes the research methodologies and also the model development for SIM box fraud detection. Section 4 reports the findings and the discussion of the results followed by a conclusion of the study in Section 5.
II.RELATED STUDIES
This section reviews some prominent work related to fraud detection methodologies in telecommunication industry as well as other related domains like financial institutions such as banks which have similar fraud characteristics. Most of these approaches are focusing on analysis of the customer information by means of statistical and probabilistic methods, or machine learning algorithms and rule based systems.
Barson et al. (1996) applied supervised feed-forward neural network (NN) to detect the anomalous use of subscribers. The recent and historic activity profile were constructed and it is found that the empirical results of the system show that NN can accurately classify 92.5% of the subscribers. Krenker et al. (2009) proves that using bi-directional Neural Network (bi-ANN) in predicting generic mobile phone fraud in real time gave high percentage of accuracy. Bi-ANN is used in prediction the time series of call duration attribute of subscribers in order to identify any unusual behavior. The results show that bi-ANN is capable of predicting these time series, resulting 90% success rate in optimal network configuration. However call duration is the only parameter used, therefore other relevant parameters are missing to accurately predict customer behavior. Farvaresh and Seperi (2011) applying decision tree (DT),NN and SVM in order to identify customer with residential subscription of wire line telephone service but used it for commercial purposes to get lower tariffs which is classified as subscription fraud. The employed data mining approach consist of preprocessing, clustering and classification phases. Combination of SOM and K-Means were used in the clustering phase and decision tree (C4.5), Neural Network, SVM as single classifiers were examined in the classification phase. The results are presented in terms of confusion matrix. DT, NN and SVM as single classifiers were able to correctly classify 88.1%, 84.9% and 88.2% respectively. Therefore SVM has shown best among all the classifiers. The limitation might be the computational aspects if implement in real applications.
so that classifier that shows better performance in terms of accuracy and speed can be selected. Other commonly used classifiers are Naïve Bayes and Decision trees but in this domain they are not widely used and in the cases where they have been used they have not shown good performance results compared to ANN and SVM (Farvaaresh and Seperi, 2011). The data set that will be used for the experiment contains SIM box fraud SIM cards that have been correctly labelled as fraud and normal SIM cards. This means that supervised learning approach will be used in this classification problem.
A. Artificial Neural Network
A neuron has a number of inputs and one output. It combines all the input values (Combination), does certain calculations, and then triggers an output value (activation) (MacLennan, 2008; Mark et al., 2007; Paliwar and Kumar, 2009). There are different ways to combine inputs. One of the most popular methods is the weighted sum, meaning that the sum of each input value is multiplied by its associated weight. Therefore, for a given node g we have:
ij ij j j j j ij ij
g w x w x w x w x
Net =S = 0 0 + 1 1 +.. (1)
Where xij represents the i’th input to node j, wij represents the
weight associated with the i’th input to node j and there are I + 1 inputs to node j.
The value obtained from the combination function is passed to non-linear activation function as input. One of the most common activation functions used by Neural Network is the sigmoid function. This is a nonlinear functions and result in nonlinear behaviour. Sigmoid function is used in this study. Following is definitions of sigmoid function:
x
e
Sigmoid
-+ =
1 1
(2) Where x is the input value and e is base of natural logarithms, equal to about 2.718281828. The output value from this activation function is then passed along the connection to the connected nodes in the next layer. Back-propagation algorithm is a commonly used supervised algorithm to train feed-forward networks. The whole purpose of neural network training is to minimize the training errors. Equation 3 gives one of the common methods for calculating the error for neurons at the output layer using the derivative of the logistic function:
) )( 1
( i i i
i O T O
O
Err= - - (3)
In this case, Oi is the output of the output neuron unit i, and Ti is the actual value for this output neuron based on the
training sample. The error calculation of the hidden neurons is based on the errors of the neurons in the subsequent layers and the associated weights as shown in equation 4.
ij i j i i
i O O ErrW
Err = (1- )S (4)
Oiithe output of the hidden neuron unit I, which has j outputs
to the subsequent layer. Errj is the error of neuron unit j, and
Wijis the weight between these two neurons. After the error of
each neuron is calculated, the next step is to adjust the weights in the network accordingly using equation 5.
i j ij
new
ij W l Err O
W , = + * * (5)
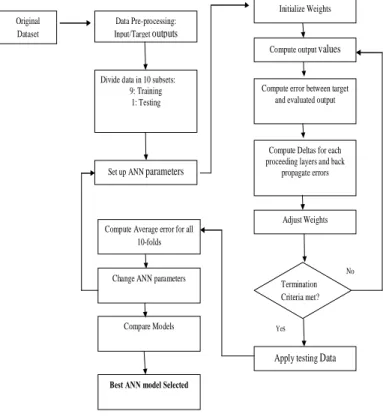
Here l, is value ranging from 0 to 1.The variable l is called learning rate. If the value of l is smaller, the changes on the weights get smaller after each iteration, signifying slower learning rates. Figure 1 shows the flow of ANN implementation.
B. Support Vector Machine
SVM which is developed by Vapnik (1995) is based on the idea of structural risk management (SRM). SVM is a relatively new computational learning method constructed based on the statistical learning theory classifier (Chiu and Guao, 2008). SVM is based on the concept of decision planes that define decision boundaries. A decision plane is one that separates between a set of objects having different class memberships. SVM creates a hyperplane by using a linear model to implement nonlinear class boundaries through some nonlinear mapping input vectors into a high-dimensional feature space.
Original Dataset
Data Pre-processing: Input/Target outputs
Divide data in 10 subsets: 9: Training
1: Testing
Set up ANN parameters
Initialize Weights
Compute output values
Compute error between target and evaluated output
Compute Deltas for each proceeding layers and back
propagate errors
Adjust Weights
Termination Criteria met?
Apply testing Data
Compute Average error for all 10-folds
Change ANN parameters
Compare Models
Best ANN model Selected
Yes
No
Fig. 1: Flow of ANN implementation For a binary classification problem where there are only two classes in the training data yi = {−1, 1} a hyper-plane can
0 .x+b=
W (6)
Where W is the normal to the hyper-plane as shown in equation 6 and offset parameter b allows us to increase the margin. |b| / |W| is the parameter that determines the shortest distance of the plane from the origin.
For a good classification model the positive and negative examples of the training data should fulfil the following two conditions: 1 1 . 1 1 . -= -£ + + = + ³ + i i i i y for b x W y for b x W (7)
These inequalities can be combined into one set of inequalities:
i b
x W
yi( . i+ )³1"1" (8)
The SVM finds an optimal hyper-plane responsible for the largest separation of the two classes. In nonlinear SVM, the training samples are mapped to a higher dimensional space with the help of a kernel function K(xi ,xj ) instead of the inner product <xi, xj > . Some of the famous kernel functions are the polynomial kernels, radial basis function kernels, and linear kernels (Radhika and Shashi, 2009). The equations for these kernels are shown in equation 9, 10 and 11.
Linear Kernel Function :
(9) Polynomial Kernel Function:
(10) Radial Base Function
(11) Where is the kernel function where each data from set xi has an influence on the kernel point of test value xj.
is a parameter for RBF kernel and p is the number of polynomial degrees for polynomial kernel function. This study considered linear kernel, Polynomial and RBF as a kernel function in SVM model implementation. Choice of kernel functions is the main parameter experimented together with C penalty parameter. For each kernel function experimented, the parameters associated with the kernel function that can also have impact on the results are considered.
III.METHODOLOGIES
This study mainly focused on three different parts, which is the datasets and descriptors, development of ANN model and also development of SVM model.
A. Datasets and Descriptors
The data sets used in this study is obtained from Customer Database Record (CDR) which stored the calls information of
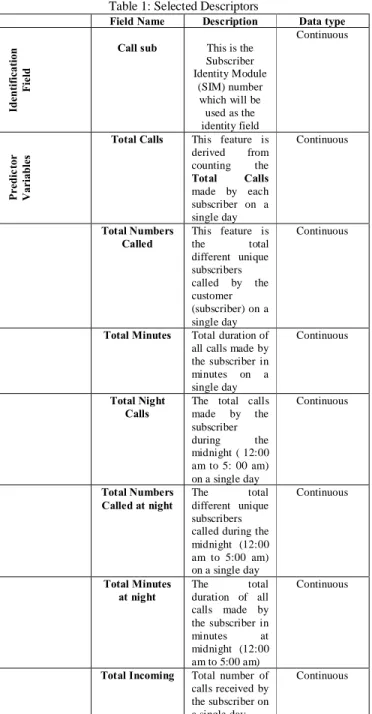
each subscriber. This study is based on Global System for Mobile communication (GSM) network and specifically CDR database of prepaid subscribers. The Artificial Neural Network (ANN) based on multilayer perceptron and Support Vector Machine (SVM) models were developed using 234,324 calls made by 6415 subscribers from one Cell-ID of the company’s network. This dataset consisted of 2126 fraud subscribers and 4289 normal subscribers which is equivalent to 66.86% of legitimate subscribers and 33.14% of SIM box fraud subscribers. The total duration of these call transactions was two months, which are January 2012 and February 2012. A total of 9 features have been identified to be useful in detecting SIM box fraud, as shown in Table 1.
Table 1: Selected Descriptors
Field Name Description Data type
Identification
Field
Call sub This is the
Subscriber Identity Module
(SIM) number which will be
used as the identity field
Continuous
Predic
tor
Variables
Total Calls This feature is
derived from
counting the
Total Calls
made by each subscriber on a single day
Continuous
Total Numbers
Called This feature is the total different unique subscribers called by the customer (subscriber) on a single day
Continuous
Total Minutes Total duration of all calls made by the subscriber in
minutes on a
single day
Continuous
Total Night
Calls The total calls made by the subscriber
during the
midnight ( 12:00 am to 5: 00 am) on a single day
Continuous
Total Numbers Called at night
The total
different unique subscribers called during the midnight (12:00 am to 5:00 am) on a single day
Continuous
Total Minutes at night
The total
duration of all calls made by the subscriber in
minutes at
midnight (12:00 am to 5:00 am)
Continuous
Total Incoming Total number of calls received by the subscriber on a single day
Called Numbers to
Total Calls ratio
This is the ratio of the Total
Numbers Called/Total calls
Continuous
Average
Minutes The average is call the duration of each subscriber
Continuous
The choice of features is critical in order to obtain a useful description of the subscriber. According to Table 1, the following features have been selected based on the literature studied on the typical characteristics of SIM BOX fraud subscribers as well as contribution from the experience of the staff who work on telecom fraud for the company obtained from the data.
The data obtained from CDR are not directly used for data mining since it may contain unreliable and noisy data or irrelevant and redundant data. Before the development of the model, the data must undergo the pre-processing process which such as feature extraction, integrating data, handling missing data and also identifying and removing outliners. Then, all the numerical variables have been normalized and compressed to a scale of 0 to 1 to prevent one attribute overly impact the algorithm’s processing power simply because it contains large numbers. Both Neural Network and SVM require attribute to be normalized to this scale. Therefore Min-Max Normalization was applied to the numerical variables
.
B. Development of ANN Model
For the development of ANN model, few parameters settings need to be considered. There are number of hidden layers, number of neurons in each hidden layer, learning rate and the momentum. Different parameter settings were tested until the optimal network architecture is obtained in order to obtain the best ANN model. The number of hidden layers and the number of neurons in each hidden layer have significant influence on the performance of the network (Notton et al., 2013). In this research, the determination of number of hidden neurons is referred to Laurene (1994) which introduced a rule as stated in the following formula.
(12)
(13)
(14)
Where n is the number of neuron in the input layer while h is the number of neurons in the hidden layer. In this research, the number of neurons in input layer is 9; therefore 9, 5 and 18 are the number of nodes in the hidden layer.
To evaluate the models, K-fold Cross-Validation is used to achieve an unbiased estimate of the model performance. In this research, 10-fold cross-validation which is the most common cross-validation technique used for medium sized dataset is applied. Therefore, the dataset was divided into 10
subsets and the model was built 10 times, each time using one out of the subsets for testing and the remaining 9 subsets for training the model. The average error across all the 10 trials is computed. Cross-validation is applied to both SVM and ANN and the models created for each algorithm are compared based on classification accuracy, training duration, precision and recall.
For the ANN development, the nine subsets used for training are combined and network parameters are set. Then random values are assigned to all the weights in the network. The output values are then calculated based on the current weights in the network for each training example. The forward phase finishes with the computation of an error signal. The output errors are calculated, and the back-propagation process calculates the errors for each output and hidden neuron in the network. The weights in the network are updated. Computing of output values are repeated until the termination criteria is met. The termination criteria used in this research is five hundred iterations (epochs) of the network. Once, termination criterion is met, the training stops and the network is tested with the set of data points held-out previously. This is repeated 10 times and finally the average errors for all 10-folds are computed. The performance of the model is recorded and different parameters of the network are changed. This process is repeated for all possible combination of parameter settings which is 240 neural network models were created. The models were evaluated based on their prediction accuracy, generalization error, running time, precision and recall.
From the 240 models that have been developed, the prediction accuracy obtained in ranged from 56.1% to 98.71%. The details of the best model for each hidden nodes as stated in Table 2.
Table 2: Details of best model for each hidden nodes
H I O RMSE Accuracy
(%) Time Precision recall
1 9 2 0.1055 98.675 13.67 0.987 0.987
2 9 2 0.1038 98.7061 17.17 0.987 0.987
3 9 2 0.1086 98.6906 51.44 0.987 0.987
From the Table 2, it can be seen that the model which has two hidden nodes give the highest accuracy which is 98.71%. The model gives RMSE value of 0.1038. So, the selected neural network model contained four layers. The first layer correspond to the input values, two hidden layers each having five hidden nodes and output layer with two nodes which represent the two class: fraud and normal.
C. Development of SVM Model
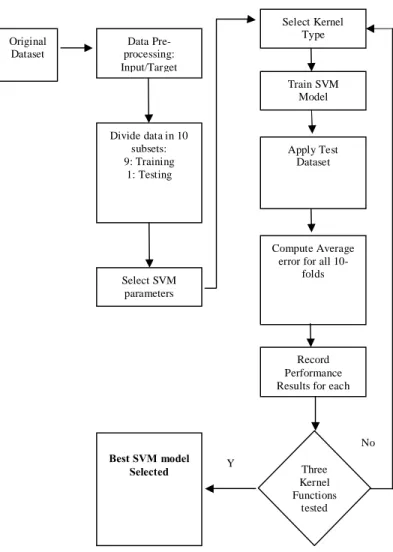
For the development of SVM models, same with ANN models, 10-fold cross validation used for validation of the prediction models. Figure 2 illustrated the implementation of SVM in order to get the SVM model.
the performance of each model is recorded. The process is repeated for all combinations of three kernel functions and 40 SVM models were developed. The models were evaluated in terms of prediction accuracy
, running
time, precision and recall in order to find the best SVM model. Table 3 shows the best model for each kernel functions.Fig. 2: Flow of SVM implementation
Table 3: Details of best model for each kernel functions
Kernel function
Polynomial - Degree
Gamma C RMSE Accuracy Time Precisi on
Recall
Linear/
Polynomial 3 1000 0.1067 98.862 19.71 0.989 0.989
RBF - 0.125 1000 0.1059 98.8776 5.68 0.989 0.989
From Table 3, it can be seen that the model that used RBF as a kernel function gives the highest accuracy than linear and Polynomial, which is 98.9%. The model also gives lower RMSE value which is 0.105. So, the model is selected as the best model for SVM model.
IV.RESULTS AND DISCUSSION
This section discusses the performance results in comparing the SVM and ANN models. A number of evaluations of SVM and ANN models are compared, interpreted and presented. By summarizing the comparison of SVM and ANN models in terms of accuracy, time, and generalization error, the performance results of SVM model for handling the fraud detection is much better than the ANN model. Comparative results on selected SVM and ANN model are provided in Table 4.
Table 4 Comparison of selected SVM and ANN model
Features SVM Best Model ANN Best Model
RMSE 0.105 0.104
Accuracy 98.9% 98.7%
Time 5.68 17.17
From Table 4, it can be seen that SVM model gives better performance compared to ANN. However, cross-validation is the average performance of the models and cannot represent the true performance of the model. To compare the two models, the same parameter settings of the two models were applied with different percentages of training and testing datasets. The dataset have been partitioned into two parts: a training part which is used for training the algorithm and a test part which is used for testing. The percentage of the training and testing was varied in order to study the variations of performance caused by change in the ratio of training to testing partitions of the dataset. For the selection of samples in training and testing portions, the percentage of each class in each portion is preserved. The training and testing portions used contain 10:90, 30:70, 50:50, 70:30 and 90:10.
Then, to compare the classification accuracy of SVM and ANN models, three criteria are chosen which are 1) false negative and false positive rate,
2
) classification accuracy evaluation and 3) model building duration evaluation. In the first comparing evaluation, a comparing between false negative rate and false positive rate for both selected SVM and ANN model was conducted.A. False Negative Rate and False Positive Rate Evaluation
This section evaluates the comparison of ANN and SVM model in terms of false negative and false positive rate. False positive is the number of normal subscribers that are mistakenly classified as fraud and false negative rate is the number of subscribers that are fraud but mistakenly classified as normal subscriber. This comparison is done in order to find which model presents the best performance in terms of identifying the accurate value of normal and fraud subscribers. Table 5 show the confusion matrix of SVM and ANN model.
Original Dataset
Data Pre-processing: Input/Target
Divide data in 10 subsets: 9: Training
1: Testing
Select SVM parameters
Select Kernel Type
Train SVM Model
Apply Test Dataset
Compute Average error for all
10-folds
Record Performance Results for each
Three Kernel Functions
tested
Best SVM model
Selected Ye
Table 5 Confusion matrix of SVM and ANN models
Normal Fraud
SVM ANN SVM ANN
Normal 4269 4269 20 20
Fraud 52 63 2074 2063
In the confusion matrix shown in Table 5, the columns represent the predicted values and rows represent the actual cases. In short, the SVM model was able to correctly classify 2074 out of 2126 fraud subscribers and 4269 out of 4289 normal subscribers. Fraud is the negative target value, false negative count is 52 and false positive count is 20. On the contrary, the confusion matrix of ANN model as presented in Table 5, 2063 out of 2126 fraud subscribers was correctly classify. The ANN model also was able to correctly classify 4269 out of 4289 normal subscribers. Since the fraud is represent the negative target values, so false negative count for ANN model is 63 and false positive count for ANN model is 20. Hence, it can be concluded that SVM model is better than ANN model. Figure 3 shows the comparison of false negative rate of SVM and ANN.
Figure 3 compares the false negative rate of the two models. The false negative rate of SVM and ANN were very close when 10 to 50 percent of the dataset was used for training.
Fig. 3 Comparison of false negative rate of the SVM and ANN
For both models the false negative rates was declining gradually as the training dataset was increased. However, the false negative rate suddenly increased dramatically for ANN model when more than 50% of the dataset was used for training and continued to increase as the percentage ratio is increased. On the other hand, the false negative rate continued to decline when SVM model was used and percentage of training dataset was increased to 70%. From this point, false negative rate again started to increase when the training dataset was increased. The minimum false negative rate that could be achieved by ANN was 2.46 when 10% of the dataset was used for training. On the other hand, SVM was able to achieve 1.42 when 70% of the dataset was used for training. After 50% of training dataset, the ANN model performance was degrading significantly to as high as 8.8. Therefore, SVM
have shown better performance in correctly classifying fraud subscribers. Figure 4 shows the comparison of false positive rate of SVM and ANN.
Figure 4 compares the false positive rate of the two models. The figure shows that the false positive rate decreased steadily to a very low rate when more than 50% of the dataset is used for training. On the other hand, the changes in false positive rate when SVM is used are relatively small as the percentage training data is increased. The figure shows that ANN was able to achieve 0% of false positive rate when 90% of the dataset was used for training the model. On the other hand, the minimum rate achieved by SVM was 0.65 when 10% of the dataset was used for training. This means ANN model have shown better performance in classifying normal subscribers correctly. However, in this research wrong classification of fraud subscribers is more important than wrong classification of normal subscribers. Because subscribers that are detected as fraud can be further investigated to prove that they are really fraud but fraud subscribers that are classified as normal will remain undetected
Fig. 4 Comparison of false positive rate of SVM and ANN
B. Classification Acuuracy Evaluation
A comparison of the classification accuracy for SVM and ANN model was also compared out. Classification accuracy of SVM is compared with ANN model in order to measures the percentage of subscribers that were correctly classified. 10%, 30%, 50%, 70% and 90% of the dataset were used for training the SVM and ANN. Figure 5 shows the comparison of SVM and ANN in terms of classification accuracy.
Fig. 5 Comparison of SVM and ANN classification accuracy
From this point, the performance of the model was degrading and finally when 90% of the dataset was used for training, the model has shown 97.04% classification accuracy. On the other hand, the performance of the SVM model was improving when 10 to 70% of the dataset was used for training the model. The highest classification accuracy achieved by SVM was 99.064% when 70% of the dataset was used for training, which compares the ANN about 0.3789%. The results obtained show that SVM have shown better performance than ANN model in trms of classification accuracy. In a word, SVM shows better performance in fraud detection compared to ANN in terms of classification accuracy.
C.. Model Building Duration Evaluation
For extensive comparison, the building and training duration of SVM and ANN mode was compared in Figure 6. The unit of time here is second.
Fig. 6 Comparison of SVM and ANN model training duration
This evaluation is conducted in order to show effect of sample size to the model since model building duration is the running time of training process
From Figure 6 we can see that SVM takes less time in model training and development. It can be clearly seen that SVM took more than three times less than the time taken by ANN model in building and training the model. For example,
when 70% of the training dataset was used to build the model, it has taken only 5.55 seconds for SVM, while it has taken 16.64 seconds for ANN model. This is more than three times the duration taken by SVM. SVM takes less time in building and training the models also means that SVM requires less computational power compared to ANN.
V.CONCLUSION
This study compares the performance of ANN and SVM to detect SIM cards that are origination from SIM box devised and bypassing the GSM gateway of the telecom provider. The ANN and SVM models were developed and compared to each other. From the experiment, we found that ANN and SVM are able to detect GSM gateway bypass SIM box fraud. The experimental results has shown that SVM has better accuracy compared to ANN. SVM gave 99.06% accuracy while ANN model gave 98.69% accuracy. Therefore SVM approach is more appropriate to used classification model for SIM BOX fraud detection. However, hybridization method between SVM and other computational approach such as particle swarm optimisation (PSO) or genetic algorithm are expected to improve the capability of the developed SVM model.
ACKNOWLEDGMENT
Special appreciative to reviewer(s) for useful advices and comments. The authors greatly acknowledge the Ministry of Higher Education (MOHE) for financial support through the
ERGS vot num:R.J130000.7828.4L107 and Research
Management Centre, UTM for the research support provided for this work.
REFERENCES
[1]. Adjaoute,A. (2013). System and Methods for adaptive identification of source of fraud, U.S Patent, 1-13. [2]. Azgomi, N.L. (2009). A Taxonomy of Frauds and Fraud
Detection Techniques. Proceeding of CISTM 2009 Ghaziabad : India, 256-267.
[3]. Bolton, R.J. & Hand, D.T (2002) Statistical Fraud Detection: A Review, Statistical Science 17,235-249. [4]. Cambridge Advanced Learner’s
Dictionary’,http://dictionary.cambridge.org/us/dictionary /british
[5]. Chiu, N.H., & Guao, Y.Y. (2008). State classification of CBN grinding with support vector machine, Journal of Material Processing Technology, 201, 601-605
[6]. Farvaresh, H. & Sepehri, M.M (2011) A data mining framework for detecting subscription fraud in telecommunication. Engineering Applications of Artificial Intelligence 24.1, 182-194.
[7]. Ganji,V.R. & Mannem,S.N (2012), Credit card fraud detection using anti-k nearest neighbour algorithm, International Journal on Computer Science and Engineering,1035-1039.
International Conference on Technology and Automation, 382-387.
[9]. Krenker, A., Volk, M., Sedlar, U., Bester, J. & Kos,A.. (2009) Bidirectional artificial neural networks for mobile-phone fraud detection. Etri Journal 31.1: 92-94. [10].Lauren, F. (1994). Fundamental of neural networks:
Architectures, algorithms and application.
[11].MacLennan, J (2009). Data Mining With Microsoft SQL Server 2008. Wiley Publishing Inc: Indianapolis. [12].Mark, E.M. & Venkayala, S. (2007). Java Data Mining
Strategy, Standard, and Practice. San Francisco: Diane D.Cerra.
[13].Moudani, W & Chakik, F. (2013). Fraud detection in mobile telecommunication, Lecture Notes on SOftware Engineering, 1,75-79.
[14].Notton, G., Paoli,C., Ivanova, L., Vasileva,S. & Nivet, M.L. (2013). Neural network approach to estimate 10-min solar global irradiation values on tilted planes, Renewable Energy 50, 576-584.
[15].P. Barson, S. Field, N. Davey, G. McAskie & R. Frank (1996). The detection of fraud in mobile phone networks, Neural Network World, 6 (4), . 477–484.
[16].Pandya,S.S (2013). Mobile Fraud Detection, International Journal of IT, Engineering and Applied Sciences Research, 2, 15-18
[17].Radhika, Y. & Shashi, M. (2009) Atmospheric temperature prediction using support vector machines. International Journal of Computing Theory Eng 1,1793– 8201
[18].Suman & Nutan, (2013). Review paper on credit card fraud detetction, International Journal of COmputer Trends and Technology, 4(7), 2206-2215.
[19].Taniguchi, M., Haft, M.,Hollmen, J. & Tresp, V. Fraud Detection in Communications Networks Using Neural and Probabilistic Methods. Proceeding of the 1998 IEEE Internationa conference on Acoustics Speech and Signal Processing: IEEE, 1998.1241-1244.
[20].Telenor, G.S., Global SIM Box Detection. 2010.
[21].Vapnik, V. (1995). The Nature of Statistical Learning Theory. Springer, New York.
[22].Wei, W. Li, J., Cao,L., Ou, Y & Chen, J. (2013). Effective detection of sophisticated online banking fraud on extremely imbalanced data, World Wide Web 16,449–475.
[23].Zou,K., Sum,W., Yu,H., & Liu,F. (2012). ID3 decision tree in fraud detection application, International Conference on Computer Science and Electronics Engineering, 399-402.
[24].Sahin, Y., Bulkan, S. & Duman, E. (2013). A cost-sensitive decision tree approach for fraud detection Expert System with Application 40, 5916-5923.
[25].Jha, S., Guiilen, M., & Westland, J.C. (2012). Employing transaction aggregation strategy to detect credit card fraud, Expert System with Application 39, 12650-12657.