Managing Data for Intel’s Enterprise
Private Cloud Infrastructure
IT Best Practices
Cloud Computing and Business Intelligence July 2012
By improving the speed and
quality of decision making,
our data management efforts
are increasing Intel’s business
velocity and providing a
competitive advantage to the
entire enterprise.
Sameer Adhikari
Enterprise Architect, Intel IT
Todd Barker
Data Architect, Intel IT
Asoka Diggs
Enterprise Architect, Intel IT
Joshua Jin
BI Technical Development Lead, Intel IT
Executive Overview
In support of Intel’s enterprise private cloud, Intel IT has developed a business intelligence (BI) system for infrastructure management. This system collects, consolidates, and integrates infrastructure capacity and performance data about our IT environment, which includes virtual machines, physical servers, operating systems and applications, and storage area networks.
Applying data management techniques to IT infrastructure and business processes supports business value in the following ways: • Competitive advantage. Data management
can improve internal organizational efficiency, which leads to greater agility. • Improved effectiveness. Analysts have
faster access to data, increasing the velocity of decision making.
• Better data quality. Data management results in high-quality data characterized by integration, accessibility, completeness, timeliness, and the elimination of duplicate data.
Our BI system for infrastructure management is creating significant IT efficiency and business value for Intel’s enterprise private cloud and has enabled both quantitative and qualitative results:
• Intel has saved USD 9 million to date by implementing an enterprise private cloud
strategy, with anticipated USD 14 million net present value over the next four years. These savings are primarily from server consolidation through virtualization and ensuing savings in software licenses and facilities.
• We have reduced the time it takes to provision a new virtual server from two weeks to 45 minutes.
• We have achieved storage optimization savings of USD 9.2 million in 2011. These savings result from using a variety of techniques such as tiering, thin provisioning, and de-duplication.
• We can easily pinpoint devices that are misconfigured and track the trends of various performance metrics over time. By improving the speed and quality of decision making, our data management efforts are increasing Intel’s business velocity and providing a competitive advantage to the entire enterprise.
Contents
Executive Overview ...1
Background ...2
Business Intelligence for Infrastructure Management ...2
Data Sources ...3
Transforming Data into Information ...4
Key Learnings about Infrastructure Data Management ....6
Results and Benefits ...7
Quantitative Results ...7 Qualitative Results ...8 Sample Reports ...9 Conclusion ...10 Related Reading ...10 Acronyms ...10
IT@InTEl
The IT@Intel program connects IT professionals around the world with their peers inside our organization – sharing lessons learned, methods and strategies. Our goal is simple: Share Intel IT best practices that create business value and make IT a competitive advantage. Visit us today at www.intel.com/IT or contact your local Intel representative if you’d like to learn more.
BaCkgrOund
IT organizations can benefit from applying IT methods, standards, and disciplines to their own business processes—something that doesn’t typically occur. In particular, Intel IT uses data management to understand and support the infrastructure that powers Intel’s enterprise private cloud. applying data management practices to IT data provides business value and competitive advantage by enabling data-driven decision making.
Intel IT manages and is responsible for the outcome of more than 30 business processes. These processes are not simply IT processes; they affect the health and success of the entire enterprise. For example, IT is the organization that executes the capacity management process for the hardware infrastructure. But the results of managing this process are important to all of Intel. By applying data management techniques to IT infrastructure data we enable business intelligence (BI) applied to that data. BI, in turn, enables informed decision making and provides business value. For example, Intel’s enterprise private cloud initiative depends heavily on our data management efforts; but in the absence of other efforts, such as reporting, BI analytics, and improvements to business processes and infrastructure, data management by itself brings little value. Data management supports business value three ways:
• Creates a competitive advantage. We improve internal efficiency, which leads to greater agility. For example, we can now provision a virtual machine (VM) in 45 minutes. Our Infrastructure Management Operational Data Store (iMODS), which contains up-to-date capacity information, enables us to quickly determine the capacity
of all virtual resources in Intel’s data centers worldwide, at any given moment.
• Improves effectiveness. Analysts have faster access to data, increasing decision making velocity. Also, analysts spend more time performing analysis rather than collecting data.
• Creates better data quality. Proactively managing infrastructure data results in universally accessible, complete, timely, and transparent data. For example, we can use the data we collect to find servers and storage frames that are configured incorrectly.
Our goal was to create an integrated collection of IT infrastructure capacity and performance data that better supports our enterprise private cloud. The integrated data include data for VMs, servers, OSs, applications, and the SAN.
This paper describes how we provide data management for Intel’s private cloud infrastructure.
BusInEss InTEllIgEnCE
fOr InfrasTruCTurE
ManagEMEnT
for the last two years, we have been building a BI system for infrastructure management that integrates data about cloud infrastructure, with the goal of improving IT operational efficiency and the efficiency of Intel’s enterprise private cloud.
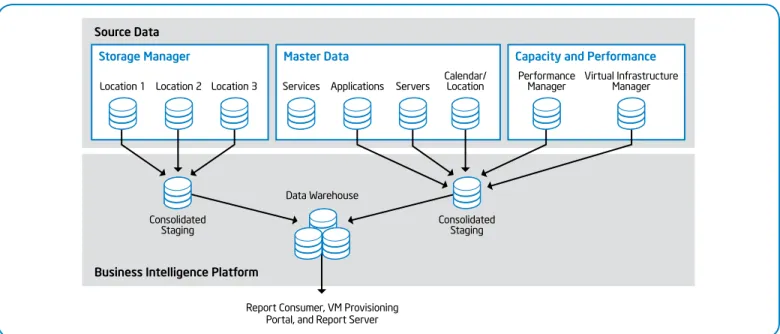
We began by focusing on VM capacity data. We have expanded the system to include the entire IT environment, including VM performance data, OS performance counters, and SAN capacity and performance data. Figure 1 shows all of our data sources.
We collect both capacity and performance data, because we have discovered that effective capacity management is impossible without performance data. For example, although a SAN may have available storage space, I/O constraints may make this storage unavailable. Our BI system for infrastructure management is in production and is providing significant business value. Teams managing the IT environment have a single location where they can obtain data with applicable business rules applied to the data. Figure 2 provides an example of how we track application performance. This enables us to predict problems before they lead to an outage or quickly fix them when they arise. We also have a view of performance data based on business groups, allowing us to see how different business groups are using infrastructure resources.
data sources
We integrate and centralize data from different data sources. But regardless of the source, our metrics share common
dimensions, which enable drill-across BI—that is, comparisons across all data sources—in addition to the more typical drill-down and drill-up BI activities.
Our three main data sources are as follows: • Virtual infrastructure manager.
Provides metrics on virtual servers and the physical hosts for the virtual servers. This information directly supports Intel’s enterprise private cloud because it uses virtualization to deliver infrastructure as a service (IaaS).
• Performance manager. Provides metrics on physical servers that are not part of the cloud infrastructure. This information is related to the OS performance (Microsoft Windows*).
• Storage manager. Provides metrics on the SAN. This information includes how the space is partitioned into allocable pieces, how the servers—both physical and virtual— utilize that space, and the performance characteristics of the storage frames.
Master Data
Storage Manager Capacity and Performance
Consolidated Staging
Data Warehouse
Report Consumer, VM Provisioning Portal, and Report Server
Consolidated Staging
Business Intelligence Platform Source Data
Services Applications Servers Calendar/Location
Location 1 Location 2 Location 3 PerformanceManager Virtual InfrastructureManager
Figure 1. Our business intelligence system for infrastructure management is focused on infrastructure performance and capacity.
Low Utilization Medium Utilization High Utilization 0 20 40 60 80 100% 22% 38% 89% 43% 100% 51% 36% 49% 81% CPU Memory Storage Application 1 CPU Memory Storage Application 2 CPU Memory Storage Application 3 Utilization
Figure 2. Our integrated data can alert us to CPU, memory, and storage utilization issues on a per-application basis.
Typically only supplier applications can utilize the data from these sources, because there is a semantic gap between supplier product terminology and Intel business terminology. Because we own the Intel data residing in the local product instance, we have devised solutions to extract the data and merge it with other sources—transforming data into information.
We cast the data in terms of Intel business terminology and usage for our internal customers. For example, “used space” has different meanings at different levels of the storage hierarchy. The “used space” reported by the virtual infrastructure manager is different from the “used space” reported by the storage manager. Each report provides an incomplete mapping of storage to VMs that are using the storage. We merge the data from both sources and apply a proprietary algorithm to determine how the storage reported at the virtual manager layer maps to the storage reported at the storage manager layer. Additional data sources include the following: • We obtain a list of servers and the
individuals responsible for each server from our Servers Master Data database. • We use enterprise master calendar and
location data to classify the location of the servers and the time of data collection. • We use the enterprise master list of
applications, which stores application-server mappings.
Transforming data into
Information
Each time we acquire a new data source, we analyze how it connects with the data we already have. This enables us to
compare information across data sources and enables business insights not possible from isolated silos of information. We use three techniques to transform raw data into information: consolidation, integration, and calculated metrics.
COnsOlIdaTIng daTa
To provide a unified, global view of our infrastructure data, we consolidate multiple instances that are structurally identical into a single collection of data, thereby enhancing the consistency and quality of the data. This consolidation step is typically performed in the raw data layer.
To implement the consolidation, we defined source instance identifiers that keep the source data separate in the raw data layer but are not visible in the reporting layer. The source instance identifiers help to uniquely identify entities that come from separate structurally identical sources that have the same names at the source. For example, multiple virtual machine managers can have VMs that have the same numeric identifier in their source systems. We must ensure that we do not mix the metrics data for those VMs in the reporting layer.
Data consolidation provides benefit to both IT and business users.
• Previously, such consolidation was possible only through significant manual effort. By consolidating data into a single location, we can more easily discover inconsistencies in infrastructure configuration and in the data.
• Business users can obtain an integrated, global view of the environment, and analysts can focus on analysis rather than data collection, leading to increased agility.
Business Intelligence (BI) at
Work: Consolidation
Geographically based virtual machine instances provide an example of how consolidation provides significant business value. Our virtual infrastructure data is distributed geographically; there are separate instances such as in the Americas and in Europe.
Pre-BI: Prior to the development of our BI system, analysts had to look in multiple locations to obtain a global view. This meant individually connecting to each virtual manager and manually collecting information. With about 20 virtual managers, this process was tedious and expensive. As a result, the global view of virtual resources was updated once a week. Capacity decisions made during that week were based on possibly out-of-date reports.
Post-BI: With the consolidated view of the virtual infrastructure resources, we automatically, inexpensively, and quickly update the data every two hours— providing better quality data for timely business decisions.
InTEgraTIng dIsParaTE daTa
Disparate data is data that is conceptually the same but comes from different sources and is different in structure. Disparate data raised a significant data integration challenge. To maintain an accurate and complete reporting layer, we needed to integrate the disparate data by applying consistent rules.
Integration allows analysis across data sets without the need for manual integration of the data, enables new forms of analysis, and allows analysts to quickly respond to business questions.
storage Metrics
We experienced several integration issues during the implementation of storage capacity and performance metrics, including different suppliers using the same terminology in different ways; the same supplier using two different terms interchangeably, and the same term having different meanings at different levels of the storage hierarchy.
The following storage terms were particularly problematic: provision, allocation, subscription, capacity, free, and used. For example, if we provision 1 terabyte (TB) on a frame that does not support over-provisioning, the frame immediately reports 1 TB less free space.
However, if we provision 1 TB on a frame that does support over-provisioning, the frame reports the same amount of free space before and after provisioning—the free space value doesn’t change until files are written. We needed a way to refer to storage that worked regardless of supplier or technology, and we also needed to be able to measure storage regardless of the source terminology and meaning. The challenge was to mesh our business view of storage with the data source view.
We built a logical data model of storage consistent with Intel’s business view and terminology to ensure agreement on terms and meanings. We then used the logical data model to map physical reality to our business terms. We used business rules to handle the inconsistencies between Intel terminology (logical model) and the supplier’s product implementation (physical model).
Figure 3, which shows the storage capacity data for four storage frames, provides an example of how a logical data model can result in actionable information. By analyzing the storage capacity data, we can determine the frame with the most headroom, which in this case is frame 1.
Business Intelligence
(BI) at Work: Integration
An example where integration provides business value is in support of our SAN planners. These analysts examine
consumption and make predictions about future storage requirements.
Pre-BI: Prior to the development of our BI system for infrastructure management, SAN planners had to periodically capture their own data manually for each storage frame. There was no integration between the storage data and the virtual infrastructure data.
Post-BI: Now SAN planners have a global, integrated view of storage data with daily values. All the data is available, so they can move very quickly to data analysis, instead of having to spend days collecting data before starting analysis. Further, this capacity data is integrated with the frame performance and the drive utilization data at the server level. Thus, storage planners can decide in advance whether to purchase new storage or to move a tenant from one storage element to another. Also, analysts can consider multiple factors. Even when parts of the storage system are underutilized, there may be application location requirements or storage frame performance constraints that prevent using the extra capacity. Ter ab ytes 0 1,600 3,200 4,800 6,400 8,000 Frame 4 6 Drives Frame 3 33 Drives Frame 2 289 Drives Frame 1 345 Drives
Sum of Subscription Headroom Sum of Total Subscribed Sum of Total Used Sum of Usable
Sum of Raw Physical Capacity
Operating system Metrics
While integrating our OS metrics, we discovered that measurement context is critical. We collect performance counters for the VMs from both the OS running on the VMs and the virtual infrastructure manager. These two data sources have similarly named performance counters for CPU, memory, disk, and network. While the counters’ labels are the same, their definitions and measurement techniques diverge, so they are not comparable. Therefore, we use the OS metrics from the performance manager to help us respond to some business questions and the virtual infrastructure manager metrics to help us respond to others.
CalCulaTEd METrICs
Our data includes data collected directly from the IT environment and metrics calculated from the direct data. The calculated metrics include many business rules, and our goal is to ensure consistent results during the use of these metrics. Therefore, we centralize these calculated metrics in the BI system. As business users create new business rules, we add them to our BI system.
key learnings about
Infrastructure data
Management
Infrastructure management data has some unusual properties, compared to the
typical types of data contained in data management systems.
• Server identification. Almost all the data in our system relates to servers in one way or another. Therefore, it is important to consistently and accurately identify servers. • Application and services. Grouping metrics by application and services provides a way to look at the data, but it can introduce inaccuracies when multiple application or services share a group of servers. • Snapshot data and history. Typically
BI systems record business events and transactions. But the bulk of our data is a snapshot of an environment.
usIng sErvEr IdEnTITy as a dynaMIC PrIMary kEy
To uniquely and consistently identify servers, we needed a common form of identification that would be usable for all the data sources (storage manager, performance manager, and virtual infrastructure manager). We wanted to create a single master list to compare, link, and reconcile server-related information from many sources.
We first considered using the serial number as the server identifier, but then decided against this approach. If a physical server name was kept and hardware changed for an upgrade, we would not be able to tie the server metrics together before and after the
Business Intelligence (BI) at
Work: Calculated Metrics
An example where calculated metrics can provide real, immediate business value is better management of virtualized infrastructure.
Pre-BI: Prior to the development of our BI system for infrastructure management, we didn’t have a way to determine what level of over-subscription was possible on virtual disk containers at the virtualization layer and to track how the usage differed for those virtual disks over time in each of the containers.
Post-BI: Now, based on actual file usage data from the storage manager and virtual disk container data from the virtual infrastructure manager, we can calculate dynamic over-subscription targets for each virtual disk container. We can also use business rules to determine whether a container is open for over-subscription, closed, or should be rebalanced by moving virtual disks to another container.
change. Also, VM serial numbers change. We decided to use a fully qualified domain name (FQDN), which is the server’s short name combined with its domain name. The short name alone is insufficient, because the same short name can exist in several domains. However, using FQDNs as the primary key for server identity introduced challenges. Typically, a primary key should not change and should have a consistent form. But, about 10 percent of our servers do not have a domain name, and sometimes domain names change.
We also needed to define business rules that address what constitutes a new server. For example, if a server named abc.intel.com changes to abc.corp.intel.com, it is difficult to determine if this is a new server or simply a domain change. Business logic based on other attributes can help with this determination, but there is a cost-benefit trade-off. We decided to accept some ambiguity because server- and domain-name changes affect a relatively small percentage of our server population.
gaThErIng aPPlICaTIOn and sErvICEs METrICs
The capacity and performance metrics generated by our source systems and captured in the BI system reflect a server view of the data, not the business view of application and services. The business view is seen indirectly through server metrics, which has value but is incomplete. The primary challenge associated with application metrics is that applications and servers are typically in a many-to-many relationship. It is inaccurate to double-count
metrics or to proportionally distribute metrics. For example, If 10 applications are on a server with 100 gigabytes (GB) of used storage, it is inaccurate to report that each application is using 100 GB or that each application is using 10 GB.
Currently we choose to show all applications using 100 GB, because we have observed that as we convert physical servers to VMs on the cloud, servers tend to support a single application, while each application runs on many servers. In this scenario, our approach to application metrics is valid. As virtualization becomes pervasive, the number of scenarios with application-sharing servers decreases.
dEalIng WITh snaPshOT daTa and TIME sTaMPs
Whereas most BI systems record transactions or business events, our BI system for infrastructure management records snapshots of the environment. For example, we measure how much free storage space there is today, as opposed to measuring the free space every time a file is uploaded. We also record and retain the different time-stamped measurements to create a metric history. However, some metrics, such as the size of a logical unit number (LUN), which is the allocatable storage unit at the SAN frame level, don’t have a time stamp in the source. This presents a challenge in building a history for the metric. We use the time when we extract, transform, and load the data as a proxy for the measurement time for these metrics. This makes the data consistent and easy to associate with other information that has time stamps from the source systems.
rEsulTs and BEnEfITs
We began our infrastructure management BI efforts by focusing on virtualization and storage capacity data. We now include performance metrics as well. The reports generated by our system enable us to answer real business questions.
For example, suppose a business group needs more storage. Simply reporting which frames have free space is insufficient. When we add performance data to the capacity data, we can determine that some frames may have the necessary space, but performance metrics may show that I/O is a bottleneck on some of these—preventing useful utilization of storage. If we view only capacity data, we might decide to allocate new storage to the frame that is performance constrained, which will negatively impact the business.
Quantitative results
Data management by itself creates little or no direct business value. But data management enables programs that create business value by converting data into useful and actionable information. Intel’s enterprise cloud initiative is an example; the overall measurable benefits would have been impossible to achieve without our data management efforts.
• Saved USD 9 million to date by implementing an enterprise private cloud strategy, with anticipated USD 14 million net present value over the next four years. These results are dependent on our data repository that provides capacity and performance data.
• Reduced—from two weeks to 45 minutes— the time it takes to provision a new virtual server, by improving business processes and using our data repository in the automated solution.
• Achieved storage savings of USD 9.2 million in 2011, through use of our repository of storage capacity data. Using this data, we can employ storage optimization techniques such as tiering and thin provisioning and can use trend information to prevent outages. • Reduced—from one week to two hours—
the time it takes operations to obtain a global view of the number of VMs running in the different virtualization clusters throughout the company.
Qualitative results
Many of the benefits stemming from our BI system for infrastructure management are more qualitative than quantitative. For example, analysts can now focus on analyzing the data instead of investing manual effort in gathering the data. It is possible to quantify the effort reduction but we have deliberately chosen not to. Other qualitative results include an improved IT environment, increased data transparency, and increased business velocity.
IMPrOvEd QualITy Of IT EnvIrOnMEnT
With our BI system for infrastructure management, analysts can more easily identify the misconfiguration of devices. To do so, they can compare firmware versions and configuration parameters against a set
of approved values. In our large environment, which consists of approximately 100 SAN frames and 600 hosts, this process is virtually impossible to conduct in a systematic fashion with a manual approach.
Another benefit is that the IT operations team is able to track the trends of various performance metrics over time and anticipate problems. If a set of hosts is showing a gradual increase in memory utilization, the team can either add new hosts or add memory to the hosts.
We have recently begun collecting data in order to characterize and create a baseline of the performance workloads for the storage frames. This will enable storage planners to identify opportunities for improving frame performance. Based on the data so far, poor performance on some frames has been attributed to read/write overloading of some LUNs and other sub-optimal configurations.
InCrEasEd daTa QualITy, TransParEnCy, and dEMOCraTIzaTIOn
Our system improves the quality of the master data. We track a server only if at least one of the performance, virtualization, or storage managers provides data about the server. So, if a server is listed in the master data, our system is able to accurately tell if the server is active. This type of descriptive analytics generates real business value that is readily accessible.
Prior to the development of our BI system, access to most data from servers and
storage frames was restricted to a few system administrators. Now, data is available company-wide. A user need only apply for privileges through the company access management system, which helps determine business need; this frees the users from requiring physical system access for data.
InCrEasEd vElOCITy
The BI system increases decision throughput. For example, storage analysts used to get a capacity report every six months. As we improved the system, we reduced the time between reports—first to three months, and finally to daily reports.
Also, the BI system for infrastructure management enhances the ability of the operations team to troubleshoot issues by providing performance metrics. When a VM running in the cloud experiences performance degradation, our BI system quickly provides data from the VM manager and storage manager—all tied to the server and all in one place—allowing faster analysis and easier issue resolution.
Capacity planners can use the iMODS to track the growth in the number of VMs and their associated storage needs over time. Prior to the availability of our data, capacity planners interacted with various business groups to obtain demand information and then had to manually transform that information into a capacity plan. Now, capacity planners can use our data to personally observe the change in VM numbers and forecast future demand.
sample reports
This section provides excerpts from sample reports, illustrating how the BI system for infrastructure management integrates data from different sources, resulting in useful, actionable output.
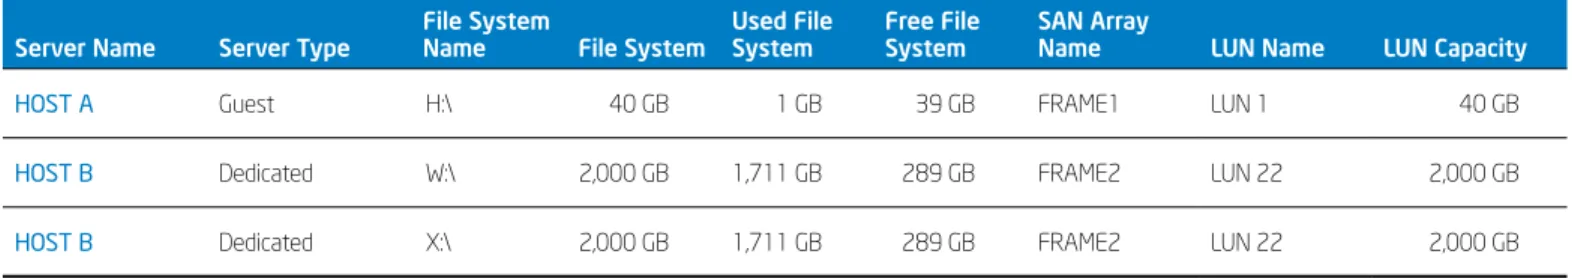
lOgICal fIlE sysTEM TO san lun MaP
Table 1 shows for each server whether it is a virtual (guest) server or physical (dedicated), its logical file system name (drive letter), its capacity (size, used, free), and the SAN that hosts the file system (SAN name, LUN name).
The operations team can use the report to easily determine which storage frame and LUN to modify when a user reports running out of file system space and requests an expansion. When the operations team wants to make changes to the SAN environment, they can easily determine which business groups will be affected and notify them of impending changes.
ClOud CaPaCITy
Table 2 gives the overall capacity of Intel’s enterprise private cloud. For each data center,
the report lists clusters and the count of physical hosts. The Cluster Guests column lists the virtual servers that are possible in the cluster (the sum of all allocated and available). When a business group requests a new VM through a self-service web portal, the automated workflow behind the portal uses the capacity data in this report to show the user the available choices for allocating VMs in different data center, cluster, and network combinations.
Table 1. Sample Report: Mapping the Logical File System to SAN Logical Unit Number (LUN) Elements
server name server Type file system name file system used file system free file system san array name lun name lun Capacity
HOST A Guest H:\ 40 GB 1 GB 39 GB FRAME1 LUN 1 40 GB
HOST B Dedicated W:\ 2,000 GB 1,711 GB 289 GB FRAME2 LUN 22 2,000 GB HOST B Dedicated X:\ 2,000 GB 1,711 GB 289 GB FRAME2 LUN 22 2,000 GB GB - gigabyte
Table 2. Sample Report: Overall Capacity of Intel’s Private Cloud
data Center Cluster network Cluster hosts Cluster guests small sku available small sku allocated Medium sku available Medium sku allocated
DC1 Cluster 1 GPB 13 340 226 0 67 0
DC1 Cluster 2 GPB 12 252 139 32 64 16
DC2 Cluster 3 GPB 13 340 226 0 67 0
This paper is for informational purposes only. THIS DOCUMENT IS PROVIDED “AS IS” WITH NO WARRANTIES WHATSOEVER, INCLUDING ANY WARRANTY OF MERCHANTABILITY, NONINFRINGEMENT, FITNESS FOR ANY PARTICULAR PURPOSE, OR ANY WARRANTY OTHERWISE ARISING OUT OF ANY PROPOSAL, SPECIFICATION OR SAMPLE. Intel disclaims all liability, including liability for infringement of any patent, copyright, or other intellectual property rights, relating to use of information in this specification. No license, express or implied, by estoppel or otherwise, to any intellectual property rights is granted herein.
Intel and the Intel logo are trademarks of Intel Corporation in the U.S. and other countries. * Other names and brands may be claimed as the property of others.
for more information on Intel IT best practices,
visit
www.intel.com/it
.
not focus on data management practices for its own data, we have learned, through the case of Intel’s private cloud, that applying data management techniques to IT infrastructure and business processes can provide valuable support and a competitive advantage to the entire enterprise.
Our BI system for infrastructure management collects infrastructure capacity and
performance data about our IT environment, including VMs, servers, OSs and applications, and SAN, and is an integral component of Intel’s enterprise private cloud initiative. Our efforts have provided the foundation for measurable results, such as:
• USD 9 million savings to date by implementing an enterprise private cloud strategy, with anticipated USD 14 million net present value over the next four years, primarily from server consolidation through virtualization
• Server provisioning improvements, such as reducing the time it takes to provision a new virtual server from two weeks to 45 minutes
• Storage optimization savings of USD 9.2 million in 2011, through the use of storage optimization techniques
data quality and transparency; and increased business velocity by enabling faster analysis of capacity and performance metrics. More than just a data repository, the BI system transforms data into information by consolidating and integrating disparate sources of data to provide a holistic view of the entire IT environment—increasing the speed and quality of decision making and providing a competitive advantage to the entire enterprise.
rElaTEd rEadIng
visit www.intel.com/it to find white papers on related topics.
• “ Best Practices for Building an Enterprise Private Cloud” • “ Implementing Cloud Storage
Metrics to Improve IT Efficiency and Capacity Management” • “ Solving Health IT Data Storage
Growth Challenges” • “ 2011-2012 Intel IT Annual
Performance Report”
FQDN fully qualified domain name
GB gigabyte
iMODS Infrastructure Management Operational Data Store
LUN logical unit number
TB terabyte