Sharif University of Technology
Scientia IranicaTransactions A: Civil Engineering www.scientiairanica.com
Research Note
Numerical simulation of turbulent ow over labyrinth
spillways/weirs and corresponding discharge coecient
and eciency
V. Zahraeifard
and N. Talebbeydokhti
Department of Civil & Environmental Engineering, Shiraz University, Namazi Sq., Zand Ave., Shiraz, Iran. Received 29 May 2013; received in revised form 2 November 2014; accepted 26 May 2015
KEYWORDS Labyrinth spillway; Discharge coecient; Computational uid dynamics;
Turbulence; Free-surface; Fluent.
Abstract. Labyrinth spillway has become an appropriate choice to increase an existing spillway's capacity. Thus, it is necessary to understand the hydraulic performance of labyrinth spillways/weirs. This paper numerically solves turbulent ow over labyrinth spillways/weirs and determines the discharge coecients. Reynolds governing equations, turbulence k " model, and the Volume Of Fluid (VOF) model are numerically solved to dene pressure, velocity, and the free surface ow proles. The numerical results are comparable to those obtained from physical modeling with maximum 6.43% error relative to results of physical modeling. Present study indicates that numerical simulation can be used to supplement physical modeling. Thus, by using numerical solutions, the site specics of the spillway which are often dierent from the conditions of design curves can be investigated. Also, the eect of dierent shapes of apex on discharge capacity of the labyrinth spillway is investigated in this study. The analyses show that labyrinth spillways with round apex shape are the most ecient spillways. Numerical determination of free water surface is presented and discussed, which is helpful for optimum design of stilling basin and leading walls.
c
2015 Sharif University of Technology. All rights reserved.
1. Introduction
A vital component of the dam's design is the spillway. Spillways are hydraulically designed to pass exces-sive water that cannot be contained in the allotted storage space. Many dam failures have been caused by improperly designated spillways or by spillways of insucient capacity [1]. In this regard, discharge coef-cient of the spillway is the most important parameter, which is dependent on water head over crest, crest shape, and crest length. Improvements in the elds
*. Corresponding author. Tel.: +98 71 36287505; Fax: +98 71 36286619
E-mail addresses: [email protected] (V. Zahraeifard); [email protected] (N. Talebbeydokhti)
of meteorology and hydrology have gained attention among researchers and engineers to re-evaluate the performance of spillways as it is directly aected by updated hydrological data [2]. In fact, a reliable ood passage capacity of the spillway is crucial. If an existing spillway has inadequate capacity to pass the maximum design ood, there are three alternatives for remedy: 1) Increase the volume of dam storage; 2) Increase the spillway's capacity; and 3) A combination of these two options [2]. The main concern with the second alternative is accessible space to widen the spillway's length. This concern can be resolved technically and economically by using labyrinth spillways. Several physical studies have been conducted on labyrinth spill-ways/weirs. Hay and Taylor (1970) evaluated various performance modes of labyrinth weirs, the eect of
bottom canal slope on overow capacity of labyrinth weirs, and the inuence of water head over the weir's crest [3]. Their study provides performance curves (design curves) under dierent conditions. Darvas (1971) provided a denition for the discharge coecient of labyrinth spillways [4]. Houston and Hinchli (1982) summarized the results of physical modeling of labyrinth spillways for Hyrum dam by the U.S. Bureau of Reclamation (USBR) [5]. In 1985, Cassidy et al. examined the performance of labyrinth spillways for high water head and found a 20% reduction in eciency of the labyrinth spillways [6]. Lux and Hinchli (1985) accomplished dimensional analysis to get discharge coecient of labyrinth spillways and presented design curves [2]. Magalh~aes and Lorena (1989) introduced a formulation for determination of discharge coecient along with design curves [7]. Finally, Tullis et al. (1995) conducted a comprehensive study to evaluate the discharge coecient, eect of water head, and angle of side walls (Figure 1) [8]. They introduced their de-sign curves. Lopes et al. (2008) studied ow conditions downstream of labyrinth spillway in laboratory [9]. Khode and Tembhurkar (2010) conducted extensive physical modeling of labyrinth spillways [10] to evaluate design method introduced by Lux (1984) [11] and Tullis et al. (1995) [8]. Crookston (2010) conducted laboratory experiments to get discharge coecients for quarter-round and half-round labyrinth weir with side angle between 6 to 35 [12]. Although several
performance curves have been proposed for labyrinth spillways that can be used in new projects, these curves usually consider ideal conditions; e.g. assuming the approaching ow is perpendicular to the spillway [13]. In addition, the site specics of spillways vary from idealized condition so that design curves are no longer applicable [13]. In other words, disturbing the ideal conditions of design curves disqualies the validation of them. Furthermore, conducting physical studies for new projects by considering site-specics is not
eco-nomically feasible [14] and is time consuming as well. In recent years, advancements in computing power and Computational Fluid Dynamics (CFD) algorithms have resulted in evolving new tools for evaluation of dierent ow conditions and dierent design alterna-tives [15]. Savage et al. (2004) and Danish Hydraulic Institute (DHI) (2005) presented numerical simulation of ows past labyrinth spillways [15,16]. However, these studies were conned to specic projects without considering the eect of apex shape.
The objective of this study is to numerically study ows over labyrinth spillways/weirs using the Reynolds Averaged Navier-Stokes equations. Due to turbulent ow, the RNG k " model is used. In addition, a two-phase ow (water and air) is considered over the labyrinth spillway which is important to dene variation of free-surface. Thus, the robust Volume Of Fluid (VOF) method was used to determine the location and orientation of the interface between the water and air (free-surface). The specic objective of present study is to evaluate the eect of the apex shape on discharge capacity of labyrinth spillways.
2. Materials and methods 2.1. Labyrinth spillways/weirs
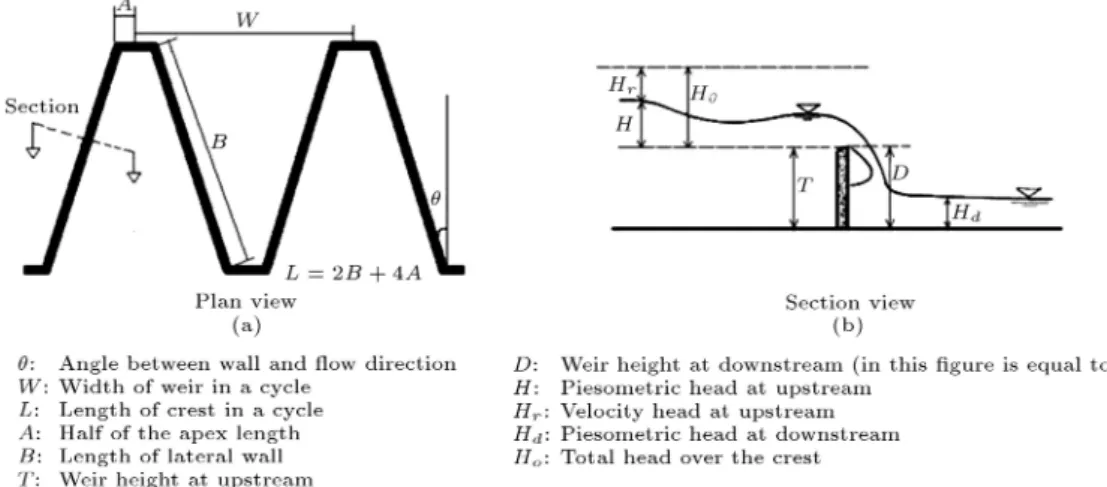
As stated by Hay and Taylor (1970), a labyrinth weir is characterized by broken axis in plan so that the water ow is over a greater length of crest compared to a normal weir occupying the same lateral space [3]. Figure 1 shows a sketch of labyrinth spillway/weir, related parameters, and section view of ow over the labyrinth weir/spillway.
2.2. Governing equations
The governing equations of ow over wires are the well-known Navier-Stokes equations; one continuity equation and three momentum equations for the three coordinate directions. By including the eect of
tur-Figure 1. Labyrinth weir and the corresponding parameters: (a) Plan view; and (b) section view of ow over labyrinth weir.
bulence, the equations change to Reynolds equations as [17,18]:
Continuity equation: @Ui
@xi = 0; (1)
Momentum equation: @Ui @t + @ @xj
UjUi+u0ju0i
= @P
@xi+
@
@xj(2Sji); (2)
in which Ui is average velocity in (i) direction; P
is pressure; is molecular viscosity; is density; sji is strain-rate tensor; and u0ju0i is Time-averaged
momentum due to turbulence which is called Reynolds stresses. u0
iu0j has nine components [17]:
u0 iu0j =
2 6 4
(u0
12) u01u02 u01u03
u0
2u01 (u022) u02u03
u0
3u01 u03u02 (u032)
3 7
5 : (3)
These unknowns due to turbulence are determined by using turbulence models. These models consist of semi-empirical equations which relate the uctuating components of quantities to the average components. The most popular turbulence model is k " model. The RNG scheme of this model was used to solve Reynolds stresses.
2.3. Volume Of Fluid (VOF) approach
This method was introduced rst by Hirt and Nichols in 1981 [19]. The fundamental concept of this method for multi-phase ow is to determine the fraction of computational cells occupied by each uid and to determine where the interface between uids occurs. The location of the interface is calculated on the basis of the following equations [18,20]:
@w
@t + ui @w
@xi = 0; (4)
a = 1 w; (5)
in which w and a are, respectively, the fractions
of water and air within a cell. The above equations are for a two-phase ow which consists of water and air; the subscript \w" refers to water and \a" refers to air. Eq. (5) indicates that the summation of all fractions equals unity. In fact, calculating w and
a in all cells provides information about the location
of interface. The momentum equation for this two-phase ow is like that of a single ow expressed by Navier- Stokes equations. However, (density) and (molecular viscosity) should be modied due to the variations of each uid fraction. Thus, we have:
= ww+ (1 w)a: (6)
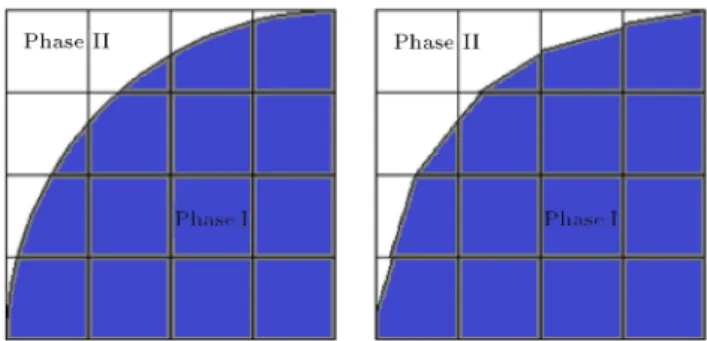
Figure 2. Interface formation between two phases of uid: (a) Actual interface; and (b) interface predicted by using geometric reconstruction scheme. Re-produced based on work of Tang et al. [21].
= ww+ (1 w)a; (7)
in which a and w are density of air and water,
while a and w are the molecular viscosity of air
and water, respectively. To determine the orientation of the interface between the uids, several algorithms have been introduced. The most accurate one is called the Geometric Reconstruction Scheme which consists of two steps: 1- Reconstruction 2- Convection. The main goal of this reconstruction algorithm is to clarify the orientation of segments in each computational cell. This is done by determination of normal unit vector of each segment within a cell. w in neighboring cells
of cell (ij) are used to get normal unit vectors. Then, the angle between positive direction of x-axis and the interface of uids can be dened (). Figure 2 shows schematically how accurate the Geometric Reconstruc-tion Scheme predicts the orientaReconstruc-tion of the interface in the bulk of a two-phase ow [21]. Therefore, free water surface can be predicted for ow over labyrinth spillway. 8 > > > > > > > > > > < > > > > > > > > > > : nx ij =x1
wi+1j+1+ 2wi+1j+ wi+1j 1
wi 1j+1 2wi 1j wi 1j 1
nyij = 1 y
wi+1j+1+ 2wij+1+ wi 1j+1
wi+1j 1 2wij 1 wi 1j 1
(8)
= tan 1 nx
ny
: (9)
Thus, by VOF, the movement of the interface is appropriately modeled.
2.4. Numerical solution
Fluent is a general solver of ow eld in 2D and 3D [18]. The rst editions of uent were able to only analyze problems with structured mesh. Now, it can analyze both structured and unstructured meshes.
Analyzing the incompressible ow or heat transfer with uent is very common. But, this simulation platform has seldom been used for free surface problems like those that arise in civil engineering. This code solves the presented governing equation to dene the ow eld. Including both turbulence models and VOF model is of great importance to utilize this code. To solve the partial dierential governing equations, uent employs the nite volume method. Discretization of the governing equations can be done by applying the upwind method. The simulated velocity and pressure elds are coupled by using `SIMPLE method' [18]. To get the numerical solution to Eqs. (1) to (9), the models are prepared in Gambit which is a mesh generator. Unstructured meshes were used to produce the com-putational cells. In mesh generation, care should be taken where the rate of gradients is high and therefore a larger number of cells are needed. A preliminary study dened the appropriate mesh sizes. The size of mesh along all coordinates was selected 2 cm except for high gradient zones where the mesh size was reduced to 8-9 mm. Suitable boundary conditions are of primary importance. These conditions are shown in Figure 3. A \water inlet: pressure inlet" boundary condition was used to dene the water pressure at ow inlets. This boundary condition is based on the assumption that upstream inlet is suciently far away from the crest where velocity is negligible. As a result, \water inlet: pressure inlet
denes hydrostatic pressure of water column at dierent heights. Similarly, there is also \air inlet: pressure inlet" boundary condition at the top of water surface which denes atmospheric pressure. ForFigure 3. Boundary conditions used in simulation throughout the domain.
the leading walls at two sides of ow as well as for the bottom, the \wall" boundary condition is assigned to bound uid and solid regions. For downstream, a \pressure outlet" boundary was considered to specify static pressure at outlet. For present study, due to steep slope section downstream of weir, water depth was negligible. Thus, static pressure at downstream is close to atmospheric pressure. Initial conditions are also necessary to start the numerical solution of the equations. The initial conditions are hydrostatic pressure on the weir/spillway walls, bottom, and water inlet at upstream of labyrinth weir/spillway. A column of water is assumed right above the crest before the numerical simulation begins.
As numerical simulation continues, discharge of ow is calculated as the product of ow velocity and cross section. Discharge coecient can be obtained according to Eq. (10).
Q = 23CdLp2gHo1:5: (10)
In Eq. (10), L and Ho are the eective length of
weir and total head on the crest, respectively. L is dened according to the geometry of the weir/spillway, and total head (Ho) is dened as the summation of
static head (P=g) and velocity head (U2=2g) that
are determined once the pressure and velocity elds are calculated by numerical solution. When discharge is obtained by numerical simulation, Cd is the only
unknown of Eq. (10).
2.5. Geometric characteristics of the present testing weirs
The numerical study includes two sets of models: Set (I) and set (II). The models in set (I) are numerical simulations of the labyrinth spillway previously used in the laboratory experiments by Tullis et al. (1995) in the hydraulic laboratory at the Utah Water Research Laboratory at Utah State University [8]. The only dierence, which does not have a signicant eect on the results, is the width of apex. Tullis et al. (1995) removed the width [8] and therefore considered triangular congurations for their tested models while, in practice, a minimum width should be considered. The sketches of the weirs for set (I) with the important parameters are shown in Figure 4 and Table 1. For the models of set (I), the eect of various water heads are evaluated. In the set (II) models, the eect of apex
Table 1. The parameters of weirs set (I).
(degree)
Length of weir (m)
Width of weir
(m) T (m) L=W W=T
12 4.512 1 0.152 4.512 6.579
18 2.909 1 0.152 2.909 6.579
Figure 4. The sketch of weirs of set (I).
Figure 5. The sketch of weirs in set (II).
shape is taken into consideration (Figure 5). In this set of models, labyrinth weirs with a wide apex are dened by model nos. 1 and 4, with a round apex by model no. 2, and with a sharp apex by no. 3. For all of the models, a steep-slope section after the spillway helps easy discharge of water and prevents submergence to aect the discharge coecient of ow over the weir/spillway.
3. Results
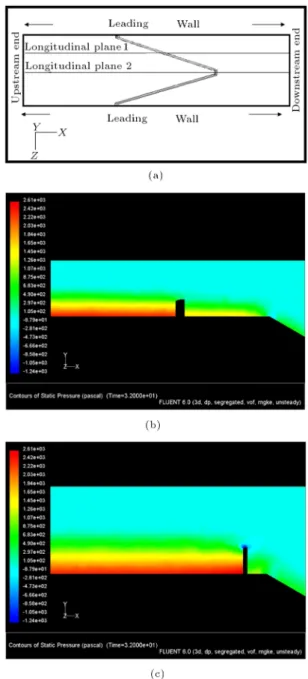
The results of numerical study along with the physical results for models in set (I) are presented in Table 2. Numerical computation was continued until steady state ow occurred. The errors between results of physical and numerical models are given in Table 3 to indicate performance of numerical simulation. Fig-ures 6 and 7 depict the pressure and velocity elds over the labyrinth weir with = 18 and Ho=T = 0:8.
The pressure eld in Figure 6 is static pressure rather than total pressure. This is mainly due to negligible
Table 3. Percentage errorin results of numerical study. Ho=T = 0:25 Ho=T = 0:5 Ho=T = 0:8
{ { -4.237
6.43 <1 <1
{ <1 -4.42
Numerical error (%)= Ho
T
numerical
Ho
T
physical
Ho
T
physical
100.
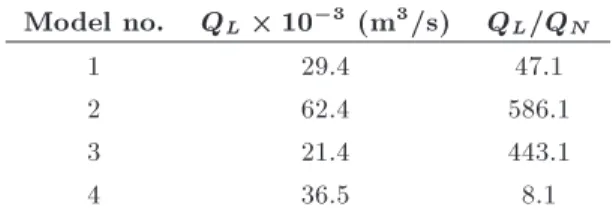
Table 4. Eciency of labyrinth weirs with dierent apex shape.
Model no. QL 10 3 (m3/s) QL=QN
1 29.4 47.1
2 62.4 586.1
3 21.4 443.1
4 36.5 8.1
ow velocity (in the order of 10 3 to 10 1 m/s)
in upstream domain and even on weir's crest which produces negligible dynamic pressure (U2=2). The
free surface of ow for the same labyrinth weir is shown in Figure 8. After getting suitable results for the models of set (I), the eect of apex shapes was examined based on models in set (II). The eciencies of models in set (II) are given in Table 4. Eciency is dened as the ratio of ow discharge over labyrinth weir (QL) to the ow discharge (QN) over a straight
weir with the same width or (QL=QN).
4. Discussion
Simulation of ow over labyrinth spillways/weirs was presented in this paper. Due to 3D nature of ow over labyrinth spillways, almost all of the previous inves-tigations have been accomplished experimentally. In fact, in those investigations, the lack of powerful com-puters and sophisticated algorithms which are capable of both dening free-water-surface and computation of hydrodynamic parameters (velocity and pressure) prevent application of numerical modeling for study of overow on labyrinth spillways. As shown in this paper, through numerical modeling (Tables 2 and 3), the errors between physical and numerical modeling are generally below 10%. In cases in which labyrinth weir is with = 18 and H
o=T = 0:25 in set (I),
the error is relatively higher; the impact of reaeration
Table 2. Results of numerical simulation for cases of set (I).
Cd based on the study of Tullis et al. 1995 Cdbased on numerical study (degree) Ho=T = 0:25 Ho=T = 0:5 Ho=T = 0:8 Ho=T = 0:25 Ho=T = 0:5 Ho=T = 0:8
12 0.551 0.437 0.348 { { 0.333
18 0.622 0.554 0.459 0.662 0.551 0.457
Figure 6. Pressure eld in terms of static pressure for labyrinth weir with Ho=T = 0:8: (a) Location of longitudinal planes for presenting pressure eld; (b) pressure eld along longitudinal plane 1; and (c) pressure eld along longitudinal plane 2.
condition is probably the source of dierence as also pointed by Tullis et al. (1995) [8]. It is clear from Table 4 that the eciency of labyrinth weir no. 1 in set (II) is greater than labyrinth weir no. 3 since L=W ratio is higher for labyrinth of no. 1. In addition, by sharpening the apex of labyrinth spillways/weirs, the eciency of labyrinth increases. Thus, the eciency of labyrinth no. 2 is greater than labyrinth no. 1. The results in Table 4 also show that smaller angle () causes more eciency of the labyrinth weir. Therefore, the eciency of weir no. 4 is greater than eciency of labyrinth weir no. 1.
Figure 7. Velocity vectors over labyrinth weir with Ho=T = 0:8: (a) Location of cross-sections (XS 1, XS 2, XS 3) for presenting velocity eld; (b) velocity vectors at XS 1; (c) velocity vectors at XS 2; and (d) velocity vector at XS 3.
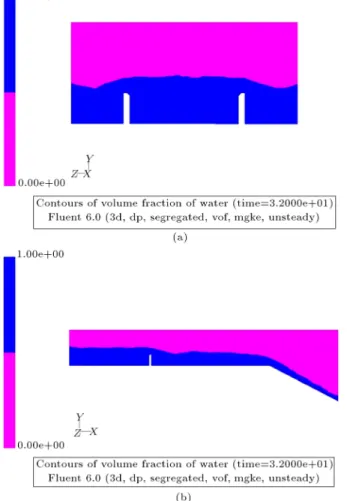
Figure 8. Free water surface over labyrinth weir with Ho=T = 0:8: (a) Perpendicular to ow path; and (b) parallel to ow path.
Numerical study of ow over labyrinth spillways yields the value of velocity and pressure for the entire computational domain. Thus, by dening appropriate domain, the velocity of ow in the stilling basin right downstream of spillways can also be obtained. This velocity is important for determination of dimensions of stilling basin. In addition, vibration of the nappe that produces loud noise is very much dependent on variation of pressure which can be fully analyzed prior to the construction of the spillway. As shown in Figure 8, VOF model is able to identify free-surface throughout the computational domain. It is clear from Figure 8 that water surface slightly falls where it reaches contraction and increase while exiting the downstream apex. This variation in water surface is also depicted in Figure 1(b) in section view of ow over labyrinth weir. Water surface elevation can be used in economic determination of leading walls' height.
5. Conclusion
Re-evaluation of the workability of dierent parts of dams especially spillways on the basis of updated
hydrologic and meteorological data is of primary im-portance. In this regard, application of labyrinth spillways due to increasing volume of dam storage and discharge capacity has been highly considered. The results of this study show:
Numerical simulation is a suitable tool for evalua-tion of ow over labyrinth spillways under dierent geometries of spillway and various hydraulic condi-tions.
Instead of using design curves from literature, numerical modeling can be directly used in de-sign of new spillways by incorporating site-specics which are usually dierent from conditions of design curves.
The results from numerical studies can be used to obtain optimum design of spillway, stilling basin, and leading walls.
Acknowledgment
The authors would like to extend their sincere acknowl-edgment to the reviewers for their insightful comments and corrections and improving present submission.
References
1. Mays, L.W. \Water resources engineering", Chap. 17, Wiley, New York, USA (2001).
2. Lux, F. III and Hinchli, D.L. \Design and construc-tion of labyrinth spillways", 15th ICOLD Conference, Lausanne, Switzerland, pp. 249-274 (1985).
3. Hay, N. and Taylor, G. \Performance and design of labyrinth weirs", ASCE J. of Hydr. Eng., 96(11), pp. 2337-2357 (1970).
4. Darvas, L.A. \Discussion of performance and design of labyrinth weirs by Hay and Taylor", ASCE J. of Hydr. Eng., 97(80), pp. 1246-1251 (1971).
5. Houston, K.L. and Hinchli, D.L. \Hydraulic model study of hyrum dam auxiliary labyrinth spillway", Report No GR-82-13, U.S. Dept. of the Interior, Bureau of Reclamation (1983).
6. Cassidy, J.J., Gardner, Ch. A. and Peacock, R.T. \Boardman labyrinth crest spillway", ASCE J. of Hydr. Eng., 111(3), pp. 398-416 (1985).
7. Magalh~aes, A. and Lorena, M. \Hydraulic design of labyrinth weirs", Report No. 736, National Laboratory of Civil Engineering, Lisbon, Portugal (1989).
8. Tullis, J.P., Amanian, N. and Waldron, D. \Design of labyrinth spillways", ASCE J. of Hydr. Eng., 121(3), pp. 247-255 (1995).
9. Lopes, R., Matos, J. and Melo, J.F. \Characteris-tic depths and energy dissipation downstream of a
and Engineer Workshop on Hydraulic Structures, S. Pagliara, Ed., Edizioni Plus, University of Pisa, Pisa, Italy, pp. 51-58 (2008).
10. Khode, B.V. and Tembhurkar, A.R. \Evaluation and analysis of crest coecient for labyrinth weir", World Appl. Sci. J., 11(7), pp. 835-839 (2010).
11. Lux III, F. \Discharge characteristics of labyrinth weirs", Proc. ASCE Hydr. Div. Specialty Conf., New York, USA (1984).
12. Crookston, B.M. \Labyrinth weirs", Ph.D. Disserta-tion, Utah State University, Logan, Utah. (2010).
13. Falvey, H.T. Hydraulic Design of Labyrinth Weirs, ASCE Press, Reston, VA, USA (2003).
14. Ho, D.K.H., Boyes, K.M. and Donohoo, S.M. \Investi-gation of spillway behavior under increased maximum ood by computational uid dynamics technique", 14th Australasian Fluid Mechanics Conference, Ade-laide University, AdeAde-laide, Australia (2001).
15. Savage, B.M., Frizell, K. and Crowder, J. \Brains versus Brawn: The changing world of hydraulic model studies", Proc. of the ASDSO Annual Conference, Phoenix, AZ, USA (2004).
16. Danish Hydraulic Institute website (DHI) <http://ballastwater.dhigroup.com/-/media /publications/news/2009/070509ns3.pdf>. (2010).
17. Wilcox, D.C., Turbulence Modeling for CFD, DCW Industries, Inc., La Canada, CA, USA (2006).
18. Fluent 6.0 Documentation, \FLUENT user's guide", Fluent Inc., Lebanon, NH, USA (2001).
19. Hirt, C.W. and Nichols, B.D. \Volume of uid (VOF) method for the dynamics of free boundaries", J. of Comput. Phys., 39(1), pp. 201-225 (1981).
20. Chen, Q., Dai, G. and Liu, H. \Volume of uid model for turbulence numerical simulation of stepped spillway overow", ASCE J. of Hydr. Eng., 128(7), pp. 683-688 (2002).
21. Tang, H., Wrobel, L.C. and Fan, Z. \Tracking of immiscible interfaces in multiple-material mixing pro-cess", Comp. Mater. Sci., 29(1), pp. 103-118 (2004).
Biographies
Vahid Zahraeifard is a PhD student in the De-partment of Civil and Environmental Engineering at Louisiana State University, Baton Rouge, USA. His elds of interest are: ecohydrology, numerical models in water resources engineering, surface water-groundwater interactions, fate and transport of solutes in aquatic environments. He holds two Master's degrees in Civil and Environmental Engineering from Louisiana State University and Shiraz University in 2011 and 2006, respectively. He received his Bachelor's degree in Civil Engineering from University of Tabriz in 2003.
Nasser Talebbeydokhti is a Professor of Civil and Environmental Engineering at Shiraz University with 30 years of teaching, research, and consulting activities that cover broad areas of water resources and envi-ronmental engineering. These include: envienvi-ronmental engineering, hydrology, river hydraulics, watershed en-gineering, sediment transport and channel morphology, hydraulic structures, hydropower, sh habitat and sh passage engineering, environmental impact assess-ment and mitigation, water resources planning, water quality management and monitoring, integrated wa-tershed management, coastal and estuarine sediment, and river resource planning and management. Prof. Talebbeydokhti received his PhD and Master's degrees in Civil and Environmental Engineering from Oregon State University, Corvallis, USA, in 1979 and 1984, respectively. He also holds a Bachelor's degree in Water and Irrigation Engineering from Tehran University in 1974.