Sharif University of Technology
Scientia IranicaTransactions A: Civil Engineering www.scientiairanica.com
Polynomial models controlling strength of
zeolite-cement-sand mixtures
H. Mola-Abasi
and I. Shooshpasha
Department of Civil Engineering, Babol University of Technology (BUT), Babol, Iran.
Received 14 September 2015; received in revised form 19 January 2016; accepted 30 January 2016
KEYWORDS Zeolite;
Cemented sand; Unconned
compressive strength; Polynomial;
Sensitivity analysis.
Abstract. The improvement of local soils with cement and zeolite can provide great benets, including strengthening slopes in slope stability problems and stabilizing problematic soils to prevent soil liquefaction. Recently, dosage methodologies have been developed for improved soils based on a rational criterion as it exists in concrete technology. The present study aims to quantify the inuence of the amount of cement, zeolite, porosity, and curing time in the evaluation of Unconned Compressive Strength (UCS) of zeolite-cemented sand mixtures. A program of unconned compression tests considering dierent voids ratios, cement contents, zeolite contents, and curing times was performed in this paper. The results show that UCS values of samples substantially increase with increasing zeolite content to an optimum value of 30% after 28 days of curing time. The rate of improvement is approximately between 20 to 80% and 20% to 60% for 28 and 90 days curing times, respectively. Moreover, the polynomial models are shown to be the appropriate ones to estimate UCS values of zeolite-cemented mixtures. Additionally, the sensitivity analysis reveals the inuence of parameters and the contribution of each coecient to the polynomial model. Cement and zeolite contents are related more strongly among relative density and curing time.
© 2017 Sharif University of Technology. All rights reserved.
1. Introduction
For many years, soil stabilization with cement has been a ground improvement technique for some engineering applications such as construction of stabilized bases under pavements, canal lining, and engineered lls. This reliable and simple soil improvement technique can provide great advantages including increasing shear strength parameters and avoiding the use of borrowing materials from elsewhere. The compressive strength of articially cemented soils has been studied by many researchers [1-14]. On the other hand, using additive ber, glass, y ash, silica fume, and nano particle in
ce-*. Corresponding author. Fax: +98 1132331701 E-mail addresses: [email protected] (H. Mola-Abasi); [email protected] (I. Shooshpasha)
ment stabilization industry has several advantages [15-20]. Natural zeolite is one of these mineral materials. There are few studies about the eect of natural zeolite as an additive material on the cemented sand. Natural zeolite, an extender, has been investigated for use as cement and concrete improver by some researchers [21-22]. In this study, the use of a natural zeolite additive, as a potential improver of cemented sand, is investigated. Natural zeolite contains large quantities of reactive SiO2 and Al2O3 [21]. Similar
to other pozzolanic materials, zeolite substitution can improve the strength of cement by pozzolanic reaction with Ca(OH)2, can prevent undesirable expansion due
to alkali-aggregate reaction, reduce the porosity of the blended cement paste, and improve the interfacial microstructure properties between the blended cement pastes [21,23,24]. It has been observed that pozzolanic
activity of natural zeolite is higher than that of y ash but lower than that of silica fume [21]. It was concluded that the clinoptilolite blend decreases the specic gravity of cements [25].
There are several investigations about the re-lationship between Unconned Compressive Strength (UCS) and voids/cement ratio of cemented sand [1,6,7]. However, the existing equations based on voids/cement ratio cannot properly estimate UCS values of zeolite-cemented sand mixtures. Therefore, in this paper, polynomial models are used for predicting them.
This study aims to investigate the eects of zeo-lite, cement, curing time, and porosity on the strength of zeolite-cemented sand mixtures. In this paper, rst, experimental program was presented and discussed in detail. Then, polynomial models for predicting UCS values were dened. Finally, sensitivity analyses of zeolite-cemented sand mixtures were described.
2. Experimental program
Several unconned compression tests were performed and the results are considered in this paper. Cement content, replacement of cement by zeolite, relative density, and curing time are the variables measured in the testing program. Table 1 shows the variables considered in sample preparation and testing. The positive eects of zeolite on the strength of cemented sand requires the curing time due to the pozzolanic reactions. So, the curing times of 28 and 90 days are selected. The experimental program is carried out in two parts. First, the geotechnical properties of the sand, zeolite, and cement were characterized. Then, a series of unconned compression tests were carried out and discussed.
2.1. Materials
The materials in this study include Babolsar sand, Portland cement type-II, and natural clinoptilolite kind of zeolite.
2.1.1. Sand
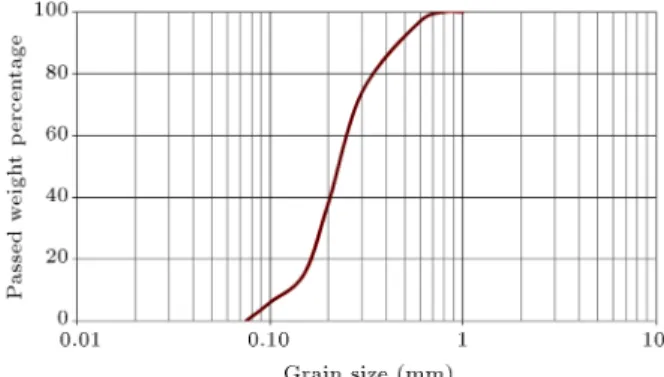
The sandy soil used in the present study was obtained from the shores of the Caspian Sea (from the city of Babolsar, northern Iran). The sand was classied as poorly graded sand (SP) according to the Unied Soil Classication System with angular particle shape and specic gravity of the solids 2.74. The grain size is purely ne sand with mean eective diameter (D50),
uniformity, and curvature coecients of 0.24, 1.75, and 0.89 mm, respectively. In addition, the minimum and maximum unit weight values are 14.9 and 17.7 kN/m3,
respectively [26,27]. The grain-size distribution curves of sand are presented in Figure 1.
2.1.2. Cement
Portland cement type II was applied in this research. Specic surface, initial setting time, and the specic gravity of the cement grains values are > 3000 (cm2/g),
> 75 (min), and 3.11, respectively. 2.1.3. Zeolite
The natural clinoptilolite zeolites with particles smaller than 75 m (No. 200 sieve) obtained from an area near Aftar city in Semnan province of Iran were used in the tests. The used zeolite is non-plastic and classied as silt (ML) according to the Unied Soil Classication System with specic gravity of 2.2.
Figure 1. Grain-size distribution of sand. Table 1. Description of variables in the present study.
Variables No. of levels Description of samples
Soil type 1 Poorly-graded sand from Babolsar City (shores of Caspian Sea) Cement agent 1 Portland cement (type II)
Cement content 4 2, 4, 6, and 8% dry unit weight of base soil Type of zeolite 1 Natural cilnopiolite zeolite
Zeolite content 6 0, 10, 30, 50, 70, and 90% of cement Relative density 3 50, 70, and 85%
Water content 1 10% weight of base soil
Sample size 1 38 mm diameter and 76 mm height, compacted in three layers Curing condition 3 Cured for 7, 28, and 90 days in humid room
2.2. Sample preparation and test process For the unconned compression tests, cylindrical spec-imens, 38 mm in diameter and 76 mm in height, were used. According to Eq. (1), the target dry unit weight, d, was calculated for a given void's ratio (e) which
relates to Dr of sand (85, 70, and 50%):
d =G1 + esw: (1)
Because the specic gravity of the cement grains is 3.11, sand is 2.74, and zeolite is 2.2, a composite specic gravity (Gs) based on the cement, sand, and
zeolite percentages in the specimen was used for the calculation of voids ratio and porosity. Sand, cement, and zeolite (based on Table 1) were mixed uniformly, then tap water (10% by dry weight of soil) was added continuously to the mixture. In order to reach the specied dry unit weight, each mixture was compacted in three layers based on the under-compaction method. The top of each layer was slightly scaried. The time used to prepare, mix, and compact was always less than 1 hour for all of the samples. It should be noted that using zeolite increases the initial setting time of cement. In order to determine moisture content, small portions of the mixtures were taken. The specimens were placed in plastic bags and cured in a humid room at 24C and relative humidity of above 90% for 7, 28,
and 90 days. The unconned compression test is one of the major and rapid laboratory tests that can be used to evaluate the eects of the zeolite content, porosity, cement content, and curing time on the mechanical strength of the zeolite-cement-sand mixtures. Totally, 216 unconned compression tests were performed in accordance with ASTM D-2166 [28].
3. Modelling using polynomial models
Over the last few years, the polynomial models have been applied to many geotechnical engineering prob-lems and demonstrated some degrees of success. In this eld, Kalantary et al. [29], Ardalan et al. [30], Mola-Abasi et al. [31], and Kordnaeij et al. [32] applied polynomial models to predict undrain shear strength of clays, pile bearing capacity, liquefaction induced lateral displacement, shear wave velocity, shear wave velocity, and recompression index of consolidation based on geotechnical soil properties, respectively. Thus, this approach can be used in empirical correlation of zeolite-cement-sand mixture's UCS.
The basic assumption is that a pair of input parameters can be connected through a polynomial function to outputs. The task is to nd a function,
^
f, that can be approximated to an observed function f in order to produce the value of the output, ^y, for a given value of the input vector, X = (x1; x2; x3; :::; xn),
such that the dierence between ^y and y is minimum.
Therefore, for a given M observations of multi-input, single output data pairs are obtained as follows:
yi= f(xi1; xi2; xi3; :::; xin) where i = 1; 2; :::; M: (2)
It is possible to use a polynomial function to predict the output values, ^yi, for any given input vector, X =
(xi1; xi2; xi3; :::; xin), such that:
^yi= ^f(xi1; xi2; xi3; :::; xin) where i = 1; 2; :::; M: (3)
The challenge is to dene a polynomial function, such that the square of the dierences between the observed output and predicted one are minimum:
M
X
i=1
h ^
f(xi1; xi2; xi3; :::; xi) yi
i2
! min : (4)
The general connection between input and output variables can be expressed by a discrete form of the Volterra functional series, known as Kolmogorov-Gabor polynomial [33]. Hence:
y =a0+ n
X
i=1
aixi+ n X i=1 n X j=1
aijxixj
+ n X i=1 n X j=1 n X k=1
aijkxixjxk+ ::: (5)
This mathematical description can be represented by a system of quadratic polynomials consisting of only two variables in the form:
^y =G(xi; xj) = a0+ a1xi+ a2xj+ a3xixj
+ a4x2i + a5x2j: (6)
The coecients ai in Eq. (6) are calculated using
regression analysis, so that the dierence between the observed output, y, and the calculated one, ^y, for each pair of xi and xj as input variables is minimum:
E = 1 M
M
X
i=1
(yi Gi)2! min : (7)
Using the quadratic expression in Eq. (6) for each of the M rows, the following matrix can be obtained:
Aa = Y; (8)
where a is the vector of unknown coecients for the quadratic polynomial function in Eq. (6), and Y is the vector of output values from observation. Then, A takes the form:
A = 2 6 6 4
1 x1p x1q x1px1q x21p x21q
1 x2p x2q x2px2q x22p x22q
: : : : : :
1 xMp xMq xMpxMq x2Mp x2Mq
3 7 7 5 M6 : (9)
A least-squares optimization approach for multiple regression analysis leads to the solution of the normal equations:
a = (ATA) 1ATY: (10)
The vector is given the best-t coecients for Eq. (6) for the whole set of M data triplets.
4. Results and discussion
Figure 2 shows the stress-strain curves of specimens, stabilized with cement contents of 4 and 8% and dierent zeolite contents (for Dr = 85%) cured in 7 and 90 days. It can be observed that the maximum axial stress increases considerably and the corresponding strain decreases due to cement stabilization. However, the strain corresponding to the maximum axial stress increases with increasing zeolite content. In other words, utilizing zeolite in cemented sand increases strain at failure and reduces brittle behavior. Since the main purpose of this paper is estimation of the UCS values, less attention has been paid to the study of strain and failure.
4.1. Eects of cement and zeolite contents Results of unconned compression tests for samples with cement contents of 2, 4, 6, and 8% and zeolite
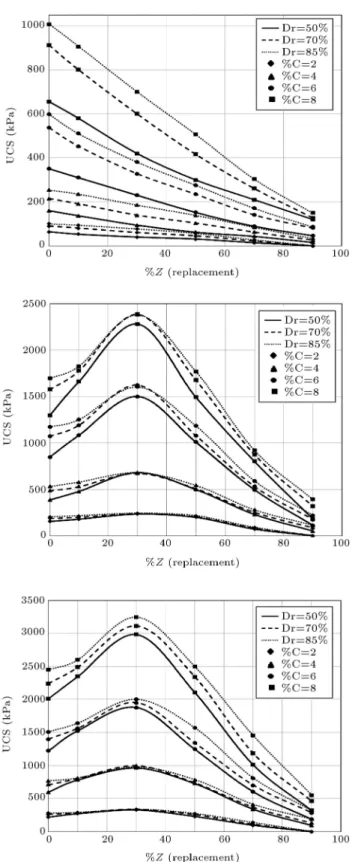
contents of 0, 10, 30, 50, 70, and 90% cured in 7 to 90 days are indicated in Figure 3.
It is seen that for a given Dr and zeolite content, UCS value increases with increasing cement content after 28 days. By adding zeolite to cemented sand, UCS values of mixtures increase to a peak point, and then re-duce. It is noteworthy that zeolite is composed of amor-phous minerals without denable crystalline structure and both cement and zeolite are predominantly formed of silica and alumina, chemically. Therefore, pozzolanic reactions, time-dependent chemical reactions between cement and zeolite particles, were occurred after 28 days of curing. Such reactions take place because silica and alumina within the zeolite structure react with water and cement to form calcium silicate hydrate and calcium aluminate hydrate gels, which consequently crystallize to hold the structure together. Adding zeo-lite into the mixture increases the amounts of alumina and silica, grows reactions with cement, and subse-quently increases mixture strength. Because of cement content reduction, the amounts of calcium silicate hy-drate and calcium aluminate hyhy-drate gels decrease with increasing zeolite contents more than 30%. Therefore, the results show that the maximum value of UCS for mixtures occurs at the zeolite content of 30%. Fig-ure 4 shows the increase rate ([UCSzeolite cemented sand
-UCScemented sand]/UCScemented sand) of UCS values for
Figure 3. Eect of additive materials to sand via UCS.
dierent relative densities at the zeolite content of 30%. This rate of increase is more evident at higher cement contents and lower relative densities due to higher amounts of zeolite-cement hydration products. Therefore, adding zeolite can aect the strength of cemented sand considerably.
Figure 4. UCS improvement of cemented sand replaced by optimum value of zeolite.
4.2. Porosity eect
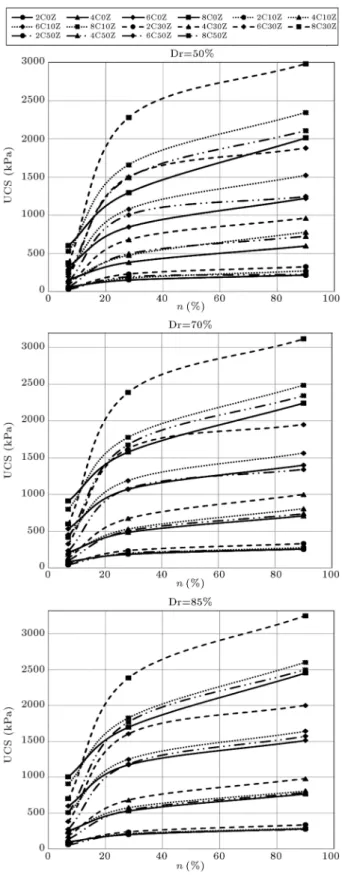
Figure 5 shows the eects of porosity, n, on the peak strength of zeolite cemented sand (up to 50% cement replacement). UCS reduced with the increases in porosity of both zeolite and cement samples. The loss of strength rate is more for cemented mixtures and samples cured in 7 days; the loss of strength rate for 28 and 90 days of curing times of zeolite cemented samples is relatively minor. In other words, when cement is replaced by optimum zeolite (30%), the variation of UCS is approximately constant by increasing porosity. Therefore, the eectiveness of using zeolite instead of cement is greater in more porosity blends.
4.3. Curing time eects
The variation of curing time aects the UCS of zeolite cemented sand mixtures presented in Figure 6 (up to 50% cement replacement). As one can see, Figure 6 shows that by increasing curing time, UCS increases with decreasing rate.
4.4. Evaluation of UCS using polynomial model
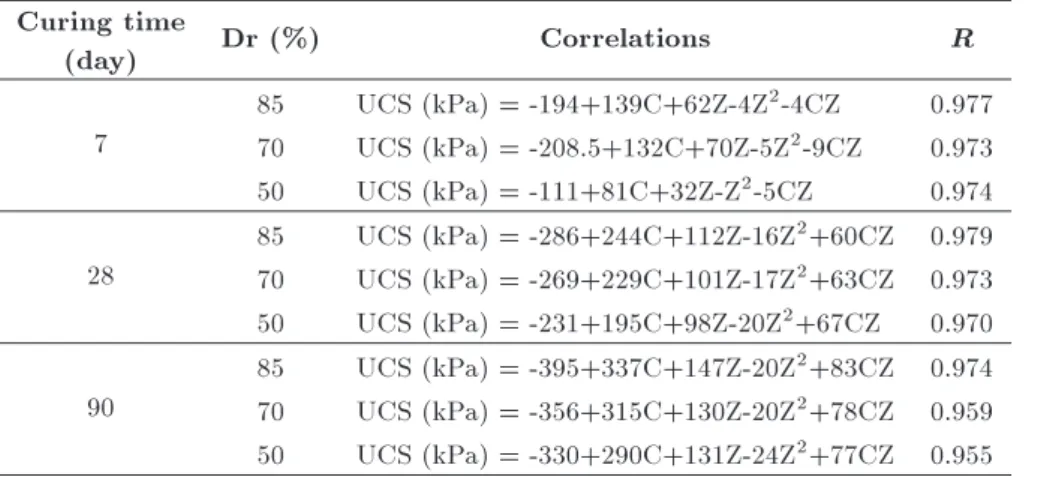
One of the main objective of this research is to develop a polynomial function of input zeolite-cemented sand parameters to estimate the USC as output. It can be seen from Figures 3 that for zeolite-cemented materials, the UCS behave approximately polynomially with the increase in the zeolite content. As presented in Table 2, polynomial formulas based on Voltra series are one of the best ts, where C and Z are the cement and
Figure 5. UCS variations through porosity for cement-zeolite samples after 7, 28, and 90 days.
zeolite percentages of 100 g total dry soil. At high dry densities (more compacted mixtures), there are many more contacts between the products of the cement hydration and soil particles, and so the eectiveness of the cement is greater.
Figure 6. UCS variations with curing time for cement-zeolite samples with dierent relative densities.
4.4.1. Eect of porosity
As shown in Figure 5, there exists a relationship between the UCS and the porosity adjusted by poly-nomial function for the zeolite cemented soil mixtures.
Table 2. Polynomial correlations for predicting UCS. Curing time
(day) Dr (%) Correlations R
7
85 UCS (kPa) = -194+139C+62Z-4Z2-4CZ 0.977
70 UCS (kPa) = -208.5+132C+70Z-5Z2-9CZ 0.973
50 UCS (kPa) = -111+81C+32Z-Z2-5CZ 0.974
28
85 UCS (kPa) = -286+244C+112Z-16Z2+60CZ 0.979
70 UCS (kPa) = -269+229C+101Z-17Z2+63CZ 0.973
50 UCS (kPa) = -231+195C+98Z-20Z2+67CZ 0.970
90
85 UCS (kPa) = -395+337C+147Z-20Z2+83CZ 0.974
70 UCS (kPa) = -356+315C+130Z-20Z2+78CZ 0.959
50 UCS (kPa) = -330+290C+131Z-24Z2+77CZ 0.955
It can be seen that the rates of change of UCS with porosity for 7-day curing time and after 28-day curing time are substantially dierent. One way to make the variation rates of porosity compatible is through the application of polynomial model (voltra series) to previous polynomial model of them. It was found that for the relationship between UCS and porosity, the optimum t could be obtained by applying polynomial models as shown in Table 3, with its performance available in Figure 7; in Table 3, where C and Z are the cement and zeolite percentages of 100 g total dry soil with porosity (n) in percent.
4.4.2. Eect of curing time
The eects of curing time on the UCS of the zeolite cement soil are shown in Figure 6. As shown in Fig-ure 6, with the increase of curing time, UCS increases polynomially with decreasing rate. Therefore, polyno-mial function can well estimate the relation between UCS and curing time of both zeolite and cemented soil specimens with a dierent porosity (Figure 8). The corresponding polynomial representation of such a model for UCS is as follows:
UCS = 317:5 + 0:48Y2+ 25:01d + 0:0001Y22
0:24d2+ 0:012d:Y
2; (11a)
Y2=0:5 + 1:7Y1+ 9:55n + 0:0001Y12 0:221n2
0:025n:Y1; (11b)
Y1= 19:9 + 70:1C + 15:5Z + 16:23C2 7:56Z2
+ 60:7C:Z; (11c)
where C and Z are the cement and zeolite percentages of 100 g total dry soil with porosity (n) in dierent curing times (d).
4.4.3. Performance of polynomial models
The structure of the evolved polynomial models is shown in Figure 9 corresponding to the input repre-sentations for dierent conditions such as the eect of zeolite, porosity, and curing time.
The polynomial models show one of the best cor-relations by assuming dierent conditions, and the pro-posed equation results in points more closely located around the 1:1 line. It can be seen that the polynomial models could successfully model and predict the output of testing data that have not been tested.
Absolute fraction of variance (R2), Root Mean
Squared Error (RMSE), Mean Absolute Percent Error (MAPE), and Mean Absolute Deviation (MAD) are used to evaluate the performance of the proposed
Table 3. Polynomial correlations for predicting UCS considering porosity. Curing time
(day) Correlations
7 UCS=0:17 + 7:43Y1+ 3:15n + 0:0000064Y12 0:81n2 0:17n:Y1
Y1= 47:9 13:98C 20:57Z + 14:23C2+ 2:97Z2+ 12:81C:Z
28 UCS=0:95 + 1:84Y1+ 17:27n + 0:0004Y12 0:41n2 0:03n:Y1 Y1= 83:4 + 141:6C + 42:9Z + 12:02C2 13:1Z2+ 78:8C:Z
90 UCS=0:97 + 2:02Y1+ 18:3n + 0:0001Y12 0:421n2 0:03n:Y1 Y1= 24:3 + 110:3C + 24:1Z + 22:45C2 12:6Z2+ 108:4C:Z
Figure 7. The measured UCS obtained from the unconned compression test versus polynomial model output for dierent curing times.
equations and models, which are dened as follows:
R2= 1 "PM1P(Cmi Cpi)2 M
1 (Cmi)2
#
; (12)
Figure 8. The measured UCS obtained from the unconned compression test versus polynomial model output.
Figure 9. Evolved structure of generalized polynomial models.
RMSE = v u u t 1
M
M
X
1
(Cmi Cpi)2; (13)
MAPE = PM
1 jCmi Cpij
PM
1 Cmi
100; (14)
MAD = PM
1 jCmi Cpij
M ; (15)
where Cmi and Cpi are the measured and predicted
UCS. The lower the values of the RMSE, MAPE, and MAD are, the better the model performance will be. Under ideal conditions, an accurate and precise method gives R2 of 1.0, RMSE, MAPE, and MAD of 0.
In Table 4, the values of RMSE, MAPE, and MAD are found for the polynomial model in dierent condition stages.
On the other hand, for cemented sand, a power function can t as the relation between UCS and poros-ity (n) of cemented soil specimens as voids/volumetric cement content ratio ( n
Cv) parameter that has been
investigated by several researchers. In this part, based on only the cemented sand samples, parameters of voids/cement model are adjusted and compared to this
Figure 10. Adjusted voids/cement ratio and polynomial model for cemented specimens.
study's correlations (equations presented in Table 3 with value of zeolite =0) as in Figure 10. As shown in Figure 10, the predictability of the polynomial model is satisfactory in comparison with the voids/cement ratio model.
4.4.4. Sensitivity analysis
Because the polynomial model produced by Eq. (11) is in the form of complex equations; thus, the eect of input parameters on the model output is not clearly evident. The sensitivity analysis of the obtained model is carried out to evaluate the inuence of the input parameters on the model output. The sensitivity
Figure 11. Results of the sensitivity analysis of the obtained model for UCS.
test is carried out by varying each of the normalized input at a constant rate, one at a time, while other variables are constant. Various constant rates (0.9, 0.95, 0.99, ..., 1.1) are selected in the study. For every input parameter, the percentage change in the output is observed as a result of the change in the input parameter. The sensitivity of each input parameter is calculated by the following equation [34]:
Sensivity level of Xi(%) =
1 M
M
X
j=1
%change in output %change in input
j 100: (16)
Results of the sensitivity analysis of the obtained model are shown in Figure 11. It can be noticed from this gure that the UCS is considerably inuenced by the cement content. Also, curing time has little eect on the correlation.
The results presented in this paper, therefore, suggest that an engineer can choose the appropriate amount of cement, zeolite, and compaction energy to provide a mixture that meets the strength required by the project at the optimum cost using polynomial model as represented by voltra series for given charac-teristics, percentage, and curing time. The polynomial models can also be useful in the eld control of zeolite in soil-cement layers. Once a poor compaction has been identied, through these study models, one can readily take account of the design and corrective measure adoption, accordingly, such as the zeolite of the treated layer or the reduction in the load transmitted. It is important to make clear that the trends observed
Table 4. Statistical results for polynomial correlations.
Equation R2 MAPE RMSE MAD
Include porosity 28 days7 days 0.9990.981 12.8314.7 12.973.87 9.2410.9 90 days 0.988 13.51 10.5 9.8 Include curing time 0.968 18.69 17.5 12.7
herein are relevant to the soil, cement, and zeolite type and content used in the present research, and that further studies are necessary to generalize such ndings.
5. Conclusions
The zeolite insertion causes an increase in unconned compression strength in the cemented soil (for the whole range of cement studied).
Other remarks of the paper are:
The addition of cement, even in small amounts, greatly improved the soil strength of zeolite cement and cemented soils. For the cement contents studied here, the unconned compression strength increased approximately linearly with the increase in the cement content; for the cement replaced by zeolite samples, UCS increased and decreased through zeo-lite replacement with polynomial correlations. The optimum value of zeolite for all cement contents was 30% which improved UCS 20 to 80% and 20 to 60% for 28-day and 90-day samples, respectively. The rate of strength gain, represented by Figure 5, increased with the decrease in the dry density and the increase in cement content. It is indicated that the eectiveness of the zeolite is greater in more cemented and less compacted mixtures;
The decrease in the porosity of the compacted mix-ture greatly improved the strength for the cemented soils and slightly improved the strength for zeolite cement mixtures. It is shown that the unconned compressive strength increases in power model with the reduction in the porosity of the compacted mixture;
The polynomial models, dened by cement and zeolite contents, porosity of the compacted mix-ture, and curing time have been shown to be a more appropriate model to evaluate the unconned compression strength of zeolite soil-cement mixtures studied;
The developed polynomial model proved to be more ecient than previous correlations, and cement content appeared to be the most inuential on the UCS value.
References
1. Clough, G.W., Rad, N.S., Bachus, R.C. and Sitar, N. \Cemented sands under static loading", Journal of the Geotechnical Engineering Division, 107(6), pp. 799-817 (1981).
2. Coop, M.R. and Atkinson, J.H. \The mechanics of cemented carbonate sands", Geotechnique, 43(1), pp. 53-67 (1993).
3. Consoli, N.C., Rotta, G.V. and Prietto, P.D.M. \The inuence of curing under stress on the triaxial response of cemented soils", Geotechnique, 50(1), pp. 99-105 (2000).
4. Consoli, N.C., Rotta, G.V. and Prietto, P.D.M. \Yielding-compressibility-strength relationship for an articially cemented soil cured under stress", Geotech-nique, 56(1), pp. 69-72 (2006).
5. Consoli, N.C., Foppa, D., Festugato, L. and Heineck, K.S. \Key parameters for strength control of arti-cially cemented soils", Journal of Geotechnical and Geoenvironmental Engineering, ASCE, 133(2), pp. 197-205 (2007).
6. Consoli, N.C., Lopes Jr., L.S., Foppa, D. and Hei-neck, K.S. \Key parameters dictating strength of lime/cement-treated soil", Proceedings of the Insti-tution of Civil Engineers-Geotechnical Engineering, 162(2), pp. 111-118 (2009).
7. Consoli, N.C., Lopes Jr., L.S. and Heineck, K.S. \Key parameters for the strength control of lime stabi-lized soils", Journal of Materials in Civil Engineering, 21(5), pp. 210-216 (2009).
8. Consoli, N.C., Festugato, L., da Rocha, C.G. and Cruz, R.C. \Key parameters for strength control of rammed sand-cement mixtures: Inuence of types of Portland cement", Construction and Building Materials, 49, pp. 591-597 (2013).
9. Consoli, N.C. and Foppa, D. \Porosity/cement ratio controlling initial bulk modulus and incremental yield stress of an articially cemented soil cured under stress", Geotechnique Letters, 4(1), pp. 22-26 (2014). 10. Thome, A., Donato, M., Consoli, N.C. and Graham,
J. \Circular footings on a cemented layer above weak foundation soil", Canadian Geotechnical Journal, 42, pp. 1569-1584 (2005).
11. Dalla Rosa, F., Consoli, N.C. and Baudet, B.A. \An experimental investigation of the behaviour of arti-cially cemented soil cured under stress", Geotechnique, 58(8), pp. 675-679 (2008).
12. Horpibulsuk, S., Suddeepong, A., Suksiripattanapong, C., Chinkulkijniwat, A., Arulrajah, A. and Dis-fani, M.M. \Water-void to cement ratio identity of lightweight cellular-cemented material", Journal of Materials in Civil Engineering, 26(10), pp. 263-275 (2014).
13. Faro, V.P., Consoli, N.C., Schnaid, F., Thome, A. and da Silva Lopes, L. \Field tests on laterally loaded rigid piles in cement treated soils", Journal of Geotechnical and Geoenvironmental Engineering, 141(6), pp. 605-615 (2015).
14. Yilmaz, E., Belem, T. and Benzaazoua, M. \Specimen size eect on strength behavior of cemented paste backlls subjected to dierent placement conditions", Engineering Geology, 185, pp. 52-62 (2015).
15. Choobbasti, A.J., Vafaei, A. and Kutanaei, S.S. \Me-chanical properties of sandy soil improved with cement and nanosilica", Open Engineering, 5(1), pp. 97-103 (2015).
16. Arabani, M., Shara, H., Habibi, M.R. and Haghshenas, E. \Laboratory evaluation of cement sta-bilized crushed glass-sand blends", Electronic Journal of Geotechnical Engineering, 17, pp. 1777-1792 (2015). 17. Pino, L.F.M. and Baudet, B.A. \The eect of the particle size distribution on the mechanics of bre-reinforced sands under one-dimensional compression", Geotextiles and Geomembranes, 43(3), pp. 250-258 (2015).
18. Consoli, N.C., Prietto, P.D.M. and Ulbrich, L.A. \Inuence of ber and cement addition on behavior of sandy soil", Journal of Geotechnical and Geoenviron-mental Engineering, 124(12), pp. 1211-1214 (1998). 19. Consoli, N.C., Vendruscolo, M.A., Fonini, A. and
Dalla Rosa, F. \Fiber reinforcement eects on sand considering a wide cementation range", Geotextiles and Geomembranes, 27(3), pp. 196-203 (2009).
20. Consoli, N.C., Consoli, B.S. and Festugato, L. \A practical methodology for the determination of failure envelopes of ber-reinforced cemented sands", Geotex-tiles and Geomembranes, 41, pp. 50-54 (2013). 21. Poon, C.S., Lam, L., Kou, S.C. and Lin, Z.S. \A Study
on the hydration rate of natural zeolite blended cement pastes", Construction and Building Materials, 13, pp. 427-432 (1999).
22. Perraki, T, Kakali, G. and Kontoleon, F. \The eect of natural zeolites on the early hydration of Portland cement", Microporous and Mesoporous Materials, 61, pp. 205-212 (2003).
23. Feng, N.Q., Li, Z.G., and Zang, X.W. \High strength and owing concrete with a zeolite mineral admix-ture", Cement and Concrete Aggregate, ASTM, 12, pp. 61-69 (1990).
24. Canpolat, F., Yilmaz, K., Mkose, M., Sumer, M. and Yurdusev, M.A. \Use of zeolite, coal bottom ash and y ash as replacement materials in cement production", Cement and Concrete Research, 34, pp. 731-735 (2004).
25. Ylmaz, B., Ucar, A., Oteyaka, B. and Uz, V. \Prop-erties of zeolitic tu (clinoptilolite) blended portland cement", Building and Environment, 42, pp. 3808-3815 (2007).
26. ASTM D-421, Standard Practice for Dry Preparation of Soil Samples for Particle-Size Analysis and De-termination of Soil Constan, Annual Book of ASTM Standards, American Society for Testing and Materi-als, West Conshohocken, pp. 1-2 (2012).
27. ASTM D-422, Standard Test Method for Particle-Size Analysis of Soils, American Society for Testing and Materials, West Conshohocken, pp. 1-2 (2012). 28. ASTM D-2166, Standard Test Method for Unconned
Compressive Strength of Cohesive Soil, Annual Book
of ASTM Standards, American Society for Testing and Materials, West Conshohocken., pp. 1-6 (2000). 29. Kalantary, F., Ardalan, H. and Nariman-Zadeh, N.
\An investigation on the S u-N SPT correlation using GMDH type neural networks and genetic algorithms", Engineering Geology, 104(1), pp. 144-155 (2009). 30. Ardalan, H., Eslami, A. and Nariman-Zadeh, N. \Piles
shaft capacity from CPT and CPTu data by polyno-mial neural networks and genetic algorithms", Com-puters and Geotechnics, 36(4), pp. 616-625 (2009). 31. Mola-Abasi, H., Dikmen, U. and Shooshpasha, I.
\Prediction of shear wave velocity from CPT data at Eskisehir (Turkey), using a polynomial model", Near Surface Geophysics, 13(2), pp.155-167 (2015). 32. Kordnaeij, A., Kalantary, F., Kordtabar, B. and
Mola-Abasi, H. \Prediction of recompression index using GMDH-type neural network based on geotechnical soil properties", Soils and Foundations, 55(6), pp. 1335-1345 (2015). DOI: 10.1016/j.sandf.2015.10.001 33. Jamali, A., Nariman-zadeh, N., Darvizeh, A.,
Ma-soumi, A. and Hamrang, S. \Multi-objective evolu-tionary optimization of polynomial neural networks for modelling and prediction of explosive cutting process", Engineering Applications of Articial Intelligence, 22, pp. 676-687 (2008).
34. Liong, S.Y., Lim, W.H. and Paudyal, G.N. \River stage forecasting in Bangladesh: neural network ap-proach", Journal of Computing in Civil Engineering, 14, pp. 1-8 (2000).
Biographies
Hossein Mola-Abasi received his MSc and PhD degrees in Geotechnical Engineering from the Uni-versity of Guilan, in 2010, and Babol UniUni-versity of Technology, in 2016, respectively. He is currently Assistant Professor in Gonbad University. His research interests are mainly in the area of soft computing in geomechanics, with special focus on earthquake geotechnical engineering and dynamic behavior of soils, and more recently on soil improvement techniques. Issa Shooshpasha is an Associate Professor in the Faculty of Civil Engineering in Babol University of Technology. He received his BSc degree in Tabriz University in 1987, his MSc and PhD degrees at McGill University in 1993 and 1996, respectively. His research interests are mainly in the area of bearing capacity of shallow and deep foundations, slope stability, liquefac-tion, and soil improvement.