ISSN: 2501 - 1235 ISSN-L: 2501 - 1235 Available on-line at: www.oapub.org/edu
DOI: 10.46827/ejpe.v6i7.3290 Volume 6 │ Issue 7 │ 2020
THE RELATIONSHIP BETWEEN ANTHROPOMETRIC
CHARACTERISTICS AND PHYSICAL FITNESS PARAMETERS
OF FIGURE SKATING ATHLETES
iEmine Kutlay1ii, Fehime Haslofça2, Ercan Haslofça2
1Ege University,
Faculty of Sport Sciences, Izmir, Turkey
2European University of Lefke,
School of Physical Education and Sports, Lefke, TRNC
Abstract:
In order to monitor training effects and physical developments in elite sports, it may be beneficial to perform anthropometric measurements and physical fitness tests regularly. In this study, the relationship between the anthropometric properties and physical fitness values of elite figure skating athletes were investigated. 21 elite athletes in the 11-16 age group, female (n=12) and male (n=9), participated in the study. Anthropometric measurements were taken in accordance with The International Society for the
Advancement of Kinanthropometry (ISAK) protocol. Σ6 and Σ8 skinfold thickness, body
fat ratio (BF%), body mass index (BMI), Manouvrier Index (MI), waist/hip ratio and somatotype components in girls Group II, III and in boys Group II were calculated. Also, balance, flexibility, handgrip strength, vertical jump, agility, medicine ball overhead back throw, speed, and endurance tests were applied to all groups. Descriptive statistical analyzes were made using the IBM SPSS 25.0 statistics program. The relationship between variables was calculated by the Pearson Correlation coefficient. The significance level was taken as p<0.01 and p<0.05. In boys, body weight, body height and arm span, sitting height, BMI, humerus breadth and foot length were observed to be associated with all physical fitness parameters (p<0.01, p<0.05), except balance and agility; Girth measurements were related to handgrip strength, vertical jump, overhead medicine ball backward throw, speed and endurance (p<0.01, p<0.05). Negative relationships of the endomorphic feature with flexibility and endurance were determined (p<0.05). In girls, it
i This article was presented as an oral presentation at the 17th International Sport Sciences Congress held
in Antalya/Turkey on 13-16 November 2019.
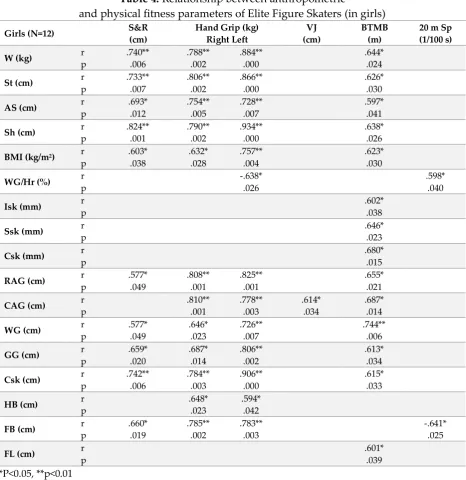
was found that body weight, body height, and arm span, sitting height and BMI were related to flexibility, handgrip strength, medicine ball overhead back throw (p<0.01, p<0.05); girth measurements were found to be related to flexibility, handgrip strength, vertical jump, overhead medicine ball back throw (p<0.01, p<0.05); also, significant correlations (p<0.01, p<0.05) were found between the handgrip strength and breadth measurements. Assessment of the relationship between morphological features and motor skills with specific field tests and standardized tests performed at regular intervals in athletes can contribute to the athletes' selection and training planning of the relevant federations and orientating towards their goals.
Keywords: physical characteristics, physical fitness, figure skating
1. Introduction
Elite sports performance is a result of the interaction between genetic structure and training factors. Accordingly, management systems that facilitate both talent determination and optimal training are very important in sportive success (Tucker, & Collins, 2012).
Figure skating is a technical and aesthetic sport applied in different age categories, levels, and disciplines (singles, pairs, ice dance with different body difficulties, synchronized), accompanied by music (Kutlay, & Güner, 2018). As it is one of the early specialized sports (American Academy of Pediatrics (AAP), 2000); monitoring training effects and physical developments, performing and evaluating anthropometric measurements and physical fitness tests regularly in and out of the group comparisons may be useful for performance monitoring.
Physical morphology or physical structure, body weight or composition, body size, and shape are important to optimize performance in many sports (Slater, O'Connor, & Kerr, 2018; Durakovic, 2012). Body height and body weight have been demonstrated to affect performance in rotational movements (Ackland, Elliott, & Richards, 2003). The physical size of the body can have biomechanical effects in the figure skating; acceleration, stopping, tossing, skidding, lifting, rotating, etc. In order to make a good impression on the spectators, physical appearance is also considered to be important. In this sport, studies are also showing nutritional disorder behaviors for bodyweight control (Dwyer, Eisenberg, Prelack, Song, Sonneville, & Ziegler, 2012; Voelker, Gould, & Reel, 2014).
In figure skating, jumping difficulties, rotational movements, different stepping patterns, and movement connections require adaptation to the partner surface and music, and these take long training hours, and years. Trainings outside the ice also support movement difficulties in ice. To perform the desired elements on ice, athletes also participate in fitness programs that include strength, agility, and flexibility (Slater, Vriner, Zapalo, Arbour, & Hard, 2016). Long flight phases during which technical elements are performed, explosive power and also speed of the lower extremity muscles are needed and the execution of these elements, in turn, require excellent motor coordination and postural control (Mostaert, Deconinck, Pion, & Lenoir, 2016).
If the components of physical fitness are insufficient, the risk of injury (acute and overuse) may increase. The most common injury in singles and pairs discipline was observed in the lumbar region (low back pain) (13% of all injuries), and these injuries were more common in young athletes than in adults (Dubravcic-Simunjak, Pecina, Kuipers, Moran, & Haspl, 2003; Dubravcic-Simunjak, Kuipers, Moran, Pecina, Simunjak, Ambartsumov, Sakai, Mitchel, & Shobe, 2008). Physical fitness tests assist the trainer and athlete in determining the weak features of the athlete and taking precautions. In this study, the physical properties of the figure skaters and their physical fitness parameters were examined.
2. Material and Methods
2.1. Participants
Measurements were conducted in Gebze Olympic Ice-skating Rink’ halls in national team
candidate camp organized in 2018 by Turkey Ice Skating Federation and 24 elite athletes (9-22 years) were participated. Three athletes were excluded from the study because their numbers were insufficient in age groups. In this study (11-16 years) (decimal age calculated), 12 girls and 9 boys (N = 21) athletes were included and three different age groups were determined for girls, and two for boys. The athletes and their families were informed about applied measurements requested by Turkey Ice Skating Federation and their written consent was taken.
2.2. Tools and Procedure
Anthropometric measurements (Restricted profile-17 parameters, bolded in tables) were made in accordance with the ISAK protocol (Marfell-Jones, Olds, Stewart, & Carter, 2007) and by ISAK accredited Retired-Level III anthropometrist, at the beginning of the season and in the morning. Body weight (BW) was measured through a scale with a sensitivity of 0.1kg, stature (St) was measured by a stadiometer with a sensitivity of 0.1 cm (Mesilife MR 200), sitting height (Sh) and arm span (AS) were measured with a sensitivity of 0.1 cm.
contracted), waist (WG), gluteal (GG) (hip) and calf (CG) girths were measured with a steel anthropometric tape (Cescorf Brasil, 0.1 cm distinction). The breadths of Humeral (HB) and Femoral (FB) were measured with a small caliper and foot length was measured with a large caliper (Holtain Ltd., UK). Measurements were performed at the right side of the body.
By using Microsoft Office Excel 2007 program, data recording and consistency
between measurements were ensured. Skinfold thicknesses of Σ6 (Tsk + Sbsk + Ssk + Ask + Tsk + Csk) and Σ8 (Tsk + Sbsk + Bsk + Isk + Ssk + Ask + Tsk + Csk), body mass index (BMI) was determined using the following formula: [(Body weight (kg) / height (m2)], percentage of body fat ratio (%BF) (Slaughter, Lohman, Boileau, Horswill, Stillman, Van Loan, & Bemben, 1988), Manouvrier Index (MI) was determined using the following formula: (Stature – Sitting Height / Sitting Height)x100, waist/hip ratio, somatotype components (Lindsay Carter, & Honeyman Heath, 1990) were calculated in Group II and III in girls and Group II in boys.
Physical fitness tests were performed on all groups on the same day after a mild warm-up (15 min - cardiovascular exercises and stretching). Flamingo balance, sit and reach, and handgrip strength tests were performed with the Eurofit test battery protocol (Council of Europe, 1988). For the flamingo test, both feet (on one foot flamingo board, the other foot bent at the knee and holding the ankle with the hand on the same side), the number of falls within a minute was evaluated (n / the 60s), trunk and hamstring flexibility were assessed using the sit and reach test to the nearest 0.5 cm (the best result from two measurements was evaluated) and the handgrip strength test were measured with the hand dynamometer (1 kg precision, Baseline), both hands were measured twice and the best result was evaluated.
Vertical jump was performed with the Opto Jump Test Protocol (0,1 cm precision) (OptoJump, 2020) and the best out of three measurements were evaluated; agility test was applied with Pro Agility Test Protocol (5-10-5 shuttles) (Harman, Garhammer, & Pandorf, 2000) and the better of two measurements were evaluated; the 20 m sprint test was measured 2 times with a 2-minutes intervals, starting from 50 cm behind the start line and starting from the standing position. The photocell stopwatch with a sensitivity of 1/100 sec was used in the measurements and the best result was evaluated. Microgate-Witty (Italy) devices were used in the tests.
In throwing medicine ball backward test, three shots were applied and the best result was evaluated (for 9-11 years old girl-boy 1 kg, for 12-14 years old girls and boys 2 kg, for 15-16 years old girls and boys 2 kg for 15 and older boys 3 kg medicine ball was used).
according to the total shuttle numbers, maximum oxygen utilization capacity (VO2max) values were calculated indirectly (Ramsbottom, Brewer, & Williams, 1988).
2.3. Statistical Analysis
Descriptive statistical analyzes were made using the IBM SPSS 25.0 statistics program. The relationship between variables was calculated with the Pearson Correlation coefficient (r). The significance level was taken as p<0.01 and p<0.05.
3. Results
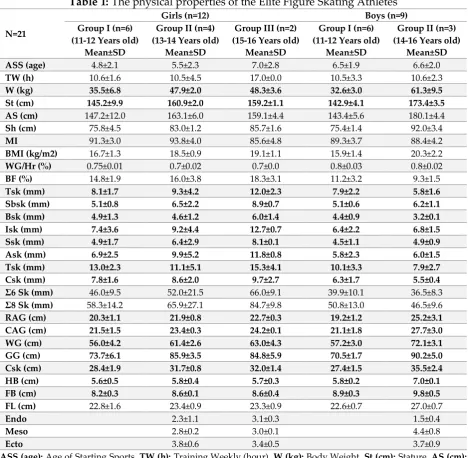
Table 1: The physical properties of the Elite Figure Skating Athletes
N=21
Girls (n=12) Boys (n=9)
Group I (n=6) (11-12 Years old)
Mean±SD
Group II (n=4) (13-14 Years old)
Mean±SD
Group III (n=2) (15-16 Years old)
Mean±SD
Group I (n=6) (11-12 Years old)
Mean±SD
Group II (n=3) (14-16 Years old)
Mean±SD
ASS (age) 4.8±2.1 5.5±2.3 7.0±2.8 6.5±1.9 6.6±2.0
TW (h) 10.6±1.6 10.5±4.5 17.0±0.0 10.5±3.3 10.6±2.3
W (kg) 35.5±6.8 47.9±2.0 48.3±3.6 32.6±3.0 61.3±9.5
St (cm) 145.2±9.9 160.9±2.0 159.2±1.1 142.9±4.1 173.4±3.5
AS (cm) 147.2±12.0 163.1±6.0 159.1±4.4 143.4±5.6 180.1±4.4
Sh (cm) 75.8±4.5 83.0±1.2 85.7±1.6 75.4±1.4 92.0±3.4
MI 91.3±3.0 93.8±4.0 85.6±4.8 89.3±3.7 88.4±4.2
BMI (kg/m2) 16.7±1.3 18.5±0.9 19.1±1.1 15.9±1.4 20.3±2.2
WG/Hr (%) 0.75±0.01 0.7±0.02 0.7±0.0 0.8±0.03 0.8±0.02
BF (%) 14.8±1.9 16.0±3.8 18.3±3.1 11.2±3.2 9.3±1.5
Tsk (mm) 8.1±1.7 9.3±4.2 12.0±2.3 7.9±2.2 5.8±1.6
Sbsk (mm) 5.1±0.8 6.5±2.2 8.9±0.7 5.1±0.6 6.2±1.1
Bsk (mm) 4.9±1.3 4.6±1.2 6.0±1.4 4.4±0.9 3.2±0.1
Isk (mm) 7.4±3.6 9.2±4.4 12.7±0.7 6.4±2.2 6.8±1.5
Ssk (mm) 4.9±1.7 6.4±2.9 8.1±0.1 4.5±1.1 4.9±0.9
Ask (mm) 6.9±2.5 9.9±5.2 11.8±0.8 5.8±2.3 6.0±1.5
Tsk (mm) 13.0±2.3 11.1±5.1 15.3±4.1 10.1±3.3 7.9±2.7
Csk (mm) 7.8±1.6 8.6±2.0 9.7±2.7 6.3±1.7 5.5±0.4
Σ6 Sk (mm) 46.0±9.5 52.0±21.5 66.0±9.1 39.9±10.1 36.5±8.3
Σ8 Sk (mm) 58.3±14.2 65.9±27.1 84.7±9.8 50.8±13.0 46.5±9.6
RAG (cm) 20.3±1.1 21.9±0.8 22.7±0.3 19.2±1.2 25.2±3.1
CAG (cm) 21.5±1.5 23.4±0.3 24.2±0.1 21.1±1.8 27.7±3.0
WG (cm) 56.0±4.2 61.4±2.6 63.0±4.3 57.2±3.0 72.1±3.1
GG (cm) 73.7±6.1 85.9±3.5 84.8±5.9 70.5±1.7 90.2±5.0
Csk (cm) 28.4±1.9 31.7±0.8 32.0±1.4 27.4±1.5 35.5±2.4
HB (cm) 5.6±0.5 5.8±0.4 5.7±0.3 5.8±0.2 7.0±0.1
FB (cm) 8.2±0.3 8.6±0.1 8.6±0.4 8.9±0.3 9.8±0.5
FL (cm) 22.8±1.6 23.4±0.9 23.3±0.9 22.6±0.7 27.0±0.7
Endo 2.3±1.1 3.1±0.3 1.5±0.4
Meso 2.8±0.2 3.0±0.1 4.4±0.8
Ecto 3.8±0.6 3.4±0.5 3.7±0.9
ASS (age): Age of Starting Sports, TW (h): Training Weekly (hour), W (kg): Body Weight, St (cm): Stature, AS (cm):
Arm Span, Sh (cm): Sitting Height, MI: Manouvrier Index, BMI: Body Mass Index (Body Weight (kg) / Height (m2),
WG/Hr (%): Waist / Hip ratio, BF (%): Percentage of Body Fat, Tsk (mm): Triceps skinfold, Sbsk (mm): Subscapular skinfold, Bsk (mm): Biceps skinfold, Isk (mm): Iliac Crest skinfold, Ssk (mm): Supraspinale skinfold, Ask (mm):
skinfolds (Tsk + Sbsk + Ssk + Ask + Tsk + Csk), Σ8 Sk (mm): The sum of eight skinfolds (Tsk + Sbsk + Bsk + Isk + Ssk + Ask + Tsk + Csk), RAG (cm): Arm Girths. (Relaxed), CAG (cm): Arm Girths. (Flexed and tensed), WG (cm): Waist Girths (minimum), GG (cm): Gluteal (hips) Girths, Csk (cm): Calf Girths (maximum), HB (cm): Humeral Breadths, FB (cm): Femoral Breadths, FL (cm): Foot Length, Endo: Endomorphy, Meso: Mesomorphy, Ecto: Ectomorphy.
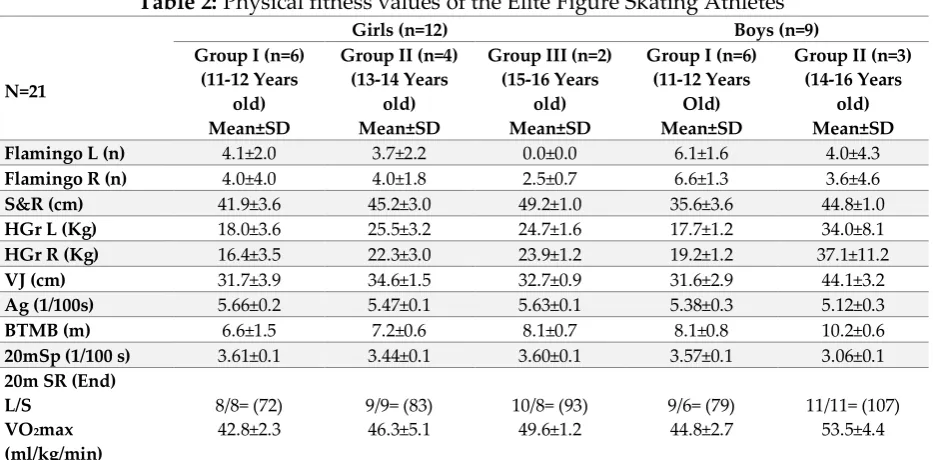
The physical features of the athletes participating in the research are given in Table 1 and the physical fitness values are given in Table 2.
Table 2: Physical fitness values of the Elite Figure Skating Athletes
N=21
Girls (n=12) Boys (n=9)
Group I (n=6) (11-12 Years
old) Mean±SD
Group II (n=4) (13-14 Years
old) Mean±SD
Group III (n=2) (15-16 Years
old) Mean±SD
Group I (n=6) (11-12 Years
Old) Mean±SD
Group II (n=3) (14-16 Years
old) Mean±SD
Flamingo L (n) 4.1±2.0 3.7±2.2 0.0±0.0 6.1±1.6 4.0±4.3
Flamingo R (n) 4.0±4.0 4.0±1.8 2.5±0.7 6.6±1.3 3.6±4.6
S&R (cm) 41.9±3.6 45.2±3.0 49.2±1.0 35.6±3.6 44.8±1.0
HGr L (Kg) 18.0±3.6 25.5±3.2 24.7±1.6 17.7±1.2 34.0±8.1
HGr R (Kg) 16.4±3.5 22.3±3.0 23.9±1.2 19.2±1.2 37.1±11.2
VJ (cm) 31.7±3.9 34.6±1.5 32.7±0.9 31.6±2.9 44.1±3.2
Ag (1/100s) 5.66±0.2 5.47±0.1 5.63±0.1 5.38±0.3 5.12±0.3
BTMB (m) 6.6±1.5 7.2±0.6 8.1±0.7 8.1±0.8 10.2±0.6
20mSp (1/100 s) 3.61±0.1 3.44±0.1 3.60±0.1 3.57±0.1 3.06±0.1
20m SR (End) L/S
VO2max
(ml/kg/min) 8/8= (72) 42.8±2.3 9/9= (83) 46.3±5.1 10/8= (93) 49.6±1.2 9/6= (79) 44.8±2.7 11/11= (107) 53.5±4.4
Flamingo L (60sec/n): Flamingo Balance Left, Flamingo R: Flamingo Balance Right, S&R (cm): Sit and Reach (Flexibility), HGr L (kg): Hand Grip Left, HGr R (kg): Hand Grip Right, VJ (cm): Vertical Jump, Ag
(1/100sec): Agility, BTMB (m): Backward Throwing Medicine Ball, 20mSp (1/100 sec): 20m Sprint, 20mSR
(Endurance): 20m Shuttle Run, L/S: Level/Step (Number of shuttle), VO2max (ml/kg/min): Maximum
Oxygen Consumption
In boys, body weight, body height and arm span, sitting height, BMI, humerus diameter, and foot length are associated with all physical fitness parameters except balance and agility. Girth measurements were related to handgrip strength, vertical jump, Backward Throwing Medicine Ball, sprint and endurance (p<0.01, p<0.05), and the endomorphic feature were found to have significant negative relationships (p<0.05) with flexibility and endurance (Table 3).
Table 3: Relationship between anthropometric and
physical fitness parameters of Elite Figure Skaters (in boys)
Boys N=9 S&R (cm)
Hand Grip (kg) Right Left VJ (cm) Agility (1/100 sec) BTMB (m)
20 m Sp (1/100 s)
VO2max
(ml/kg/min)
W (kg) r
p .719* .029 .943** .000 .981** .000 .921** .000 .777* .014 -.895** .001 .846** .004
St (cm) r
p .796* .010 .869** .002 .923** .000 .750* .020 -.948** .000 .796* .010
AS (cm) r
Sh (cm) r p .849** .004 .880** .002 .943** .000 .922** .000 .817** .007 -.925** .000 .833** .005 BMI (kg/m2)
r p .894** .001 .915** .001 .823** .006 .698* .036 -.730* .025 .763* .017
BF (%) r
p
-.707* .033
Tsk (mm) r
p -.765* .016 Sbsk (mm) r p .769* .016 .782* .013
Bsk (mm) r
p -.676* .046 -.701* .035 .771* .015 -.689* .040
Tsk (mm) r
p
-.721* .028
Csk (mm) r
p
-.670* .048
RAG (cm) r
p .965** .000 .968** .000 .890** .001 .770* .015 -.801** .009 .847** .004
CAG (cm) r
p .930** .000 .934** .000 .889** .001 .721* .028 -.818** .007 .790* .011
WG (cm) r
p .897** .001 .920** .000 .863** .003 .723* .028 -.799** .010 .801** .010
GG (cm) r
p .744* .021 .923** .000 .970** .000 .918** .000 .772* .015 -.909** .001 .846** .004
Csk (cm) r
p .732* .025 .886** .001 .943** .000 .932** .000 .781* .013 -.907** .001 .792* .011
HB (cm) r
p .682* .043 .827** .006 .885** .002 .900** .001 .697* .037 -.906** .001 .739* .023
FB (cm) r
p
.747* .021
-.738 .023
FL (cm) r
p .689* .040 .887** .001 .932** .000 .857** .003 .685* .042 -.868** .002 .771* .015
Endo r
p -.751* .020 -.687* .041 *P<0.05; **p<0.01
W (kg): Body Weight, St (cm): Stature, AS (cm): Arm Span, Sh (cm): Sitting Height, BMI: Body Mass Index (Body Weight (kg) / Height (m2), BF (%): Percentage of Body Fat, Tsk (mm): Triceps skinfold, Sbsk (mm): Subscapular skinfold, Bsk (mm): Biceps skinfold, Tsk (mm): Front Thigh skinfold, Csk (mm): Medial Calf skinfold, RAG (cm): Arm Girths. (Relaxed) (cm), CAG (cm): Arm Girths. (Flexed and tensed) (cm), WG (cm): Waist Girths (minimum), GG (cm):
Gluteal (hips) Girths, Csk (cm): Calf Girths (maximum), HB (cm): Humeral Breadths, FB (cm): Femoral Breadths, FL (cm): Foot Length, Endo: Endomorphy. S&R (cm): Sit and Reach (Flexibility), VJ (cm): Vertical Jump, BTMB (m):
Throwing a Medicine Ball Backward, 20mSp (1/100s): 20m Sprint, VO2max (ml/kg/min): Maximum Oxygen
Consumption
Table 4: Relationship between anthropometric
and physical fitness parameters of Elite Figure Skaters (in girls)
Girls (N=12) S&R (cm)
Hand Grip (kg) Right Left
VJ (cm)
BTMB (m)
20 m Sp (1/100 s)
W (kg) r
p .740** .006 .788** .002 .884** .000 .644* .024
St (cm) r
p .733** .007 .806** .002 .866** .000 .626* .030
AS (cm) r
p .693* .012 .754** .005 .728** .007 .597* .041
Sh (cm) r
p .824** .001 .790** .002 .934** .000 .638* .026
BMI (kg/m2) r
p .603* .038 .632* .028 .757** .004 .623* .030
WG/Hr (%) r
p
-.638* .026
.598* .040
Isk (mm) r
p
.602* .038
Ssk (mm) r
p
.646* .023
Csk (mm) r
p
.680* .015
RAG (cm) r
p .577* .049 .808** .001 .825** .001 .655* .021
CAG (cm) r
p .810** .001 .778** .003 .614* .034 .687* .014
WG (cm) r
p .577* .049 .646* .023 .726** .007 .744** .006
GG (cm) r
p .659* .020 .687* .014 .806** .002 .613* .034
Csk (cm) r
p .742** .006 .784** .003 .906** .000 .615* .033
HB (cm) r
p
.648* .023
.594* .042
FB (cm) r
p .660* .019 .785** .002 .783** .003 -.641* .025
FL (cm) r
p
.601* .039
*P<0.05, **p<0.01
W (kg): Body Weight, St (cm): Stature, AS (cm): Arm Span, Sh (cm): Sitting Height, BMI: Body Mass Index (Body Weight (kg) / Height (m2), WG/Hr (%): Waist / Hip ratio, Isk (mm): Iliac Crest skinfold, Ssk (mm): Supraspinale skinfold, Csk (mm): Medial Calf skinfold, RAG (cm): Arm Girths. (Relaxed), CAG (cm): Arm Girths. (Flexed and tensed), WG (cm): Waist Girths (minimum), GG (cm): Gluteal (hips) Girths, Csk (cm): Calf Girths (maximum), HB (cm): Humeral Breadths, FB (cm): Femoral Breadths, FL (cm): Foot Length, S&R (cm): Sit and Reach (Flexibility), VJ (cm): Vertical Jump, BTMB (m): Backward Throwing a Medicine Ball, 20mSp (1/100 sec): 20m Sprint (1/100 sec)
4. Discussion
specific reference values. In studies conducted in this sport with standard tests (Slater, et al., 2016; Mostaert, Deconinck, Pion, & Lenoir, 2016; Bower, Kraemer, Potteiger, Volek, Hatfield, Vingren, Spiering, Fragala, Ho, Thomas, Earp, Häkkinen, & Maresh, 2010), Eurofit test battery and sports-specific tests were used.
In a comprehensive study conducted in different disciplines (singles, pairs, ice dance, synchronized) and levels (novice, junior and senior) (10-33 years old, N=347) (Slater, et al., 2016); hexagon test, t-test, maximal vertical jump test, alternating triple bound jump, tuck jumps, push-ups, v-ups, hand press, front split, flexibility (sit and reach) and balance (stork pose) tests were performed.
In another study conducted on elite figure skaters (9-12 years old girls, N=11) (Mostaert, et al., 2016); sit and reach and shoulder rotation flexibility, handgrip strength, maximum counter-movement jump, standing long jump, 10x5m running, 30m sprint, body coordination test (Körperkoordinationstest für kinder) and sports-specific tests; front and side split flexibility and spin jump (jump height, rotation speed) tests were performed. When compared with the tests and age group (Group I) matching our study; body weight, body height, sitting height mean values were compatible, flexibility and vertical jump values were better in our athletes, and handgrip strength values are lower. The reason why vertical jump values are better in those who participated in our study may be due to the fact that we used arm swing during the test. In the same study (Mostaert, et al., 2016), BF % values could not be compared with our data since it was determined by Bioelectrical Impedance Analysis method.
In addition, according to the European normative values (non-athletes) aged 9-17 (Tomkinson, Carver, Atkinson, Daniell, Lewis, Fitzgerald, Lang, & Ortega, 2018), it was observed that the balance and flexibility test values (in the groups of girls and boys) in the 90th and 95th percentiles (better) and the values of handgrip strength were close to the average values (40th and 50th percentiles).
When the values of the figure skating athletes participating in this study and the non-athlete Turkish population values (Neyzi, Günöz, Furman, Bundak, Gökçay,
Darendeli, & Baş) were compared to the values in the 25th and 50th percentiles of body weight values, and the 50th percentile of their body height, BMI was found to be close to the 25th percentile. Another study found that, figure skating athletes were shorter than healthy reference population values and had a lower body weight and body fat ratio (Mostaert, et al., 2016). The waist girths of our athletes were found to be lower than the study data (at matched ages) in the non-athlete Turkish population (Hatipoğlu, Öztürk, Mazıcıoğlu, Kurtoğlu, Seyhan, & Lokoğlu, 2008). In a study on arm span (Mazıcıoğlu, Hatipoğlu, Öztürk, Gün, Üstünbaş, & Kurtoğlu, 2009), the mean values found in the ages
matching our study are generally consistent, but in Group III for girls and in boys Group II are slightly different. Different growth rate stages and training features or different measurement methods can create these differences.
strength of the participants in our study were found to be similar, and it was observed that body weight, BMI, skinfold thickness values were lower, and vertical jump and flamingo test values were better.
In this study, agility test mean values were found as 5.66±0.2 sec in Group I for girls, 5.47±0.1 sec in Group II and 5.63±0.1 sec in Group III; and 5.38±0.3 sec in Group I for boys and 5.12±0.3 sec in Group II. When the same agility test values are examined in studies conducted in different sports branches; the values were found as 5.46±0.4 sec for boys athletes aged 14-16 (n=16) and 5.11±0.3 sec for basketball players (n=19) (Kamiş,
Pekel, & Aydos, 2018), 5,63±0,4 sec for 1 year old judoists (age: 13.35±1 years, n=20) (Peker, Kaya, & Zengin, 2017), 5.47±0.4 sec for 13-16 age wrestlers (n=480) (Bayraktar, 2017), 5.18±0.4 sec for girls 12-13 years old in football (n=79), and 4.92±0.24 sec in girls aged 14-17 (n=223) (Brown, & Vescovi, 2019). According to these results, it was observed that the agility features of football player girls are better than the results of this research, while the other values are close. Different training patterns and physical properties can cause these differences.
In our study, mean test values of 20m sprint were 3.61±0.1 s in Group I, 3.44±0.1 s in Group II and 3.60±0.1 s in Group III for girls; and 3.57±0.1 sec in Group I and 3.06±0.1 sec in Group II for boys. In the study of creating norms in Turkey in 2010, these values were 4.35±0.4 sec in girls aged 11 (n=680), 4.23±0.3 sec in girls aged 12 (n=680); 4.12±0.3 sec in 11 years old boys (n=680), and 4.08±0.2 sec in 12 years old boys (n=680) (Bayraktar, Pekel, Yaman, & Aydos, 2010). 3.41±0.22 sec for male wrestlers aged 13-15 (n=25), 3.56±0.23 sec for handball players (n=26) (Buyer, & Huge, 2015); It has been determined as 3.60±0.26 sec for girls (n=51) and 3.66±0.45 sec for boys (n=42) (Nalbant, 2018). 20m test values in our study, in girls and boys in the 11-12 years, was found to be better from Turkey norm value of the average (non-active). In the 13-15 age range, the results of girls in our study are similar to those of basketball players, whereas, in boys, the values of the athletes in our study are better than other branch athletes. It is noteworthy that 14-16-year-old male elite figure skating athletes are faster than male basketball players and handball players of similar ages.
arm girth values was better in our athletes. Genetic factors, different training patterns and measurement techniques can cause these differences.
It has been determined that foot length is associated with more parameters in male athletes than female athletes (Table 3, 4).
Somatotype features may change with growth, age, exercise, and nutrition (Carter, 1996). The ectomesomorphic feature was observed in elite female athletes aged 15,7 years (n=18) and their endomorphy, mesomorphy, and ectomorphy values were 2.6-3.8-3.0 (Faulkner, 1976), respectively. Another study in the 15.6±2.4 age group (n=60) was found to be 3.1-3.4-3.0 (Monsma, & Malina, 2005). In our study, in the group III (15-16 age group in girls), these values were determined as 3.1-3.0-3.4 (Table 1) and it was observed that they were compatible with the previous studies, but the mesomorphic value was found to be slightly low. There is a need for studies with more athletes who are followed up for a long time in different disciplines and levels.
The development of the motor skills required for the perfect execution of movement difficulties is generally done in preparatory period training. Agility, power, and flexibility performance may vary depending on discipline and athlete levels. Although the strength of the lower limb muscles is prominent in figure skating, the strength of the upper limb muscles is also needed to maintain positions in complex lifts (ice dance and pairs discipline). Supportive workouts (conditioning) are required at singles, ice dances, and pairs at all levels (Slater, et al., 2016). Core-strength exercises has been shown to have a positive effect on jumps (Bingül, 2017). Properly individualized fitness programs can support performance while reducing the risk of injury.
Increasing the training capacity, recovery after fatigue, and the ability to successfully maintain the technical value and features of the movements until the end of the choreography on ice is also associated with the athlete's endurance ability. In this study, when 20m Shuttle Run test values are examined; it has been observed that the level and step average values (Table 2), which correspond to the total shuttle number of our athletes, are at a “very good” level according to international norms (active athletes) (7/5 -9/3 for girls, 8/9-10/9 for boys, aged 12-13; 8/8-10/7 for girls, 9/9 12/2 for boys, aged 14-15; 9/8-11/10 for girls, 11/4-13/7 for boys, aged 16-17) (Topendsports, 2019).
In the figure skating, it was stated that the tests applied to the athletes should be distinctive, it has been argued that the handgrip force and the countermovement jump test (CMJ) (whereas in this sport, the jumps are usually done with the swing of the arms) cannot be sport-specific tests when anthropometric measurements and physical fitness tests are compared; the importance of motor coordination tests has been emphasized (Mostaert, et al., 2016).
5. Conclusion
physical fitness parameters. In terms of gender, it was observed that boys were associated with more physical fitness parameters than girls, and the relationships between skinfold thickness and physical fitness parameters were also higher in male athletes.
6. Recommendations
During the selection process of young elite ice-skating athletes, their capacity to learn new motor skills should be emphasized. Also, the relationships of tests performed on ice or land can be explored. In addition to the standard tests to be carried out at certain intervals in athletes, evaluation of the relations between morphological features and motor abilities with sports-specific tests may contribute to the selection of athletes and training plans of the federations. With this understanding, training and competition goals can be directed correctly. Federations should take into account such studies and take part in annual activity programs and also allocate budgets for them.
Acknowledgements
We would like to thank Figure Skating Turkish National Team nominated athletes and coaches who voluntarily participated in our study, Turkey Ice Skating Federation for permission on measurements during National Team Candidates Camp, Kocaeli Youth Services and Sports Provincial Directorate for supporting us with technical equipment and technical staff.
About the Authors
Dr. Emine Kutlay is researching in the field of Sports Health Sciences (physical fitness, kinanthropometry, sports nutrition). She is a Level III Anthropometrist (retired), accredited by ISAK, Application area Rhythmic Gymnastics Trainer and International Judge.
Dr. Fehime Haslofça is researching in the field of Physical Education and Sports Teaching (motivational climate, physical fitness). Application area 3rd Level Athletics and Artistic Gymnastics Trainer, International Athletics Referee.
Dr. Ercan Haslofça is researching in the field of Movement and Training Sciences (physical fitness, talent selection, kinesiology). Application area 5th Level Athletics Trainer and International Athletics Referee.
References
Ackland T, Elliott B, Richards J, 2003. Growth in Body Size Affects Rotational
Performance in Women’s Gymnastics. Sports Biomechanics, 2(2):163-176. doi: 10.1080/14763140308522815 PMID: 14737925
Fiziksel ve Fizyolojik Parametrelerinin Karşılaştırılması. Uluslararası İnsan
Bilimleri Dergisi, Volume: 12 Issue: 1.
American Academy of Pediatrics (AAP), 2000. Pediatrics. Volume 106 Issue: 1
Armstrong N, Tomkinson G, Ekelund U, 2011. Aerobic Fitness and Its Relationship to Sport, Exercise Training and Habitual Physical Activity During Youth. Br J Sports Med,45: 849-58.
Barton T, Hunter J, Williams D, McGrigor J, Slaght A, 2012. Long Term Athlete Development Implementation Plan. Skate Canada-BC/YT.
Bayraktar I, 2017. Agility and Speed Standards for Student Teenager Wrestlers. Universal Journal of Educational Research, 5(4): 558.
Bayraktar I, Pekel HA, Yaman M, Aydos L, 2010. Atletizmde Türkiye Norm Değerleri, Ata Ofset Matbaacılık, 2010 Ankara, 76-77.
Bingül BM, Akdeniz H, Töre ÖA, Aydın M, 2017. Kor Bölgesi Antrenmanlarının Artistik Buz Pateninde Loop ve Toe Loop Sıçramalarındaki Alt Extremite Kinematiğine
Etkisi. Niğde Üniversitesi Beden Eğitimi ve Spor Bilimleri Dergisi. Cilt 11, Sayı 2, 188-194.
Bower ME, Kraemer WJ, Potteiger JA, Volek JS, Hatfield DA, Vingren JL, Spiering BA,
Fragala MS, Ho JY, Thomas GA, Earp JE, Häkkinen K, Maresh CM, 2010. Relationship between Off-Ice Testing Variables and On-Ice Speed in Women's Collegiate Synchronized Figure Skaters: Implications for Training. J Strength Cond Res, 24(3): 831-9.
Brown TD, Vescovi JD, 2008. Comparison of agility and countermovement jump performance among middle school, high school, and college aged female soccer players.
https://www.researchgate.net/publication/270160256_Comparison_of_agility_an d_countermovement_jump_performance_among_middle_school_high_school_a
nd_college_aged_female_soccer_players. Accessed: 12 December 2019.
Carter L, 1996. Somatotyping, in: Anthropometrica, Edited by: Kevin Norton&Tim Olds, UNSW press, Australia, p.148.
Council of Europe, 1988. Eurofit: handbook for the Eurofit tests of physical fitness. Rome: Council of Europe.
Dubravcic-Simunjak S, Kuipers H, Moran J, Pecina M, Simunjak B, Ambartsumov R, Sakai H, Mitchel D, Shobe J, 2008 Stress Fracture Prevalence in Elite Figure Skaters. J Sports Sci Med 7: 419–420.
Dubravcic-Simunjak S, Pecina M, Kuipers H, Moran J, Haspl M, 2003. The Incidence of Injuries in Elite Junior Figure Skaters. Am J Sports Med 31: 511–517.
Durakovic MM, 2012. Anthropometry in premenarcheal female esthetic sports athletes and ballerinas. Handbook of Anthropometry, pp 1817-1836.
Faulkner R A, 1976. Physique characteristics of Canadian figure skaters, Master of Science (Kinesiology), Simon Fraser University.
Harman E, Garhammer J, Pandorf C, 2000. Administration, scoring and interpretation of selected tests. In: Baechle TR, Earle RW, eds. Essentials of strength and conditioning. Champaign, IL: Human Kinetics, 249–292.
Haslofça F, Kutlay E, Haslofça E, 2017. Analysis of Three Decade Changes in Physical Fitness Characteristics of Turkish Children Aged Between 11 and 12, Turkish Journal of Sports Medicine 52(4): 137-145, doi:10.5152/tjsm.2017.081.
Hatipoğlu N, Öztürk A, Mazıcıoğlu MM, K urtoğlu S, Seyhan S, Lokoğlu F, 2008. Waist
Circumference Percentiles for 7- to 17- year-old Turkish Children and Adolescents. 167(4): 383-389. doi: 10.1007/s00431-007-0502-3.
Kamiş O, Pekel HA, Aydos L, 2018. Kısa Mesafe Koşucuları ve Basketbolcularda Kor
Stabilite ve Atletik Performans Arasındaki İlişki. Spormetre, 16 (1), p. 89.
Kemper HCG, Van Mechelen W, 1996. Physical fitness testing of children: a European perspective. Pediatr Exerc Sci1996; 8:201-14.
Kutlay E, Güner G, 2018. Elit Kadın Artistik Buz Pateni Sporcularının Fiziksel Özellikleri, Spor Bilimleri Kongresi, Kongre Kitabı, Antalya.
Léger LA, Mercier D, Gadoury C, Lambert J, 1988. The multistage 20-meter shuttle run test for aerobic fitness. J Sports Sci; 6:93–101.
Lindsay Carter JE, Honeyman Heath B, 1990. Somatotyping: Development and Applications (Cambridge Studies in Biological Anthropology vol. 5). Cambridge: Cambridge University Press.
Marfell-Jones MJ, Olds T, Stewart AD, Carter L, 2007. International standards for Anthropometric Assessment. Potchefstroom, South Africa.
Mazıcıoğlu MM, Hatipoğlu N, Öztürk A, Gün İ, Üstünbaş HB, Kurtoğlu S, 2009. Age
references for the arm span and stature of Turkish children and adolescents. Annals of Human Biology, 36 (3):308-319.
Monsma EV, Malina RM, 2005. Anthropometry and Somatotype of Competitive Female Figure Skaters 11-22 years Variation by Competitive Level and Discipline, Journal of Sports Medicine and Physical Fitness. 45, 4:491-500.
Mostaert M, Deconinck F, Pion J, Lenoir M, 2016. Anthropometry, Physical Fitness and Coordination of Young Figure Skaters of Different Levels. Int J Sports Med; 37:531 538.
Nalbant Ö, 2018. 13-14 Yaş Kız veErkek Basketbolcuların Fiziksel ve Kondisyonel Özelliklerinin Karşılaştırılması. Spormetre, 16 (1), p.55-60.
Neyzi O, Günöz H, Furman A, Bundak R, Gökçay G, Darendeliler F, Baş F, 2008. Türk Çocuklarında Vücut Ağırlığı, Boy Uzunluğu, Baş Çevresi ve Vücut Kitle İndeksi Referans Değerleri, Çocuk Sağlığı ve Hastalıkları Dergisi, 51:1-14.
OptoJump, Applications, Test-Typologies, Squat-Jump
http://www.optojump.com/Applications/Test-Typologies/Squat-Jump.aspx.
Ortega FB, Ruiz JR, Castillo MJ, Sjostrom, M, 2008. Physical Fitness in Childhood and Adolescence: A Powerful Marker of Health. Int J Obese, 32:1–11.
Peker AT, Kaya E, Zengin S, 2017. Çocuk Judocularda Çeviklik ile Denge Performansı Arasındaki İlişkinin İncelenmesi, Uluslararası Spor Bilimleri Dergisi / Cilt: 3 Sayı:1, s.5
Ramsbottom R, Brewer J, Williams C, 1988. A Progressive Shuttle Run Test to Estimate
Maximal Oxygen Uptake. Br J Sports Med. 22(4): 141–144.
Slater G, O’Connor H, Kerr A, 2018. Optimizing Physique for Sports Performance, Best Practice Protocols for Physique Assessment in Sport, ed: Patria A. Hume, Deborah A. Kerr, Timothy R. Ackland, Springer Nature Singapore Pte Ltd. 2018, p. 27-36. Slater LV, Vriner M, Zapalo P, Arbour K, Hard JM, 2016. Difference in Agility, Strength,
and Flexibility in Competitive Figure Skaters Based on Level of Expertise and Skating Discipline, Journal of Strength and Conditioning Research, 30 (12), 3321-3328.
Slaughter MH, Lohman TG, Boileau RA, Horswill CA, Stillman RJ, Van Loan MD, Bemben DA, 1988. Skinfold equations for estimation of body fatness in children and youth. Hum Biol.; 60: 709-23.
Tomkinson GR, Carver KD, Atkinson F, Daniell ND, Lewis LK, Fitzgerald JS, Lang JJ, Ortega FB, 2018. European Normative Values for Physical Fitness in Children and Adolescents Aged 9–17 Years: Results from 2 779 165, Eurofit Performances Representing 30 Countries. Br J Sports Med., 52:1445-1456.
Topendsports, https://www.topendsports.com/testing/norms/beep.htm, Accessed 06 November 2019.
Tucker R, Collins M, 2012. What makes champions? A Review of the Relative Contribution of Genes and Training to Sporting Success. Br J Sports Med., 46:555–
561.
Creative Commons licensing terms