ESA CADASTRAL OPERATIONS COURSE
MODULE B: DATA PROCESSING AND GIS
COURSE NOTES AND EXERCISES
EGYPT FINANCIAL SERVICES PROJECT
TECHNICAL REPORT #
83
OCTOBER 2006
This publication was produced for review by the United States Agency for International Development. It was prepared by Chemonics International Inc.
DATA PAGE
Activity Title and Number: Egypt Financial Services (EFS) Project Contract No. 263-C-00-05-00003-00
Prepared for: EFS CTO: Paul Bruning EFS DCTO: Ingi Lotfi
Economic Growth Division
Office of Financial and Information Technology USAID/Egypt
Task: 2: Registration
KRA: 2.3.6 and 2.3.8
Activities: Prepare training material and field manual to support EFS technical instructions for cadastral operations in Mokattam.
Author: Nigel Edmead
Senior Systems Analyst/GIS Specialist International Land Systems, Inc
Date: October 2006
List of Key Words Contained in Report:
Training, ESA, Cadastral Operations, GIS
The author’s views expressed in this publication do not necessarily reflect the views of the United States Agency for International Development or the United States Government.
EFS Project Task 2 Registration
2006-11-10_NEdmead_Module B_ESA Cadastral Operations Course_Front Page_ENG.doc Technical Report #
3
TABLE OF CONTENTS
Acronyms 3
SECTION I Course outline 5
SECTION II An overview of the lectures 6
SECTION III An overview of the exercises 7
ANNEX A Module B – Lecture material and Student notes ANNEX B Module B – Course Exercises
ANNEX C Course Evaluation Form ANNEX D Glossary of Terms
EFS Project Task 2 Registration
2006-11-10_NEdmead_Module B_ESA Cadastral Operations Course_Front Page_ENG.doc Technical Report #
4
Acronyms
CAD Computer Aided Design
CCITT Comite Consultatif Internationale de Telegraphie et Telephonie DWG AutoCAD Drawing File
DXF Data Exchange File EDO ESA District Office
EFS Egypt Financial Services (Project) EPO ESA Provincial Office
ESA Egyptian General Survey Authority
ESRI Environmental Research Systems Institute ETM Egyptian Transverse Mercator
GCP Ground Control Point
GDB Geodatabase
GIS Geographic Information System GPS Global Positioning System MXD ArcMap Map Document MXT ArcMap Map Template MRO Model Registry Office NED95 New Egyptian Datum – 1995 PDF Portable Document Format REPD Real Estate Publicity Department
RDBMS Relational Database Management System RMS Root Mean Square Error
RO Registry Office
TIFF Tag Image File Format
TMS Training Managers and Supervisors (Dutch-funded project) USAID United States Agency for International Development
EFS Project Task 2 Registration
2006-11-10_NEdmead_Module B_ESA Cadastral Operations Course_Front Page_ENG.doc Technical Report #
5
Section I: Course outline Introduction
The Egypt Financial Services Project, funded by USAID, is undertaking an extensive four-year technical assistance program to help develop a robust mortgage finance market in Egypt. Comprising four task areas, Task 2 ‘Registration’ is working with the Ministry of Justice and Egyptian Survey Authority to improve property registration in selected urban areas to ensure that this emerging mortgage finance market can successfully be
established. The ESA Cadastral Operations training course has been designed to support the surveying methodology devised by ESA/EFS to conduct an ‘as built survey’ in Mokattam. There are three course modules Module A: Geodetic Control, Module B: Data Processing and GIS (this course) and Module C: Surveying.
Training Location
ESA Training Center, ESA Headquarters, Cairo
Course format
The course comprises lectures and exercises. In addition to course exercises there will be ample opportunity to undertake practical work.
Course Duration
The course will run for 2 weeks for 4 – 5 hours a day, followed by a 1 week class project that will take place the ESA compound prior to commencement of field operations.
Trainees
Trainees from ESA and the private sector will attend this course. It is assumed that trainees are conversant with ESRI’s ArcGIS software (this is a course pre-requisite).
Administrative Matters
The three course modules will run parallel. The Geodetic Control and Surveying modules will take place in the 2 classrooms at the ESA Training Center and the Data Processing and GIS module in the IT Lab at the ESA Training Center. Staff will be assigned to a single module for the duration of training according to their education, training and experience.
Benefits
Trainees will be able to competently and efficiently develop a cadastral index map for Mokattam.
Trainers
Trainers are all ESA staff members who have considerable experience in the development and delivery of training. All have participated in the Dutch TMS project.
EFS Project Task 2 Registration
2006-11-10_NEdmead_Module B_ESA Cadastral Operations Course_Front Page_ENG.doc Technical Report #
6
Section II: An overview of the lectures
There are 6 topics covered in this course. Course lectures and student notes appear in Annex A. The lectures and student notes have been designed so as to serve as reference material once the course has ended and field operations have begun. The topics are organised as follows:
Introduction – covers an introduction to the GIS and Data processing methodology.
ArcGIS refresher – provides a quick recap of ArcGIS functionality describing core applications ArcMap and ArcCatalog used for GIS and Data processing.
Data collection – in which we look gathering existing data and converting it into usable format, including the indexing of mutation forms.
Georeferencing data – in which we look how to transform local coordinates to coordinates of the ETM and make adjustments to the data so that it aligns correctly.
Processing cadastral data – in which we look at the creation of parcels and buildings by means of heads up digitizing and data conversion.
Preparing the Cadastral Index Map – in which we look at creating a cadastral index map using layouts adding standard cartographic elements such as north arrows and scale bars.
Each section is followed by course exercises and practical work.
Not sure of something? We are here to help you get the most out of this course. If something is not clear please feel free to ask.
EFS Project Task 2 Registration
2006-11-10_NEdmead_Module B_ESA Cadastral Operations Course_Front Page_ENG.doc Technical Report #
7
Section III: An overview of the exercises
Class exercises follow the lectures, see Annex B. There are a number of separate exercises which cover the data processing and GIS components of the methodology. The exercises have been designed to serve as a working manual for future reference once field operations have begun.
Indexing – in which you learn how to record attributes from scanned mutation forms.
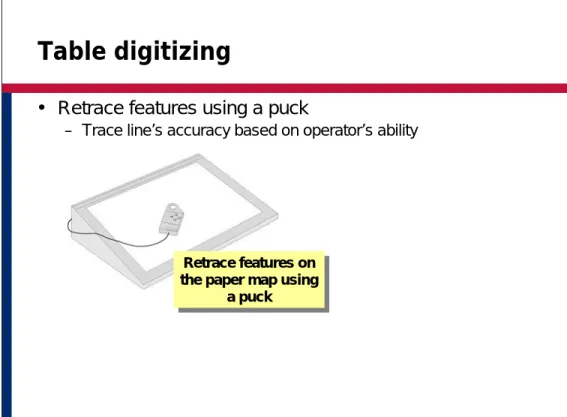
Tracing – in which you will learn trace CAD polylines and create shapefile polygons (parcels).
Heads up digitizing – in which you learn how to capture parcels from satellite imagery.
Georeferencing – in which you learn how to georeference raster data.
Spatial Adjustment, edgematching and rubbersheeting – in which you will learn how to convert CAD data to an editable spatial format, transform the data, adjust vertices by means of rubbersheeting and match data along map sheet edges.
Hyperlinks and Associations– in which you learn how to link mutation forms to parcels using hyperlinks, joins and relates.
Merging – in which you learn how to combine different layers of data together.
Map production – in which you prepare a cadastral index map and apply standardized symbology.
Notations used in exercise notes
Where a paragraph is indented with a square bullet as this one is then you are reading an instruction that should be followed.
Where a paragraph is not indented like this, then you are reading background information, generally indicating what it is you are about to do or have done. These are not instructions and should only be read.
NOTE: When you see a note like this then a tip or some advice is being given.
A course evaluation form appears in Annex C and a glossary of terms in Annex D. Callouts
Where you see call out boxes such as this one then additional
information is being provided to you to help you in your task.
EFS Project Task 2 Registration
2006-11-10_NEdmead_Module B_ESA Cadastral Operations Course_Front Page_ENG.doc Technical Report #
8
ANNEX A:
Introduction v0.2.ppt
Module B: ESA Cadastral Operations Course
ESA
CADASTRAL OPERATIONS COURSE
MODULE B: DATA PROCESSING AND GIS
COURSE LECTURES AND STUDENT NOTES
[DATE] [SPEAKERS NAMES]
Introduction v0.2.ppt
Module B: ESA Cadastral Operations Course
Technical Report # 1-2
Objectives
• To learn how to process cadastral data
• To learn how to georeference and adjust data
• To learn how to prepare a cadastral index map
Objectives
The objectives of this course are to introduce the methods and procedures required to process cadastral data including georeferencing and spatial adjustment, data capture and conversion and the preparation of the cadastral index map using GIS. The GIS software used for this course is ArcGIS.
Introduction v0.2.ppt
Module B: ESA Cadastral Operations Course
Training Methods
• Presentations
• Exercises
• Class project
Training Methods
A variety of training methods will be used lectures (presentations), exercises and a class project. Your instructor will present a section, which will then be followed by a class exercise. A series of exercises using sample data are found at the back of this manual. These exercises are designed to convey the principles outlined in the lectures. You can revisit these exercises at anytime. During the course you have plenty of opportunity to use ArcGIS for data processing operations. The class notes are designed to serve as a manual for field work when you begin field operations. If you have any questions during the course please ask your instructor.
Introduction v0.2.ppt
Module B: ESA Cadastral Operations Course
Technical Report # 1-4
Logistics
• 3 week course
• Daily schedule
• Facilities
• Feedback
Logistics
This is a 3 week course. 2 weeks of the course are classroom based, to be followed by a 1 week class project which will take place in the ESA compound.
The trainer will explain the logistics of the course, the daily schedule, the layout of the training facility and advise you of the location of toilets and fire exits. On completion of the course please complete a course evaluation form so that we can improve the course in future. You will find the course evaluation at the back of this manual, along with a glossary of terms which you can use for reference purposes.
Introduction v0.2.ppt
Module B: ESA Cadastral Operations Course
Section overview
• Course overview
• GIS refresher
• Data processing methodology
Section overview
This section outlines the topics covered, provides a recap of GIS principles and GIS functionality, a description of ArcGIS and an overview of the proposed GIS and data processing methodology.
Introduction v0.2.ppt
Module B: ESA Cadastral Operations Course
Technical Report # 1-6
Course overview
• ArcGIS refresher
• Processing data
• Geoferencing and spatial adjustment
• Preparing a cadastral index map
• Class project
3 w
e
e
k
s
3 w
e
e
k
s
Course overview
This course covers the use of ArcGIS to process existing cadastral data and new acquired field data to generate a cadastral index map and cartographic product. During the course we will cover data collection and data processing, georeferencing and transformation of existing data and the preparation of the cadastral index map.
Introduction v0.2.ppt
Module B: ESA Cadastral Operations Course
What is a GIS?
• “A computerized information system for the management
of spatial data”
• An integration of five basic components:
– People – Data – Hardware – Software – Procedures
What is a GIS?
Definitions of a geographic information system can vary considerably. The definition provided here combines both the components and functions of a GIS. The components needed to perform GIS tasks include those listed below:
People:This is the most important component in a GIS. People must develop the procedures and define the tasks of the GIS. The best software and computers in the world cannot
compensate for incompetence.
Data: The availability and accuracy of data can affect the results of any query or analysis. Hardware:Hardware capabilities affect processing speed, ease of use and the type of output available.
Software:This includes not only the actual GIS software, but also various database, drawing, statistical, imaging or other software.
Procedures:Analysis requires well defined, consistent methods to produce correct and reproducible results.
Introduction v0.2.ppt
Module B: ESA Cadastral Operations Course
Technical Report # 1-8
GIS functions
Capture Capture Store Store Query Query Analyze Analyze Display Display Analyze Analyze GIS functionsAny geographic information system should be capable of the following fundamental operations in order to be useful for finding solutions to real-world problems.
Capturing data:A GIS must provide methods for inputting geographic (coordinate) and tabular (attribute) data. The more input methods available, the more versatile the GIS.
Storing data:There are two basic data models for geographic data storage vector and raster. Querying data: A GIS must provide utilities for finding specific features based on their
locations or attribute values.
Analyzing data:A GIS must have the ability to answer questions regarding the interaction of spatial relationships between multiple datasets.
Displaying data:There must be tools for visualizing the geographic features using a variety of symbology.
Output:Results of display should be able to be output in a variety of formats such as maps, reports, and graphs.
Introduction v0.2.ppt
Module B: ESA Cadastral Operations Course
Components of geographic data
• GIS data has two basic components
Attributes Attributes
Geometry Geometry
Components of geographic data
The two basic components of GIS data are Geometry and Attributes. Geometry is the physical representation of a real world object. Real world objects are abstracted into point, line or polygon (area) features. Attributes are descriptive information about a feature. In the geodatabase (a new spatial format for ArcGIS) another component of GIS data is behavior. For example domains can be used to enforce permissible attribute values ensuring something is not incorrectly described.
Introduction v0.2.ppt
Module B: ESA Cadastral Operations Course
Technical Report # 1-10
Organizing spatial data
• A GIS works with layers of spatial data
Layers in ArcMap Layers in
ArcMap
Organizing spatial data
A GIS organizes and stores information about the world as a collection of thematic layers that can be linked by geography. Each layer contains features having similar attributes, like streets and cities, that are located within the same geographic extent. This simple but extremely powerful and versatile concept has proven invaluable for solving many real world problems from tracking delivery vehicles to modelling global atmospheric circulation.
Introduction v0.2.ppt
Module B: ESA Cadastral Operations Course
Abstracting real world objects
• Real world objects represented as three basic shapes
Lines
(Streets)
Points
(Geodetic control)
Polygons
(Parcels) Real world
Real world
Abstracting real world objects
It is impossible to capture everything from reality inside a computer. Instead, GIS users must somehow abstract real world phenomena, or entities, into a geometric representation of those entities. There are three basic geometric shapes used for geographic features: points, lines, and areas. These shapes are often called geometric objects, geometric features, or feature types.
Introduction v0.2.ppt
Module B: ESA Cadastral Operations Course
Technical Report # 1-12
Georeferencing data
• Locating your data in real world coordinates
• Different coordinates means misalignment
Local Local ETM ETM NED 95 NED 95 0,0 Different coordinate systems in Egypt Different coordinate
systems in Egypt
Georeferencing data
One important issue you must confront when adding data to your database is how to ensure that all of the features in the individual datasets are properly aligned to locations on the earth’s surface. In Egypt you may encounter local coordinates, coordinates in the Egyptian Mercator System (ETM) and even coordinates in the New Egyptian Datum 1995 (NED 95). The problem is that none of these layers, in the differing coordinate systems, will align correctly and transformations will need to be applied to correct this misalignment. Transformations are covered in more detail in Section 4: Georeferencing and Adjustment. It is important that you understand the coordinate system of data provided to you to ensure you apply the correct
transformation, although in reality you may have little idea about a dataset’s coordinates and projection system unless it is described by metadata.
Introduction v0.2.ppt
Module B: ESA Cadastral Operations Course
Overview of ArcGIS desktop products
ArcGIS applications
ArcGIS products
Increasing
Increasing Functiona
lity
Functiona
lity
ArcInfo ArcEditor ArcView
ArcCatalog
ArcCatalog ArcMapArcMap
Overview of applications
During this course you will make use of ArcGIS. ArcGIS is a desktop GIS from ESRI. There are 3 ArcGIS products: ArcView. ArcEditor and ArcInfo that increase in
functionality and price. You will be using ArcView in this course. Each of the 3 products share the common applications ArcMap and ArcCatalog. These are
designed to work together to perform all GIS tasks. For example, you can search for and find a map document in ArcCatalog, then open it in ArcMap by double-clicking it in ArcCatalog. You can then edit and enhance your data through the tools available in the ArcMap editing environment.
Introduction v0.2.ppt
Module B: ESA Cadastral Operations Course
Technical Report # 1-14
Data processing methodology
• Data processing strategies for cadastral data:
Existing data -CAD format
New field survey data -CAD format Mutation forms
GIS database Convert and
georeference Convert and georeference
Index Index
Convert Convert
Data processing methodology
The GIS and data processing methodology proposes that both existing and new CAD data be converted to the ESRI shapefile format and mutation forms indexed. When necessary existingdata will be transformed to ensure its coordinate system is correct. All data processed will be held in a GIS database that is amenable to analysis, map production, modification and update.
Introduction v0.2.ppt
Module B: ESA Cadastral Operations Course
Processing existing data
• Process existing data
– Index mutation forms
– Convert CAD data to shapefile format – Attribute properties
– Link mutation form details
Mutation Forms
Database Parcels and
Buildings
Processing existing data
Where parcel and building information is already available in CAD format (e.g. from ESA for the Mokattam area) this will be converted to shapefile format using ArcGIS. Where mutation forms exist they will be indexed using MS Access. It will then be possible to link the
Introduction v0.2.ppt
Module B: ESA Cadastral Operations Course
Technical Report # 1-16
Mutation form database
• Property Object and Initial Transaction table
• Subsequent Transactions table
Mutation form database tables linked by common field
Mutation form database tables linked by common field
Mutation form database
A mutation form database will be created to hold details from mutation forms – there are two required tables one for the property object and its initial transaction and one for subsequent transactions. Using a common field (e.g. mutation form number) these tables can be linked together as shown in the graphic above. This is described as a one to many relationship type, one property object – many transactions.
Introduction v0.2.ppt
Module B: ESA Cadastral Operations Course
Index mutation forms
Property address Property address
Subsequent transactions Subsequent transactions
Initial transaction Initial transaction
Index mutation forms
Mutation forms will be scanned and key details be indexed. Mutation forms comprise 4 pages and they are slightly smaller than A3 size. The slide above shows some of key attributes that will be indexed. All pages of a mutation form (including the sketch) will be scanned using a flatbed scanner and saved as a TIFF image file.
Introduction v0.2.ppt
Module B: ESA Cadastral Operations Course
Technical Report # 1-18
Convert CAD outlines to polygons
• Trace polylines to create polygons
AutoCAD Drawing file
AutoCAD Drawing file
Trace in ArcGIS
Trace in ArcGIS
Create polygon
Create polygon
Convert CAD outlines to polygons
Where CAD data exists for an area, typically the CAD data represents parcels and
buildings as a series of connected lines. Whilst this is correct in the strict sense that parcel boundaries have dimensions (i.e. length and direction) the lines themselves do not
constitute an area i.e. there is no way to click inside a parcel and determine its area or determine its identifier. Where CAD polylines exist they will be converted to polygons using different editing tools in ArcGIS, for example the Trace tool as shown above. Where CAD polygons exist (i.e. closed polylines) they will be converted directly to an ESRI spatial format.
Introduction v0.2.ppt
Module B: ESA Cadastral Operations Course
Linking mutation form details
• Common field mutation form number
– Links property details and transactions to a property
Common field allows parcel and mutation form details to be
linked
Common field allows parcel and mutation form details to be
linked
Linking mutation form details
Once parcels have been created and mutation form details indexed they can be linked together using the common field mutation form number which is an attribute both of the property feature class and the property object and subsequent transactions table in the mutation forms database.
Introduction v0.2.ppt
Module B: ESA Cadastral Operations Course
Technical Report # 1-20
Processing new data
• Field survey data
– Process field data using AutoCAD – Convert CAD data to shapefile format – Attribute properties
Database Parcels and
Buildings
Processing new data
New data will be acquired during the field surveying phase. Since this is new data, there will be no mutation form associated with the parcel/building and the feature will only be assigned a property identifier. New data will be referenced directly to the ETM coordinate system and will not need to be transformed. Once new data has been processed it will be combined with existing data to create a complete cadastral picture for an area of interest.
Introduction v0.2.ppt
Module B: ESA Cadastral Operations Course
Field surveying
• Total Station and hand held laser distance tool
• Process results using AutoCAD
Surveying and laser sighting Surveying and laser sighting
Field surveying
Survey crews will gather parcel outlines and building footprints using Total Station and Hand Laser distance tools. All data (as per current ESA practices) will be processed using AutoCAD. There are separate course modules covering Geodectic Control and Field Surveying.
Introduction v0.2.ppt
Module B: ESA Cadastral Operations Course
Technical Report # 1-22
Convert CAD outlines to polygons
• Trace polylines to create polygons
AutoCAD Drawing file
AutoCAD Drawing file
Trace in ArcGIS
Trace in ArcGIS
Create polygon
Create polygon
Convert CAD outlines to polygons
As with existing CAD data polylines will be converted to polygons using different editing tools in ArcGIS, for example the Trace tool as shown above. If CAD polygons are
generated by the field survey teams this data will be converted directly to the ESRI shapefile format.
Introduction v0.2.ppt
Module B: ESA Cadastral Operations Course
Assigning a new identifier
• Assign a new id based on MSAD/ESA standards:
Identify private parcel Number xxxyyyzzz Map building footprint on parcel
Identify apartment unit Number xxxyyyzzz0612
The principles of property numbering
The principles of property numbering
Assigning a new identifier
New properties will be assigned a unique parcel identifier using the coding system devised by MSAD/ESA (or another alternative numbering system, for example as devised the ESA Provincial Office). The principles of a property coding system is shown above, typically these systems include numeric identifiers for administrative areas as well as the property itself, they may even be alphanumeric. For example in the UK each property is identified by a Unique Property Reference Number (UPRN). Each UPRN is a maximum of twelve digits and is unique within the UK.
Introduction v0.2.ppt
Module B: ESA Cadastral Operations Course
Technical Report # 1-24
ESA/MSAD real estate number
• Proposed number format:
ESA/MSAD real estate number
The ESA/MSAD real estate numbering (REN) system foresees Egypt broken down into map sheets of 1.5 by 1 km which in turn are broken down into 6 grids. The numbering system then is broken down by block, building, suite, storey, floor and apartment number. The identifier comprises a total of 19 digits, note that this a proposed numbering and is subject to change.
Introduction v0.2.ppt
Module B: ESA Cadastral Operations Course
Representing apartments
• One polygon for each apartment
– Geometry indicative only
• One polygon for communal area
– Building footprint
• Each polygon assigned an identifier
– Links to mutation form
67234934345 67234934345 67234934346 67234934346 67234934347 67234934347 67234934348 67234934348 67234934349 67234934349 67234934350 67234934350 Representing apartments
Each apartment (and communal area) should be represented by one polygon, the geometry is only indicative i.e. that this an area of ownership, it is not meant to show the exact
boundaries or dimensions of the apartment. For example if there were a 15 apartments there would be 16 polygons – one for the communal area which has its own mutation form and one polygon for each apartment. Each polygon is then assigned an identifier so that it can be linked to its mutation form. Field teams will collect information about apartments when surveying building footprints. They will complete a Building Report which includes number of apartments as well as those occupied and unoccupied.
Introduction v0.2.ppt
Module B: ESA Cadastral Operations Course
Technical Report # 1-26
Create cadastral index map
• Final product is a cadastral index map
– Digital and analogue
• Analogue product follows ESA cartographic standards
Hardcopy Cadastral Index map Hardcopy Cadastral
Index map
Create cadastral index map
The hardcopy output of the GIS and Data processing component will be the Cadastral Index map. ESA has standards regarding the content and symbology of these maps and these standards will be followed when printing or plotting large scale maps for the Mokattam area. The cadastral index map will be vetted by ESA to ensure it meets their quality control standards.
ArcGIS refresher v0.2.ppt
Module B: ESA Cadastral Operations Course
Section 2:
ArcGIS refresher
ArcGIS refresher v0.2.ppt
Module B: ESA Cadastral Operations Course
Technical Report # 2-2
Section 2 overview
• What is ArcGIS?
• ArcMap
• ArcCatalog
• ArcToolBox
Section overview
This section provides a brief overview of ArcGIS, the applications that comprise it and how they are used.
ArcGIS refresher v0.2.ppt
Module B: ESA Cadastral Operations Course
Objective
¾
To provide an overview of ArcGIS and how it can be
used to process cadastral data
Objective
In order to be able to successfully undertake data processing operations using GIS, a brief overview of the GIS solution is provided. As mentioned this is not an ArcGIS per say but this section serves as a refresher for those already familiar with ArcGIS.
ArcGIS refresher v0.2.ppt
Module B: ESA Cadastral Operations Course
Technical Report # 2-4
What is ArcGIS?
• Desktop GIS
– Provides tools for the management of spatial data
• Easy to use GUI based application
– Fully documented with on-line help
• Two core applications:
– ArcMap – ArcCatalog
What is ArcGIS?
GIS is defined as a “computerized information system for the management of spatial (geographic) data”. Using GIS you can create, manage, analyze and present geographic information. ArcGIS is an easy to use GUI based application that provides all the tools needed to perform the data processing tasks described in the Cadastral Operations methodology. ArcGIS is fully documented with on-line help and web based resources. If you have any questions about ArcGIS during the course please feel free to ask your instructor.
ArcGIS refresher v0.2.ppt
Module B: ESA Cadastral Operations Course
ArcMap
• Visualization application
• For map-based tasks:
– Displaying – Symbolizing – Editing – Querying – Analysing – Charting – Reporting – Presenting Table of contents Table of contents Display area Display area ArcMap
ArcMap is the primary display application, you will use this the majority of the time to add data, symbolize data (i.e. create thematic maps), edit data, query data (select features by attribute or location); create charts, reports and layouts (maps) for printing, plotting or export. layers. You can export layouts to TIFF, BMP and many graphic file formats to share maps with non-GIS users.
ArcMap comprises a table of contents, display area and toolbars. The table of contents (TOC) lists all the layers or themes of geography you are working whilst the display area shows features contained in the layers. Use ArcMap toolbars to navigate around the base map, add data, save your work and create layouts.
ArcGIS refresher v0.2.ppt
Module B: ESA Cadastral Operations Course
Technical Report # 2-6
Adding
• ArcGIS supports many spatial formats
– CAD, Shapefile, Raster
• Add data to a map document
• Layers reference data on disk
Layers and data frames Layers and data
frames Shapefiles on disk
Shapefiles on disk
Adding
You can add many different spatial data formats to a map document – CAD data, shapefiles and geodatabase feature classes. When you add data to a map document you create a layer – a layer references the source data on disk. Once a layer has been added it can be symbolized, queried and edited. Layers are organized by data frames or containers of spatial information. In the slide above Cairo Environs is a data frame, it is identified by the three yellow stacked layers.
ArcGIS refresher v0.2.ppt
Module B: ESA Cadastral Operations Course
• ArcGIS can work with spatial data in multiple formats
ArcGIS
Supported spatial data formats
Tables Coverage
Shapefile
CAD
Geodatabase
Raster
Internet Map Server
Supported spatial data formats
Currently, there is not a standard format for GIS data.Various GIS software manufacturers and other organizations, such as government agencies, have continually searched for more efficient and versatile digital formats to store
geographic information. ArcGIS has the advantage of seamlessly supporting all of the ESRI formats: shapefiles, coverages, grids, the geodatabase and data served over the internet by ArcIMS or ArcGIS Server. In addition ArcGIS also supports the three most common CAD file formats (DXF, DWG and DGN), as well as a variety of common image file (Mr. SID, BSQ, BIL, etc) and tabular formats (MS Access tables, DBF and text files). The ability to work with so many different formats without
ArcGIS refresher v0.2.ppt
Module B: ESA Cadastral Operations Course
Technical Report # 2-8
Navigating
• Tools for zooming in/out, panning viewing to scale
Scale notation drop-down menu sets map scale Scale notation drop-down
menu sets map scale
The Tools toolbar contains navigation tools The Tools toolbar contains
navigation tools
Navigating
Use the Tools toolbar to zoom in and out, zoom to previous/next, pan and zoom to the full extent of all layers in the data frame. You can also use the scale notation drop-down menu to zoom in and out. You can either you a predefined scale or enter a scale yourself e.g. 1:500. You can use the navigation tools in the Layout view allowing you to create maps for printing and plotting of fixed scale as required by ESA.
ArcGIS refresher v0.2.ppt
Module B: ESA Cadastral Operations Course
Symbolizing
• Property of the layer
• Select legend type
– Unique values – Graduated colors – Graduated Symbol – Pie Chart
– Dot Density...
• Set legend properties
Creating a graduated colors legend Creating a graduated
colors legend
Symbolizing
You can create thematic maps (maps which are symbolized in such a way as to present information) using the Symbology tab in the Layer properties dialog box. First choose a legend category: Features, Categories, Quantities, Charts or Multiple Attributes then a legend type. Use Categories for descriptive values and Quantities for numeric values. For example under Categories choose Unique Values to give each feature with a unique descriptive value (e.g. district name) a unique symbol. Under Quantities choose Graduated Colors to assign a gradation of colors to numeric values with the deepest color representing the greatest numeric value.
ArcGIS refresher v0.2.ppt
Module B: ESA Cadastral Operations Course
Technical Report # 2-10
Labeling
• Add text to map
• Based on feature attributes
• Set label properties
Labeling districts by Arabic name Labeling districts by
Arabic name
Labeling
You can label (add text to) features by selecting an attribute and setting the properties for the label. In the example above district names are shown in Arabic. Labels are dynamic that is they are repositioned every time you zoom in and out. There are rules governing the placement of labels too, which makes for a clear uncluttered display. If you do not want text moving around the display – for example you want a fixed location for a street name you can create annotation. Annotation is described in more detail in Section 6: Preparing the Cadastral Index Map.
ArcGIS refresher v0.2.ppt
Module B: ESA Cadastral Operations Course
Querying
• Select features
– By their description – By their location – Interactively – Using graphics
Select by Attributes Select by Attributes
Select by Location Select by Location
Querying
You can select features in a number of different ways, by their description using a
Structured Query Language (SQL) statement (e.g. Population > 50,0000), by their location (e.g. find all properties within 50 meters of a road), interactively by using the mouse/cursor or by using a graphic drawn in the display.
Selected features are displayed in cyan. To determine how many feature have been selected either open the layer’s attribute table or click on the Selection tab at the bottom of the map document’s table of contents:
Number of features selected appears under the Selection tab in
the TOC
Number of features selected appears under the Selection tab in
ArcGIS refresher v0.2.ppt
Module B: ESA Cadastral Operations Course
Technical Report # 2-12
Editing
• Select editable layer
• Set edit task
• Use sketch tools
The Editor toolbar The Editor toolbar
Editing
Editing is covered in some detail in this course, suffice to say that in ArcMap you use the Editor tool bar to start an edit session, specify the editable layer and set an edit task. To perform an edit task you use a sketch tool (the default sketch tool is the pencil). For example to draw a new parcel boundary choose to start editing, set the editable layer to parcels, the edit task to create new feature and use the sketch tool to draw a parcel outline in the display. When you have finished your edits you can save your work and stop editing.
ArcGIS refresher v0.2.ppt
Module B: ESA Cadastral Operations Course
Presenting
• Create a layout
• Add cartographic elements
– Title – Scale Bar – North Arrow – Legend – Logo
Map production using layouts Map production
using layouts
Presenting
Using layouts you prepare cartographic products for printing, plotting or export (for example to PDF files). To switch to the Layout view choose Layout View from the View menu or click on the Layout View button at the bottom of the map document’s display area. To insert a cartographic element click the Insert menu and choose the type of element to add. All elements are dynamic, for example if you zoom out the scale bar will adjust itself. In
addition the map in the layout view is ‘live’ i.e. using the Tools toolbar you can zoom in and out or pan the data frame to set the correct extent of the map you want to print.
ArcGIS refresher v0.2.ppt
Module B: ESA Cadastral Operations Course
Technical Report # 2-14
ArcCatalog
• Data management application
• For spatial data tasks:
– Creating – Renaming – Deleting – Moving – Searching – Previewing
Catalog tree Catalog
tree
Contents view Contents
view
ArcCatalog
ArcCatalog is the data management application. Use ArcCatalog exclusively for the management of geographic information – do not use Windows Explorer. Using ArcCatalog you can create new spatial data, move, copy, rename and delete data, as well as search and preview data before its use.
ArcGIS refresher v0.2.ppt
Module B: ESA Cadastral Operations Course
Creating
• Choose spatial format
• Set properties
– Name – Geometry – Spatial reference – Attributes
Creating a new shapefile Creating a new
shapefile
Creating
Use ArcCatalog to create new data, be it spatial or tabular. When creating new spatial data you can create either shapefiles or personal geodatabase feature classes. Irrespective of which type of spatial data you choose to create you must name the new dataset, set its geometry type (point, line or polygon) and its spatial reference. You can also fields to the dataset’s attribute table to store descriptive information. Once you have created a new feature class or shapefile in ArcCatalog you must edit it in ArcMap.
ArcGIS refresher v0.2.ppt
Module B: ESA Cadastral Operations Course
Technical Report # 2-16
Managing
• Copy
• Rename
• Move
• Delete
– No recycle bin!
Managing data Managing data
Managing
Use ArcCatalog exclusively for the management of spatial data, you can copy, rename, delete and move data. In addition you can create and delete folders on disk. Remember there is no Recycle bin so deletions cannot be undo
ArcGIS refresher v0.2.ppt
Module B: ESA Cadastral Operations Course
Exploring
• Search for data
• Examine data
– Geography, Attributes, Metadata
Examining a shapefile Examining a shapefile
Searching for data Searching for data
Exploring
Using ArcCatalog you can search for geographic data by name and location, geography, date and metadata. Search results are returned as shortcuts which behave like data, you can drag and drop a shortcut into ArcMap without knowing where the source data is. You can also examine data before using it – under the Contents tab you can view the contents of folders and geodatabases, under the Preview tab you can examine the features and attributes of a feature class or shapefile and under the Metadata tab you can examine descriptive information about the data.
ArcGIS refresher v0.2.ppt
Module B: ESA Cadastral Operations Course
Technical Report # 2-18
ArcToolBox
• Data analysis and automation
application
• For spatial analysis tasks:
– Clipping – Merging – Buffering
• Dockable window in
ArcMap/ArcCatalog
Toolboxes, toolsets and tools
Toolboxes, toolsets and tools
ArcToolBox
ArcToolBox is used for data analysis as well automation of repetitive tasks. Commonly used tools include clipping (a cookie cutter operation), merging (combing data together) and buffering (creating concentric rings around features). ArcToolBox is a dockable window that can be added to either ArcMap or ArcCatalog.
ArcGIS refresher v0.2.ppt
Module B: ESA Cadastral Operations Course
Analyzing
• Double click a tool to run
• Tools run as dialogs
– Browse for input data – Specify output data – Set tool parameters – Run tool
• Review progress window for
errors
Buffer tool Buffer tool
Progress window Progress window
Tool dialog Tool dialog
Analyzing
To run a tool, first find the tool in ArcToolBox. If you do not know where to find a tool, use the Search tab at the bottom of the ArcToolBox window. To run a tool simply double click on it (tools have a hammer icon next to them). Most tools run as dialog boxes requiring that you identify an input dataset, and output data location and tool parameters. Depending on the tool being run will determine the parameters required. The slide above shows the buffer tool, which requires you enter a buffer distance. When the dialog is complete click the OK button to run the tool and review the progress window for any errors.
ArcGIS refresher v0.2.ppt
Module B: ESA Cadastral Operations Course
Technical Report # 2-20
Exercise 1
• Start ArcMap
• Open a map document
• Symbolize a layer
• Start ArCatalog
• Examine a feature class
• Start ArcToolBox
Collection, scanning and indexing v0.2.ppt Module B: ESA Cadastral Operations Course
Section 3:
Collection, scanning and indexing v0.2.ppt Module B: ESA Cadastral Operations Course
Technical Report # 3-2
Section overview
• Data sources
• Scanning
• Indexing
Section overview
The use of existing data assists in the creation of the cadastral index map as not all areas need to be surveyed. This section covers where to find existing data, its assessment, scanning and indexing.
Collection, scanning and indexing v0.2.ppt Module B: ESA Cadastral Operations Course
Objective
¾
To gather existing data and convert to digital by
scanning and data entry
EXISTING CADASTRAL DATA
- Mutation forms (apartments) - ESA maps
- Geodetic data - Other maps and plans
GATHER EXSITING DATA
CONVERT EXISTING DATA TO DIGITAL
CONVERT EXISTING DATA TO DIGITAL
ESA
ESA’’s roles role
--scan and digitize maps/plansscan and digitize maps/plans
--provide private sector with bldg/apt mutation form provide private sector with bldg/apt mutation form copies
copies
Private Sector
Private Sector’’s role:s role:
--scan and index bldg/apt plansscan and index bldg/apt plans
--scan and index mutation form copiesscan and index mutation form copies
Objective
Rather than collect information from scratch, the methodology proposes that existing data sources be used to partially construct a cadastral index map. A large amount of information relating both land parcels and buildings is held by ESA District Offices and Municipalities, amongst others. The first activity within the preparatory phase will be the collection and evaluation of this information and to whether it should be included and if so to convert the data into digital format (if required). Where gaps exist these will be filled with new survey work. Existing mutation forms will also be scanned and indexed.
Collection, scanning and indexing v0.2.ppt Module B: ESA Cadastral Operations Course
Technical Report # 3-4
Egyptian Survey Authority
• EDO
– Mutation forms
– Development (Partitioning) Project Plans – Building Unit Plans
• EPO
– Cadastral Maps
– Development (Partitioning) Project Plans – Control Network data
– Cadastral Numbering
Egyptian Survey Authority EDO (ESA District Office)
Mutation formsare used to record property transactions and provide diagrams of land parcels, common areas within buildings under multiple ownership and individual
apartments. Mutation forms are created in a hierarchical manner and are a link between existing registered deeds and a spatial description of property objects. Individual mutation forms are slightly larger than A4.
Development (Partitioning) Project Plansare created by development companies and individuals undertaking subdivision.
Building Unit Plansare plans which show the internal details of individual apartments and are usually only available for new communities.
EPO (ESA Provincial Office)
Cadastral Mapsfor new communities are generally maintained in AutoCAD.
Development (Partitioning) Project Plansare created by development companies and individuals undertaking subdivision.
Control Network Dataare low order control points for cadastral surveys and can be used in field survey work.
Collection, scanning and indexing v0.2.ppt Module B: ESA Cadastral Operations Course
ESA HQ
• Geodetic control
– Existing control points
– Datum conversion parameters
• Cadastral map data
– Existing cadastral maps
ESA HQ
Geodetic Network Data– The Department for Geodesy, Triangulation and Control, which comes under the Mapping Affairs Central Department, is responsible for managing and maintaining all geodetic infrastructure for Egypt’s vertical and horizontal control networks. This department may possess details information about the GPS stations to be the basis for the coordinate system that will be used by the surveyor to densify the network required within the target area to be surveyed and/or mapped. The department is also responsible for developing and disseminating control network transformation parameters and equations so that all cadastral data is on the common coordinate datum of NED-95. The coordinate values and description cards can be obtained from the ESA Geodetic Department.
Cadastral Map Data– The ESA Map Store holds a repository of cadastral maps for many areas of Cairo at 1:500 to 1:2500 scale. Maps for the selected area to be surveyed should be collected to identify the property boundaries determined when the last survey was completed.
Collection, scanning and indexing v0.2.ppt Module B: ESA Cadastral Operations Course
Technical Report # 3-6
Municipalities
• Land use types and patterns
– Residential and Government land
• Street names and public areas
Land use patterns Land use patterns
Municipalities
Data relevant to land registration and held by the municipalities includes:
Land Use Plansthat show land use patterns and to some extent ownership information (e.g. whether it is residential or governmental land)
Municipal Property Datawhich indicates municipal property boundaries, public use areas and approved road and street locations and names.
Collection, scanning and indexing v0.2.ppt Module B: ESA Cadastral Operations Course
Physical Planning
• Street names
– New names – Changes to names
• To confirm property address
Street Names Street Names
Physical Planning
Street names (current and old) are held by Physical Planning and can be used to confirm property addresses.
Collection, scanning and indexing v0.2.ppt Module B: ESA Cadastral Operations Course
Technical Report # 3-8
Other Government Agencies
• Land ownership
• Plans of buildings and properties
• Names of properties
• For reference purposes
Other Government Agencies
Many other government agencies own land as well as properties and buildings, plans and names of which will be useful for reference purposes. Examples include the New
Collection, scanning and indexing v0.2.ppt Module B: ESA Cadastral Operations Course
Private Companies and Individuals
• Developments by private companies
– Records of owners
• Individual ownership claims
– Sanad el-Melkyah – ORFI contracts – Notarized documents
Notarized Deed Notarized Deed
Private Companies and Individuals
Developers hold plans and maps of their developments which can be used to create cadastral data. This data is typically already in digital format (e.g. AutoCAD) and can relatively easily be combined with new data. For individuals any of the following can be used in determining ownership (in descending order of preference):
Registered Deedor Publicized contract
Registry Office extractor notarized documents ORFIor Unregistered contracts
Adverse possessionthe acquisition of title to property through possession without the owner's consent for a certain period of time (by law 15 years in Egypt)
Tax statementsor tax (MUKALAFA) registers Testimony
Collection, scanning and indexing v0.2.ppt Module B: ESA Cadastral Operations Course
Technical Report # 3-10
Data assessment
• Decide whether to use data
– Use only maps and plans with relevant features – Minimum acceptable scales
– Control Points required – Age and condition
Data assessment
Existing locational information of land parcels must be sourced from paper based maps and plans and a scale of 1:500 or better. Existing digital data must have been created through methods with an accuracy that is equal to, or better than the graphical equivalent of 0.25m at 1:500 (0.5mm at map scale). The smallest scale from which data can be is sourced is 1:5,000. If maps and plans do meet these minimum requirements they should not be used and field surveying will be required.
On maps being scanned you should be able to identify a minimum of 2 (preferably 3)control points (often referred to as Ground Control Pointsor GCPs), known locations that have real world coordinates associated with them. If no control points can be identified then a field survey will be required to establish these. The control points are needed to ensure that data can be brought under a common survey reference network.
Collection, scanning and indexing v0.2.ppt Module B: ESA Cadastral Operations Course
Data assessment form
• Record whether maps/plans can be used
• Indicate if survey work is required
No Yes Include in GIS? Mokattam, Block C Mokattam, Block A Location Yes No Unknown 1934? Old cadastral map No Yes 1:5,000 1985 Developers plan Field Work needed? GCPs Scale/ Age Source
Data assessment form
Use a data assessment form to log data that has been gathered and record key information about it – its scale, age (if known), whether there are any visible GCPs and whether field work is needed, this information should be passed to the survey team so that they can program survey work as needed.
Collection, scanning and indexing v0.2.ppt Module B: ESA Cadastral Operations Course
Technical Report # 3-12
Scanning
• Maps and plans up to A0
– Digitize features from raster data
• Mutation forms up to A3
– Index key attributes using RDBMS
Scanning
Only maps and plans with relevant information should be scanned (i.e. those showing buildings and parcels). Maps and plans should be scanned using an A0 scanner, mutation forms using an A3 scanner.
Once mutation forms have been scanned they should be indexed i.e. key details should be recorded in a relational database management system (RDBMS) such as MS Access.
Collection, scanning and indexing v0.2.ppt Module B: ESA Cadastral Operations Course
Scanning process
• Load plan, map or form in scanner
• Preview and adjust
• Save to TIFF format
Scanning process
To scan a map, plan or form, make sure it is face down and flat on the scanner, choose to preview the document before scanning so that you can be sure it is being scanned
correctly.
Maps, plans and mutation forms should be scanned as TIFF files (Tag Image File Format CCITT Group 4 compression standard).
The graphics above show the Scanner and Camera Wizard in Windows XP, note that you may be using different scanning software but the process will be exactly the same.
Collection, scanning and indexing v0.2.ppt Module B: ESA Cadastral Operations Course
Technical Report # 3-14
File naming convention
• Mutation forms - mutation form number
– Mutation5677723
• Maps - map sheet
• Apartment/Buildings plans - address
– Apartment no + Building no + address
File naming convention
Scanned TIFF files should be named after the number of the mutation form preceded by ‘mutation’ as shown above. Maps should be named by map sheet number.
Collection, scanning and indexing v0.2.ppt Module B: ESA Cadastral Operations Course
Indexing mutation forms
• Key attributes to be recorded:
– Property location
• Governorate name, Town name, District name, etc… – Original contract details
• Name of contract party, type of transaction, transaction year, etc… – Transactions against property
• Grantor, grantee, date of contract registration, transaction year, etc…
Indexing mutation forms
Mutation forms contain key attribute information that needs to be indexed. The key
attributes to be recorded are listed on the following pages and relate to the property object, initial and subsequent transactions. Property sketch details will not be indexed.
Collection, scanning and indexing v0.2.ppt Module B: ESA Cadastral Operations Course
Technical Report # 3-16
Time frame
• Estimated number of mutation forms for Mokattam:
– 2,600 for parcels – 1,900 for apartments
• Each indexer should complete 20 mutation forms a day
• Approximate time frame 1 month (10 persons)
Time frame
There are approximately 4,500 mutation forms in Mokattam. Assuming a complement of 10 GIS and Data processing staff indexing (recording) 20 mutation forms a day, all forms should be encoded within 1 month.
Collection, scanning and indexing v0.2.ppt Module B: ESA Cadastral Operations Course
Property details
• Property address, district, governorate…
Property address Property address
Property location
Information related to the property that needs to be encoded includes: Mutation form number, Governorate Name, Town (City) Name, District Name, Block Name (if applicable), Block Number (if applicable), Street Name, Land Parcel Number, Building Number (if applicable), Map Sheet number X coordinate, Map Sheet number Y coordinate, Land Parcel Mutation Form Number (this is entered for mutation forms of building common areas and apartments) and Apartment Number (this number is entered in place of building
number and land parcel number. It is linked to the land parcel by inclusion of the land parcel mutation form number).
Collection, scanning and indexing v0.2.ppt Module B: ESA Cadastral Operations Course
Technical Report # 3-18
Initial transaction
• Location, date, Grantor-grantee, nature of transaction:
Initial transaction Initial transaction
Initial transaction
Information regarding the original contract submitted for initial registration of the property object that needs to be encoded includes: Name of contract party that interest is issued against, Name of contract party that interest is issued to, Third Party to contract (if applicable), Transaction Application Number, Transaction Application Year.
Types of transaction:
The following types of transaction may be recorded on the mutation form: Consent Sale, Sale by keeping usufruct right, Seha we Nafaz Prosecution, Seha we Nafaz Verdict, Gift, Will, Formal Pledge List, Possession Pledge List, Formal Pledge List Renewal, Possession Pledge List Renewal, Consent Division, Juridical Division Prosecution, Juridical Division Verdict, Ownership Affirmation Prosecution, Ownership Consolidation Verdict,
Expropriation Warning, Expropriation Prosecution, Verdict for Holding an Auction,
Inheritance, Consent "Farz wa Tagneeb" (Partitioning and Separation), Consent + division & Particularization, "Farz wa Tagneeb" Prosecution (Partitioning and Separation), "Farz wa Tagneeb" Verdict (Partitioning and Separation), Marginal notation, Publication Amendment (major), Publication Amendment (minor), Completing a Deal (Concluding a Transaction), Particularization, Expropriation decision for public benefit (compensated), Issuance of real estate certificate, Issuance of recent copy of a deed, Consent Sale with pledge, Assignment Prosecution, Will registration
Collection, scanning and indexing v0.2.ppt Module B: ESA Cadastral Operations Course
Subsequent transactions
• Grantor-Grantee, nature of transaction, date…
Subsequent transactions Subsequent transactions
Subsequent transactions
Information related to subsequent transactions carried out against the property object that needs to be encoded includes: Contract Registration Number, Date of Contract
Registration, Name of contract party that interest is issued against (Grantor), Name of contract party that interest in issued to (Grantee), Thor party to contract (if applicable), Type of Transaction, Transaction Application Number, Transaction Application Year.
Collection, scanning and indexing v0.2.ppt Module B: ESA Cadastral Operations Course
Technical Report # 3-20
Sketch map
• A property outline and dimensions
Property sketch Property sketch
Sketch map
The sketch map (not to scale) records parcel or building dimensions. Information from this page will not be indexed, rather it will be linked to the parcel/building that it is associated with using hyperlinks in ArcGIS see Section 6: Preparing the cadastral index map for more details.
Collection, scanning and indexing v0.2.ppt Module B: ESA Cadastral Operations Course
Creating a Mutation forms database
• Use MS Access to create two tables:
– One for property object and initial transaction (Property Object) – One for subsequent transactions (Subsequent Transactions)
• Add fields and define data types
Creating a Mutation forms database
Create the mutation forms database in MS Access. First create a new database called ‘Mutation Forms.mdb’. Next create two tables one for the property object and the initial transaction that caused the mutation form the be created in the first instance and another for subsequent transactions.
Collection, scanning and indexing v0.2.ppt Module B: ESA Cadastral Operations Course
Technical Report # 3-22
Mutation form cardinality
• One to Many relationship
– One property has many transactions
• Link tables using the Mutation Form Number field
5663482 5663482
Sold: 1984, Owner A
Sold: 1984, Owner A
Sold: 1990, Owner B
Sold: 1990, Owner B
Sold: 1996, Owner C
Sold: 1996, Owner C
Sold: 2000, Owner D
Sold: 2000, Owner D
Mutation form cardinality
Cardinality is the the correspondence or equivalency between rows in table. For example, if one row in a table corresponds to three rows in another table the cardinality is one to many (1:M) as in the case of a property (one object or row a the property object table) and sales transactions (many objects or rows in the subsequent transactions table). You can link the tables together using the common field ‘Mutation form number’ as shown below:
Collection, scanning and indexing v0.2.ppt Module B: ESA Cadastral Operations Course
Creating new tables
• Add fields and define properties
Creating new tables
In MS Access choose to ‘Create a table in Design view’, add the fields (appearing in the next slide) and define their properties e.g. whether the field is to store numbers or text and the field width. The required fields for the Property Object and Subsequent Transactions tables are described in more detail in the course exercises.
Collection, scanning and indexing v0.2.ppt Module B: ESA Cadastral Operations Course
Technical Report # 3-24
Required fields
Property Object table’s fields Property Object
table’s fields
Subsequent transactions table’s
fields Subsequent transactions table’s
fields
Required fields
The slide above shows the field names, data types and sizes of the fields in each table. Each table has the common field Mutation Form Number. You will notice field names have underscores instead of spaces, this is to ensure the tables are read correctly in ArcMap although you can have spaces between words for fields in MS Access.