*For correspondence: [email protected]
†These authors contributed
equally to this work
Present address:‡Department of Dermatology and Cutaneous Biology, Sidney Kimmel Medical College at Thomas Jefferson University, Philadelphia, United States;§University of North Carolina, Chapel Hill, United States
Competing interests:The authors declare that no competing interests exist.
Funding:See page 17
Received:26 November 2016 Accepted:28 July 2017 Published:29 August 2017
Reviewing editor: Jonathan A Cooper, Fred Hutchinson Cancer Research Center, United States
Copyright van Veen et al. This article is distributed under the terms of theCreative Commons Attribution License,which permits unrestricted use and redistribution provided that the original author and source are credited.
Negative regulation of urokinase receptor
activity by a GPI-specific phospholipase C
in breast cancer cells
Michiel van Veen
1†, Elisa Matas-Rico
1†, Koen van de Wetering
2‡,
Daniela Leyton-Puig
1, Katarzyna M Kedziora
1§, Valentina De Lorenzi
3,
Yvette Stijf-Bultsma
4, Bram van den Broek
1, Kees Jalink
1, Nicolai Sidenius
3,
Anastassis Perrakis
4, Wouter H Moolenaar
1*
1
Division of Cell Biology, The Netherlands Cancer Institute, Amsterdam,
Netherlands;
2Division of Molecular Oncology, The Netherlands Cancer Institute,
Amsterdam, Netherlands;
3IFOM, The FIRC Institute of Molecular Oncology, Milan,
Italy;
4Division of Biochemistry, The Netherlands Cancer Institute, Amsterdam,
Netherlands
Abstract
The urokinase receptor (uPAR) is a glycosylphosphatidylinositol (GPI)-anchored protein that promotes tissue remodeling, tumor cell adhesion, migration and invasion. uPAR mediates degradation of the extracellular matrix through protease recruitment and enhances cell adhesion, migration and signaling through vitronectin binding and interactions with integrins. Full-length uPAR is released from the cell surface, but the mechanism and significance of uPAR shedding remain obscure. Here we identify transmembrane glycerophosphodiesterase GDE3 as a GPI-specific phospholipase C that cleaves and releases uPAR with consequent loss of function, whereas its homologue GDE2 fails to attack uPAR. GDE3 overexpression depletes uPAR from distinct basolateral membrane domains in breast cancer cells, resulting in a less transformed phenotype, it slows tumor growth in a xenograft model and correlates with prolonged survival in patients. Our results establish GDE3 as a negative regulator of the uPAR signaling network and, furthermore, highlight GPI-anchor hydrolysis as a cell-intrinsic mechanism to alter cell behavior.DOI: https://doi.org/10.7554/eLife.23649.001
Introduction
correlates with poor prognosis, supporting the view that tumor cells hijack the uPAR signaling sys-tem to enhance malignancy (Boonstra et al., 2011;Ferraris and Sidenius, 2013;Smith and Mar-shall, 2010). Increased uPAR expression in solid tumors and the corresponding activated stroma is being evaluated by PET-imaging for patient stratification (Persson et al., 2015).
It has long been known that full-length uPAR is released from the plasma membrane resulting in a soluble form (suPAR) (Pedersen et al., 1993;Ploug et al., 1992), which is detectable in body flu-ids and considered a marker of disease severity in cancer and other life-threatening disorders (Haupt et al., 2012; Hayek et al., 2016; Shariat et al., 2007; Sidenius et al., 2000; Stephens et al., 1999). Circulating suPAR is derived from activated immune and inflammatory cells (Ferraris and Sidenius, 2013; Smith and Marshall, 2010), and also from circulating tumor cells (Mustjoki et al., 2000).
Locally produced suPAR might function as a ligand scavenger to confer negative feedback on uPAR (Smith and Marshall, 2010). In addition, both uPAR and suPAR can undergo proteolytic frag-mentation by uPA and other proteases, possibly leading to new signaling activities (Montuori and Ragno, 2009). Yet, despite decades of research, the mechanism of uPAR release and its physiologi-cal implications have been elusive. A GPI-specific phospholipase D (GPI-PLD) (Sphysiologi-callon et al., 1991) has often been assumed to mediate the shedding of GPI-anchored proteins, but this unique PLD does not function on native membranes (Mann et al., 2004).
A possible clue to the mechanism of uPAR release comes from recent studies showing that a member of the glycerophosphodiester phosphodiesterase (GDPD/GDE) family (Corda et al., 2014), termed GDE2, promotes neuronal differentiation by cleaving select GPI-anchored proteins, notably a Notch ligand regulator and heparan sulfate proteoglycans (glypicans) (Matas-Rico et al., 2016; Matas-Rico et al., 2017;Park et al., 2013). GDE2, along with GDE3 and GDE6, belongs to a GDE
eLife digest
Every process in the body, from how cells divide to how they move around, is tightly regulated. For example, cells only migrate when they receive the correct signals from their environment. These signals are recognised by receptor proteins that sit on the cell surface and connect the outside signal with the cell’s response. However, in cancer cells, these processes are out of control, which is why cancer cells can grow very quickly or spread to many different parts of the body.One important receptor protein is the urokinase receptor, which helps to reorganize the tissue, for example, when wounds heal, but also enables cancer cells to grow and spread. A special feature of urokinase receptor is the way it is connected to the cell surface, namely through a molecule that acts as an anchor, called the GPI anchor. The urokinase receptor and some other GPI-anchored proteins can be released from their anchor. However, until now it was not clear why and how the urokinase receptor is released from cells, or how losing the receptor affects the cell.
Now, van Veen, Matas-Rico et al. studied breast cancer cells, and discovered that an enzyme called GDE3 cuts the urokinase receptor off its GPI anchor to release the receptor from the cells. However, when breast cancer cells shed the urokinase receptor, they also lost the receptor from the cell surface in specific areas. As a result, the receptor could not work anymore. When breast cancer cells were experimentally modified to produce high levels of GDE3, the cancer cells became less mobile and aggressive.
Van Veen, Matas-Rico et al. then implanted ‘normal’ breast cancer cells, and breast cancer cells with extra GDE3 into mice, and observed that the tumors of mice with additional GDE3 grew less quickly. Moreover, breast cancer patients with high levels of GDE3 tend to live longer than patients with low levels of GDE3. These results suggest that the enzyme GDE3 can suppress tumor growth.
These findings uncover a new way how cells can alter their behavior, namely by cleaving GPI anchors at the cell surface. Future experiments will need to address how GDE3 itself is controlled, and if it releases other GPI-anchored proteins from cells. Once we know how to increase GDE3 activity in tumor cells, the new knowledge could one day lead to therapies to help patients with cancer.
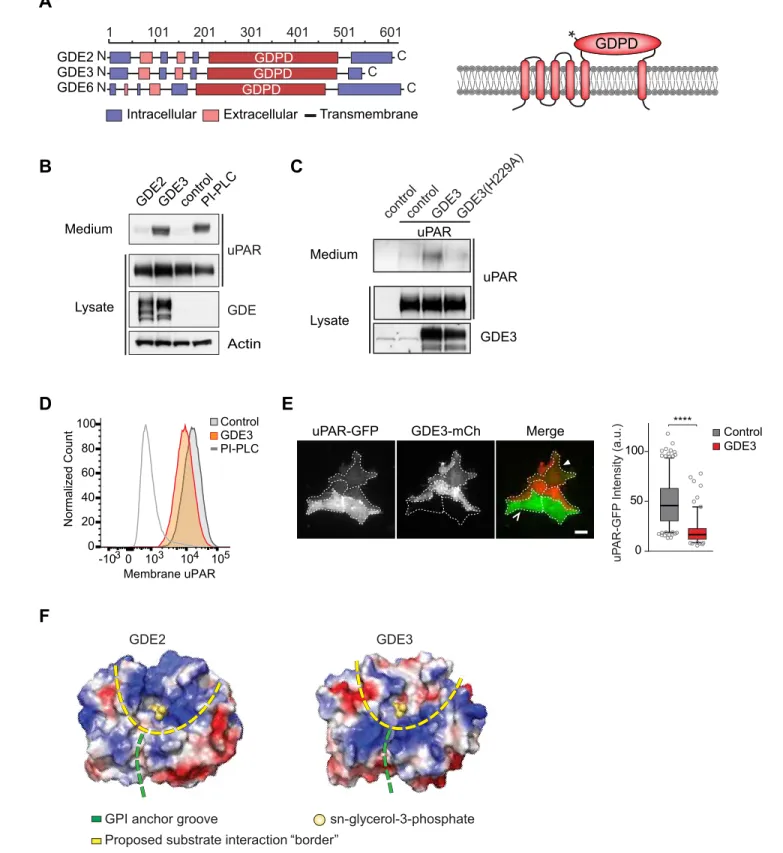
subfamily characterized by six-transmembrane-domain proteins with a conserved catalytic ectodo-main (Figure 1A) (Corda et al., 2009;Matas-Rico et al., 2016). GDE2’s close relative, GDE3, accel-erates osteoblast differentiation through an unidentified mechanism (Corda et al., 2009; Yanaka et al., 2003), while the function of GDE6 is unknown.
Here we identify GDE3 as the first mammalian GPI-specific phospholipase C (GPI-PLC) that cleaves and sheds uPAR with consequent loss of uPAR activities in both HEK293 and breast cancer cells.
Results
GDE3, but not GDE2, sheds uPAR from HEK293 cells
We set out to determine whether uPAR can be released by any of the three related GDE family members, GDE2, GDE3 and GDE6. When expressed at relatively low levels in HEK293 cells, human GDE2 and GDE3 (HA-tagged) localized to distinct microdomains at the plasma membrane, possibly representing clustered lipid rafts where GPI-anchored proteins normally reside (Maeda and Kinosh-ita, 2011), as well as to filopodia-like extensions (Matas-Rico et al., 2016) (Figure 1—figure supple-ment 1A,B). By contrast, human GDE6 was mainly detected in intracellular compartsupple-ments and therefore was not further tested (Figure 1—figure supplement 1A).
To assess GDE activity, we generated stable uPAR-expressing HEK293 cells (HEK-uPAR cells), expressed GDE2 and GDE3 and examined the appearance of suPAR in the medium, using bacterial phospholipase C (PI-PLC) as a positive control (Matas-Rico et al., 2016). Strikingly, uPAR was readily released into the medium by GDE3 and PI-PLC, but not by GDE2 (Figure 1B). GDE3 competed with exogenous PI-PLC to deplete uPAR, since PI-PLC was much less efficient in GDE3-overexpressing than in control HEK-uPAR cells (Figure 1—figure supplement 1C).
Mutating putative active-site residue H229, corresponding to H233 in GDE2 (Matas-Rico et al., 2016), abolished GDE3 activity without affecting its membrane localization (Figure 1C;Figure 1— figure supplement 1D). Furthermore, a transmembrane version of uPAR (uPAR-TM) lacking the GPI moiety (Cunningham et al., 2003) was resistant to GDE3 attack, consistent with GDE3 acting through GPI-anchor hydrolysis (Figure 1—figure supplement 1E). Flow cytometry analysis of GDE3-overexpressing cells confirmed decreased uPAR levels in the plasma membrane (Figure 1D), while TIRF microscopy revealed substantial uPAR loss from the ventral cell surface (Figure 1E).
GDE2 versus GDE3: homology modeling
The selectivity of GDE3 versus GDE2 towards uPAR cleavage is striking. In an attempt to understand the structural basis of this selectivity, we constructed homology-based models of the globulara/b barrel GDPD domains, using I-TASSER (Yang et al., 2015). We reasoned that the catalytic domains must recognize not only the PI lipid moiety at the membrane-water interface, but also the attached protein. While GDE2 and GDE3 have a similar putative GPI-binding groove leading to the active site, they show striking differences in their surface charge distribution, particularly at the putative substrate interaction surface (Figure 1F). It therefore seems likely that surface properties are a major determinant of selective substrate recognition by GDEs, a notion that should be validated by future structural studies.
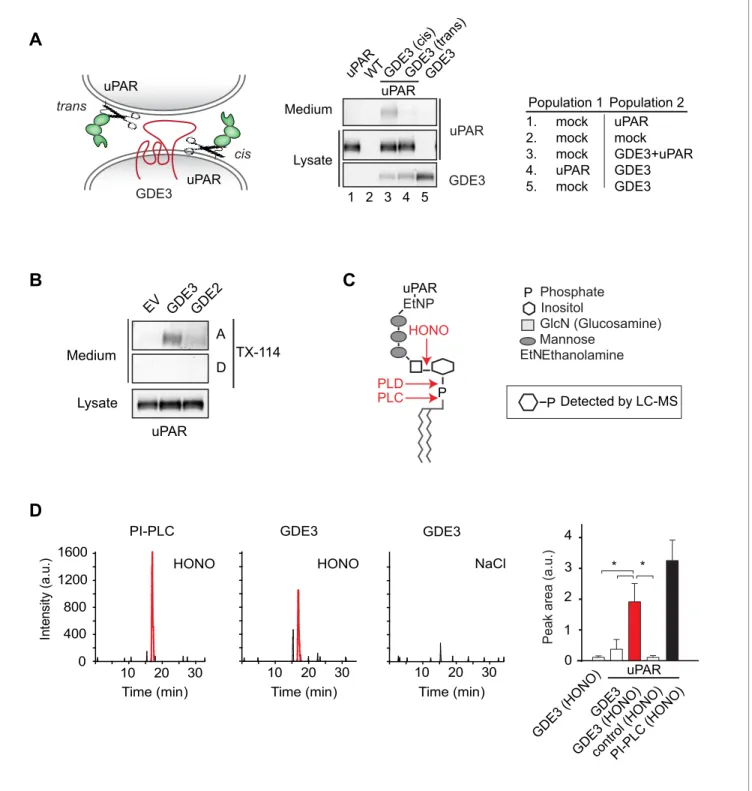
GDE3 is a GPI-specific phospholipase C that cleaves uPAR in cis
B
Actin PI-PLC control GDE2GDE3 Medium
Lysate
uPAR
GDE
GDE3(H229A) GDE3
control
Medium
Lysate
uPAR
GDE3 uPAR
control
Control GDE3
uP
AR-GFP
Intensity (a.u.)
uPAR-GFP GDE3-mCh Merge
0 20 40 60 80 100
Normalized Count
Control GDE3 PI-PLC
0 50 100
****
E
D
GDE2 GDE3
sn-glycerol-3-phosphate GPI anchor groove
Proposed substrate interaction “border”
F
A
GDPD
Intracellular Extracellular Transmembrane N
101 201 301 401 501 601
1
N C
N C
GDE2 GDE3
N C
GDE6
GDPD GDPD GDPD
C
Membrane uPAR 0
-103 103 104 105
*
Figure 1.GDE3, but not GDE2, sheds uPAR from HEK293 cells. (A) Domain structure of GDE2, GDE3 and GDE6 (left panel), and the transmembrane scheme of GDE3 (right panel). GDPD denotes catalytic glycerophosphodiesterase domain. Asterisk in GDPD domain depicts catalytic His residue in both GDE2 and GDE3. (B) Immunoblot analysis of uPAR release into the medium. HEK-uPAR cells transfected with empty vector (control), GDE2 or GDE3. PI-PLC served as positive control. (C) Mutant GDE3(H229A) fails to release uPAR. (D) Partial loss of uPAR from the plasma membrane by GDE3,
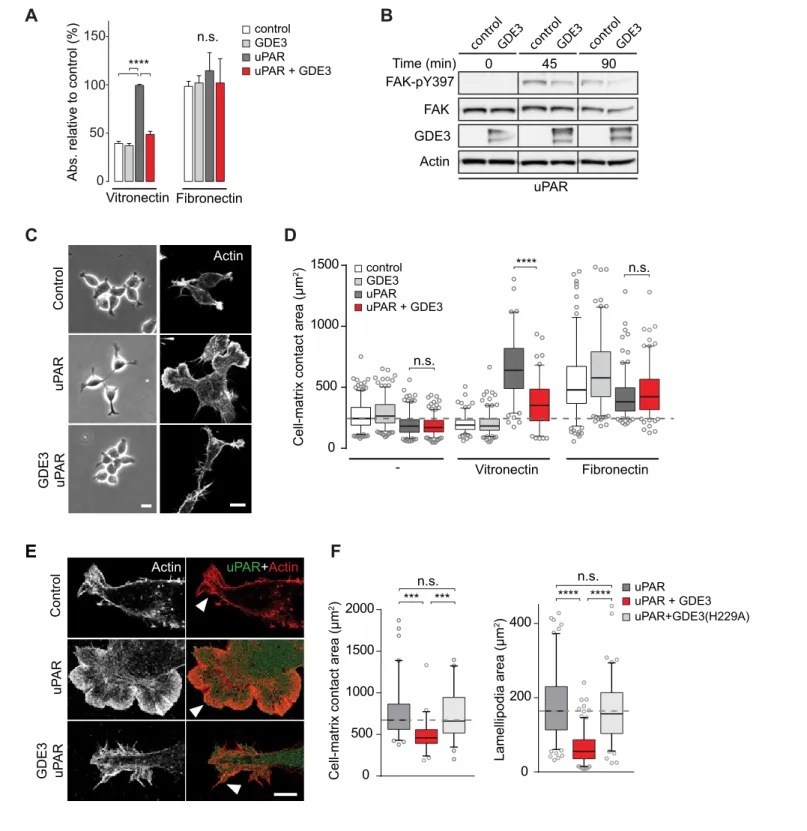
GDE3 suppresses the vitronectin-dependent activities of uPAR
When compared to uPAR-deficient cells, HEK-uPAR cells showed markedly increased cell adhesion, loss of intercellular contacts and enhanced spreading with prominent lamellipodia formation on vitronectin, but not on fibronectin (Figure 3A), typical features of a Rac-driven motile phenotype, in agreement with previous studies (Kjøller and Hall, 2001;Madsen et al., 2007). Cell spreading coin-cided with activation of focal adhesion kinase (FAK), indicative of integrin activation (Figure 3B). Strikingly, expression of GDE3 largely abolished the uPAR-induced phenotypes and cellular responses (Figure 3A–F). Catalytically dead GDE3(H229A) had no effect, neither had overexpressed GDE2 (Figure 3F and results not shown). Thus, by releasing uPAR from the plasma membrane, GDE3 suppresses the vitronectin-dependent activities of uPAR. Treatment of diverse cell types with suPAR-enriched conditioned media from HEK293 cells did not evoke detectable cellular responses, supporting the notion that suPAR is biologically inactive, at least under cell culture conditions.
GDE3 locally depletes uPAR and suppresses its activities in breast
cancer cells
We next assessed the impact of GDE3 on endogenous uPAR activity in MDA-MB-231triple-negative breast cancer cells. These cells express relatively high levels of uPAR (Figure 4A) and its ligand uPA (LeBeau et al., 2013), thus forming an autocrine signaling loop. Expression of GDE3 (encoded by GDPD2) is relatively low in breast cancer lines (n = 51), including MDA-MB-231 cells (Barretina et al., 2012) (Figure 4B). GDE3 expression in MDA-MB-231 cells led to a modest loss of uPAR from the plasma membrane as shown by flow cytometry (Figure 4C). To determine how GDE3 expression affects localized uPAR levels at the basolateral plasma membrane, we used confocal and dual-color super-resolution microscopy in TIRF mode. Strikingly, basolateral membrane microdo-mains containing wild-type GDE3 showed little or no colocalization with endogenous uPAR. In marked contrast, catalytically dead GDE3(H229A) clearly colocalized with uPAR in those membrane domains (Figure 4D). Quantification of co-localization was performed on multiple cells (Figure 4D, right panel). These results strongly suggest that active GDE3 depletes uPAR levels from distinct domains at the basolateral membrane. Consistent with this, CRISPR-based knockout of GDE3 resulted in increased basolateral uPAR levels when the cells were plated on vitronectin (Figure 4E,F; Figure 4—figure supplement 1).
Wild-type MDA-MB-231 cells adopted a motile phenotype on vitronectin, as evidenced by increased cell spreading with marked lamellipodia formation (Figure 5A–C), strongly reminiscent of a uPAR-regulated phenotype. Overexpressed GDE3 abolished the vitronectin-dependent phenotype of MBD-MB-231 cells (Figure 5A–C). Very similar effects of GDE3 overexpression were observed in another uPAR-positive breast cancer cell line (triple-negative Hs578T cells) (Figure 5—figure supple-ment 1). Of note, no effects were observed upon GDE2 overexpression in these cells (data not shown).
To confirm that GDE3 acts through uPAR attack, we expressed non-cleavable uPAR-TM to com-pete out endogenous uPAR, and found that the GDE3-induced reduction of cell spreading on vitro-nectin was largely inhibited (Figure 5B). Furthermore, shRNA-mediated knockdown uPAR (Figure 5D) gave rise to the same phenotype as GDE3 overexpression, namely reduced cell adhe-sion, spreading and lamellipodia formation on vitronectin (Figure 5E,F,G).
Figure 1 continued
as measured by flow cytometry. (E) TIRF microscopy reveals loss of uPAR from the basolateral plasma membrane. Box plot shows uPAR-GFP intensity at the ventral membrane (n = 3, mean±SEM ****p<0001). (F) Homology modeling of the GDE2 and GDE3 catalytic domains showing surface charge distributions (blue, positive; red, negative; green line, putative GPI-binding groove; yellow line, proposed substrate-binding surface). The active site is indicated by glycerol-3-phosphate located at the template structure.
DOI: https://doi.org/10.7554/eLife.23649.003
The following figure supplement is available for figure 1:
Figure supplement 1.GDE subcellular localization and induction of uPAR release from HEK293-uPAR cells.
PLC EtNP
GlcN (Glucosamine) Mannose
Inositol
EtNEthanolamine
P
P Phosphate
PLD
P Detected by LC-MS
Peak area (a.u.)
0 1 2 3 4
* *
GDE3 (HONO) GDE3
GDE3 (HONO)control (HONO)PI-PLC (HONO) uPAR
D
GDE3
HONO
GDE3
10 20 30 10 20 30
10 20 30
Time (min) 0
400 800 1200 1600
In
te
n
si
ty (a.u.)
PI-PLC
HONO
Time (min) Time (min)
NaCl HONO
uPAR
A
C
Medium
Lysate
uPAR
GDE3 GDE3
trans
cis
uPARWT GDE3 (cis)GDE3GDE3 (trans) uPAR
1 2 3 4 5 uPAR
uPAR
uPAR mock GDE3+uPAR GDE3 GDE3 1. mock
2. mock 3. mock 4. uPAR 5. mock
Population 1 Population 2
Medium
Lysate
uPAR EV GDE3GDE2
A
D
TX-114
B
Figure 2.GDE3 is a GPI-specific PLC that cleaves uPAR in cis. (A) (Left) Scheme showing uPAR cleavage in cis or trans. (Right) GDE3-expressing HEK-uPAR cells were mixed with a GDE3-deficient cell population, as indicated. Immunoblot analysis of HEK-uPAR in medium and cell lysates indicates that GDE3 acts in cis; mock refers to empty vector-transfected cells. (B) GDE3 expression leads to increased GPI-free suPAR. Conditioned medium from HEK-uPAR cells expressing GDE2 or GDE3 was subjected to Triton X-114 phase separation. suPAR in the aqueous (A) and detergent (D) fractions was analyzed by immunoblotting. (C) GPI-anchor with phospholipase cleavage sites indicated; HONO, nitrous acid. (D) Representative LC-MS ion chromatograms (m/z 259.02–259.03); inositol 1-phosphate peaks in red. HONO-treated suPAR contains inositol 1-phosphate (n = 3, mean±SEM; *p<0.05).
uP
AR
GDE3 uP
AR
A
FAK-pY397
FAK
GDE3 Time (min)
Actin
0 45 90
Actin
E
Cell-matrix contact area (µm
2)
Lamellipodia area (µm
2)
0 500 1000 1500 2000
0 200 400
**** ****
n.s.
*** ***
n.s. 0
500 1000 1500
- Vitronectin Fibronectin
Cell-matrix contact area (µm
2)
uP
AR
GDE3 uP
AR
F
Actin uPAR+Actin
Control
Control
con trol
GDE3 con trol
GDE3 con trol
GDE3
Abs. relative to control (%)
Vitronectin Fibronectin n.s.
****
150
100
control GDE3 uPAR + GDE3 uPAR
50
0
B
uPAR
C
D
control GDE3 uPAR + GDE3 uPAR
uPAR+GDE3(H229A) uPAR + GDE3 uPAR
n.s.
n.s.
****
Figure 3.GDE3 suppresses uPAR activity in HEK-uPAR cells. (A) uPAR confers increased adhesion to vitronectin, but not fibronectin, which is prevented by GDE3 expression (n = 3, mean±SEM), ****p<0.0001; n.s., not significant. (B) GDE3 inhibits FAK activation during cell adhesion. FAK activity was assayed at the indicated times after plating. (C) GDE3 inhibits uPAR-induced cell spreading, scattering and lamellipodia formation on vitronectin (bar, 10mm). (D) Cell-matrix contact area of cells expressing the indicated constructs plated on either fibronectin or vitronectin; (-) denotes cells on uncoated cover slips. Box plots show the mean of three independent experiments. Dotted line represents the mean of control cells (n = 3, mean±SEM,
****p<0.0001; n.s., not significant). (E) uPAR-induced lamellipodia on vitronectin disappear upon GDE3 expression, as shown by super-resolution
GDE3 overexpression attenuates the transformed phenotype, slows
tumor growth in vivo and correlates with improved survival in breast
cancer
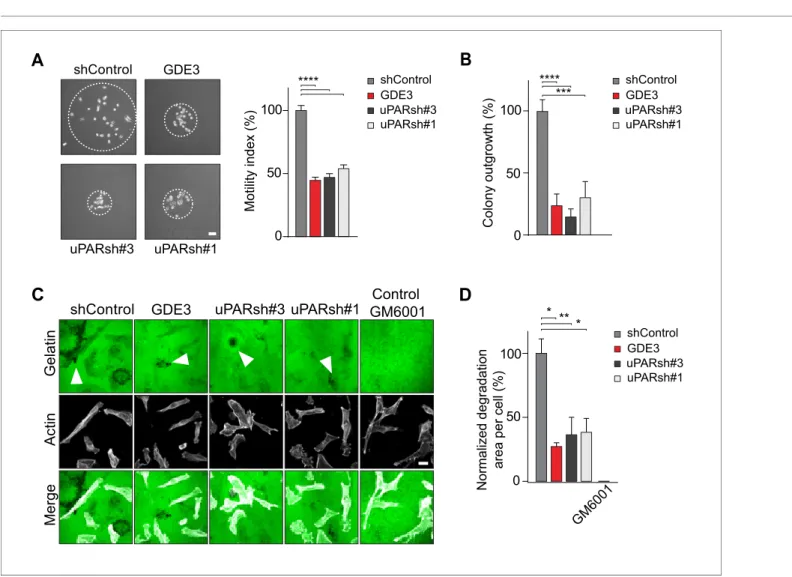
In long-term assays, wild-type MDA-MB-231 cells showed marked scattering, indicative of increased cell motility with loss of intercellular contacts (Figure 6A). Again, GDE3 overexpression mimicked uPAR depletion either in greatly reducing both cell motility and clonogenic potential, using either shRNA-mediated knockdown (Figure 6A,B) or CRISPR-mediated knockout of uPAR (Figure 6—fig-ure supplement 1).
Having shown that GDE3 suppresses the non-proteolytic activities of uPAR, we next examined how GDE3 affects uPAR-driven proteolytic matrix degradation by MDA-MB-231 cells. Also in this cell system, GDE3 overexpression mimicked uPAR silicencing in inhibiting the degradation of a gela-tin matrix (mixed with vitronecgela-tin) in the presence of serum (Figure 6C,D) (Figure 6—figure supple-ment 1). On the basis of these results, we conclude that GDE3 attenuates the transformed phenotype of uPAR-positive breast cancer cells through loss of functional uPAR.
When injected into the mammary fat pads of female nude mice, GDE3-overexpressing MDA-MB-231 cells showed diminished tumor growth over time, when compared to empty vector-expressing cells (Figure 7A), consistent with the cell-based data. However, the full implications of GDE3 expres-sion on uPAR-dependent tumor growth remain to explored in further detail. Finally, in patients, high expression ofGDPD2was found to correlate with prolonged relapse-free survival in breast cancer, particularly in triple-negative (basal-like) subtype patients (N = 618) (Figure 7B). No such correlation was found for GDE2 (encoded byGDPD5; not shown). This suggests that GDE3/GDPD5 may serve as a marker of clinical outcome in breast cancer.
Discussion
GPI-anchoring is a compIex post-translational modification that anchors select proteins in the outer leaflet of the plasma membrane. Despite decades of research, the biological significance of GPI anchors has long remained a mystery (Kinoshita and Fujita, 2016; Paulick and Bertozzi, 2008). Some GPI-anchored proteins are released from their anchor and detected in body fluids, implying involvement of one or more endogenous GPI-specific hydrolases. Recent studies have advanced the field by showing that cleavage and shedding of certain GPI-anchored proteins is mediated by a cell-intrinsic transmembrane glycerophosphodiesterase, termed GDE2 (or GDPD5), thereby promoting neuronal differentiation through multiple signaling pathways (Matas-Rico et al., 2016; Matas-Rico et al., 2017;Park et al., 2013).
In this study, we focused on the shedding of GPI-anchored uPAR because of its regulatory role in multiple cellular and (patho)physiological activities, while soluble uPAR is considered a biomarker of various human pathologies. Here we report that GDE3 functions as a long-sought GPI-specific PLC that releases uPAR from its anchor. By contrast, its homologue GDE2 failed to release uPAR. As a consequence of GDE3 action, uPAR loses its vitronectin-dependent and matrix-degrading activities, when assayed in HEK293-uPAR and triple-negative breast cancer cells that express both uPAR and uPA. Importantly, loss of uPAR expression by GDE3 was found to be restricted to certain microdo-mains at the basolateral plasma membrane, where signal transduction is likely to take place. Thus, by acting as a GPI-specific PLC towards uPAR, GDE3 is a negative regulator of the uPAR signaling network (Figure 7C) that includes uPAR’s proteolytic and non-proteolytic activities. Consistent with this, GDE3 overexpression in uPA/uPAR-positive MDA-MB-231 breast cancer cells slowed tumor progression in a xenograft mouse model. Although statistically significant, the inhibitory effect of GDE3 overexpression on tumor growth was not dramatic, which should not come as a surprise since MDA-MBA-31 cells express the strongly oncogenic mutant K-RAS protein, which tends to override the regulation of numerous signaling pathways. Yet, this finding adds to the relevance of GPI-Figure 3 continued
microscopy (bar, 5mm). (F) Quantification of cell-matrix contact area in GDE3- and GDE3(H229A)-expressing cells. GDE3(H229A) fails to affect lamellipodia formation (n = 3, mean±SEM ***p<0.001; ****p<0.0001).
A
E
GDE3 GDE3 KO2
Control
0 50 100 150
F
Basal membrane uP
AR
area rel. to control (%)
Control GDE3
GDE3 KO2 GDE3 KO1
****
GDE3 KO1
D
GDE3
uPAR Merge
GDE3(H229A)
GDE3
uPAR Merge
GDE3
uPAR
Merge GDE3
uPAR Merge
GDE3 uPAR
Actin
MDA-MB-231 HEK293
B
C
GDE3
GAPDH
HEK293
MDA-MB-231
uPAR
0
-103 103 104 105 0
20 40 60 80 100
20 40 60 80 100
Normalized Count
0 103 104 105
Normalized Count
GDE3 expression Membrane uPAR
Control GDE3
GDE3 (H229A) GDE3
****
0.0 0.1 0.2 0.3
Mander
’s coef
specific phospholipases in slowing tumor progression. Furthermore, high GDE3 expression was found to correlate with increased survival probability in triple-negative breast cancer patients. Inter-estingly, our previous work revealed a similar association between overexpression of GDE2 and posi-tive clinical outcome in neuroblastoma patients, which appears attributable to GDE2-induced glypican shedding(Matas-Rico et al., 2016). The present patient survival analysis should be inter-preted with caution, however, since involvement of uPAR release remains to be formally proven. Fur-thermore, we cannot rule out that GDE3 may cleave additional GPI-anchored substrates whose functional loss could contribute to positive clinical outcome.
The present results predict that, depending on its expression levels, GDE3 may downregulate normal uPAR-dependent remodeling processes. Indeed, upregulated GDE3 accelerates osteoblast differentiation (Corda et al., 2009;Yanaka et al., 2003) in a manner resembling the uPAR knockout phenotype (Furlan et al., 2007). Furthermore, a striking >200 fold upregulation ofGDE3/GDPD2is observed during blastocyst formation (Munch et al., 2016), implicating GDE3 in the invasion of pre-implantation embryos, a process in which the uPA/uPAR signaling network has been implicated (Multhaupt et al., 1994;Pierleoni et al., 1998). Although correlative, these results support the view that GDE3 is upregulated to downregulate uPAR activity in vivo. The present findings also suggest that circulating full-length suPAR should be regarded as a marker of GDE3 activity, not necessarily reflecting uPAR expression levels.
It will now be important to determine how GDE3 expression and activity are regulated and, fur-thermore, to explore the substrate selectivity of the respective GDEs in further detail. Homology modeling revealed striking differences in electrostatic surface properties of GDE2 versus GDE3, sug-gesting that protein-protein interactions may determine substrate recognition by these GDE family members. Specific GPI-anchor modifications (Kinoshita and Fujita, 2016; Paulick and Bertozzi, 2008) could also determine the sensitivity of GPI-anchored proteins to GDE attack.
Finally, when regarded in a broader context, the present and previous findings (Matas-Rico et al., 2016; Matas-Rico et al., 2017; Park et al., 2013) support the view that vertebrate GDEs, notably GDE2 and GDE3, have evolved to modulate key signaling pathways and alter cell behavior through selective GPI-anchor cleavage.
Materials and methods
Cell culture and materials
HEK293, MDA-MB-231 and Hs578T cells were obtained from the ATCC and grown in Dulbecco’s modified Eagle’s medium (DMEM) supplemented with 10% fetal bovine serum (FBS) and antibiotics at 37
˚
C under 5% CO2. Original MDA-MB-231 cells were pathogen tested using the ImpactI test (Idexx Bioresearch, Westbrook, ME, USA) and were negative for all pathogens tested. All cell lines were routinely tested negative for mycoplasma contamination. Antibodies used: mCh and anti-GFP, home-made; anti-Flag, M2, anti-Vinculin andb-Actin (AC-15) from Sigma; anti-uPAR (MAB807) from R&D systems; anti-uPAR (13F6) (Zhao et al., 2015); anti-FAK(pTyr397) from Thermo Fisher. Figure 4.GDE3 depletes uPAR from distinct basolateral membrane domains in MDA-MB-231 breast cancer cells. (A) Endogenous uPAR expression in MDA-MB-231 versus HEK293 cells, as determined by immunoblot. (B) EndogenousGDPD2expression, as determined by qPCR analysis. (C) (left) Cell-surface expression of GDE3-mCherry of MDA-MB-231 cells expressing GDE3, as detected by flow cytometry. (Right) Cell-Cell-surface expression of uPAR in control (grey) and GDE3-expressing MDA-MB-231 cells (red), as detected by flow cytometry. (D) Confocal (top) and dual-color super-resolution microscopy images (bottom) of MDA-MB-231 cells expressing GDE3-GFP or catalytically dead GDE3(H229A)-GFP. Endogenous uPAR was immunostained in red. Merged images show colocalization of uPAR with GDE3(H229A) but not with wild-type GDE3 and uPAR. Scale bars, 10mm (confocal) and 1mm (super-resolution). Co-localization analysis (Mander’s coefficient) on peripheral uPAR patches in confocal images was done using ImageJ software (n = 30 cells, three independent experiments). (E) Endogenous uPAR staining in control, GDE3-overexpressing and GDE3 knockout MDA-MB-231 cells plated on vitronectin. Two distinct GDE3 knockout clones (KO1 and KO2) were examined, as indicated. Scale bar,10mm. (F) Quantification of basolateral uPAR-containing membrane domains referring to the cells in panel (E) (n = 3, mean±SEM, ****p<0.0001). GDE3 suppresses the vitronectin- and uPAR-dependent phenotype of MDA-MB-231 breast cancer cells.DOI: https://doi.org/10.7554/eLife.23649.007
The following figure supplement is available for figure 4:
Figure supplement 1.GDE3 knockout validation.
0 1000 2000
- Fibronectin Vitronectin
n.s.
n.s.
Cell-matrix contact area (µm
2)
Lamellipodia area (µm
2) ****
GDE3 Control
uPAR
Actin
F
0 50 100 150
Fibronectin Vitronectin
** *** n.s.
E
0 200 400
Vitronectin
0 1000 2000
Cell-matrix contact area (µm
2) ****
D
uPARsh#3 uPARsh#1
GDE3 shControl
uPARsh#3 uPARsh#2 uPARsh#1 shControl
Vitronectin
A
G
shControl GDE3 uPARsh#1 uPARsh#3
shControl uPARsh#1 uPARsh#2 uPARsh#3
0 0.8 1
0.6 0.4 0.2
Relative uP
AR intensity [A.U.]
B
C
shControl GDE3 uPARsh#1 uPARsh#3
Control GDE3
GDE3 Control
GDE3 + uPAR-TM Control + uPAR-TM
n.s. ****
Abs. relative to control (%)
VN
-VN
-Control GDE3
Figure 5.GDE3 suppressess the vitronectin- and uPAR-dependent transformed phenotype of MDA-MB-231 breast cancer cells. A) Confocal images showing that GDE3 prevents cell spreading and lamellipodia formation on vitronectin (VN) but not on uncoated cover slips (-). Bar, 10mm. (B)
Quantification of reduced cell spreading on vitronectin by GDE3. Non-cleavable uPAR-TM prevents GDE3 attack. ****p<0.0001; n.s., not significant. (C) Quantification of lamellipodia formation on vitronectin. ****p<0.0001. (D) Immunoblot analysis of shRNA-mediated uPAR knockdown; maximum knockdown was achieved by small hairpins #1 and #3. The upper protein band represents full-length uPAR, the lower band proteolytically cleaved uPAR
Vitronectin, fibronectin, inositol 1-phosphate (dipotassium salt) and inositol were purchased from Sigma-Aldrich. B. cereus PI-PLC was from Molecular Probes. Phalloidin red (actin-stain 647 Figure 5 continued
(D2 +D3) (Høyer-Hansen et al., 1992). (E) GDE3 overexpression mimics the uPAR knockdown phenotype in cells plated on vitronectin (VN); bar, 10mm. (-) denotes cells on non-coated cover slips. (F,G) Quantification of cell adhesion (F) n = 3; mean±SEM) and cell spreading (G) induced by GDE3 and uPAR knockdown on the indicated substrates. *p<0.05 **p<0.01; ****p<0.0001. GDE3 overexpression attenuates the uPAR-dependent transformed phenotype of breast cancer cells.
DOI: https://doi.org/10.7554/eLife.23649.009
The following figure supplement is available for figure 5:
Figure supplement 1.GDE3 overexpression suppresses the uPAR-vitronectin-dependent phenotype in Hs578T breast cancer cells.
DOI: https://doi.org/10.7554/eLife.23649.010
0 50 100
Colony outgrowth (%)
B
0 50 100
Motility index (%)
****
shControl GDE3
uPARsh#1 uPARsh#3
A
Normalized degradation
area per cell (%)
C
0 50 100
GM6001 *
* **
Gel
a
tin
A
c
tin
Merge
GDE3
Control GM6001 uPARsh#1
uPARsh#3 shControl
D
shControl GDE3 uPARsh#1 uPARsh#3
shControl GDE3 uPARsh#1 uPARsh#3 ****
***
shControl GDE3 uPARsh#1 uPARsh#3
Figure 6.GDE3 attenuates the uPAR-dependent transformed phenotype of breast cancer cells. (A) GDE3 overexpression in MDA-MB-231 cells mimics uPAR knockdown in inhibiting cell scattering. MDA-MB-231 cells grow out as scattered colonies; bar, 100mm (n = 3, mean±SEM; ***p<0.001;
****p<0.0001). (B) GDE3 overexpression mimics uPAR knockdown in suppressing colony formation. colonies were counted after 14 days (n = 3, mean ±SEM; ***p<0.001; ****p<0.0001. (C) Degradation of a gelatin matrix mixed with vitronectin by MDA-MB-231 cells in the presence of serum (bar, 10 mm). Arrows point to black spots where gelatin was degraded. Metalloprotease inhibitor GM6001 was used as a control. (D) Quantification of matrix degradation at 20 hr after plating (mean±SEM; *p<0.05; **p<0.01).
DOI: https://doi.org/10.7554/eLife.23649.011
The following figure supplement is available for figure 6:
Figure supplement 1.uPAR knockout in MDA-MB-231 cells phenocopies GDE3 overexpression.
phalloidin) and green (actin-stain 488 phalloidin) were from Cytoskeleton. GM6001 was from Milli-pore. Research Source Identifiers: MDA-MB-231 cells RRID:CVCL_0062; Hs578T cells RRID:CVCL_ 0332; Antibodies: Flag M2 RRID:AB_259529; Anti Vinculin RRID:AB_10746313; Anti actin RRID:AB_ 2223210; uPAR RRID:AB_2165463.
Expression vectors
GDE2 cDNA was subcloned as described (Matas-Rico et al., 2016). GDE3 cDNA was amplified by PCR and subcloned into a pcDNA3-HA plasmid using AflII/HpaI (PCR product) and AflII/EcoRV (plas-mid) restriction sites. GDE3 was recloned into a pcDNA3(-mCherry) construct by PCR amplification
GDE3
ECM Degradation
suPAR
Plasmin
uPA
Integrins Co-receptors
Cell Adhesion Moltility Invasion
VN
FAK
Rac
A
0 40 80 120
+5 í
logrank P = 0.00032
0.0 0.2 0.4 0.6 0.8 1.0
Overall survival probability
Follow-up in months
High Q
Low Q
GDPD2
B
MDA-MB-231 WT MDA-MB-231 GDE3
T
XPRUYROXPHQPP
1000 1200
800
600
400
200
0 1400
Days post cell injection
12 20 28 36 44 52 58 65
** ***
C
Figure 7.GDE3 overexpression in breast cancer cells slows tumor growth in mice, correlating with higher survival probability in patients. (A) Female nude mice (n = 16) were injected with either wild-type or GDE3-overexpressing MDA-MB-231 cells into the mammary fat pad, as described under Materials and methods. Tumor volume was measured every three days after injection for 9 weeks until the tumor had grown to the appropriated size (data represent the mean±SEM; **p<0.01; ***p<0.001, t-test corrected for multiple comparison). (B) High GDPD2 expression significantly correlates with higher survival rate in triple-negative (basal-like) subtype breast cancer patients (N = 618). HR, hazard ratio with 95% confidence interval indicated. Analysis based on microarray data (www.kmplot.com). (C) Schematic model. GDE3 functions as a GPI-PLC that cleaves and sheds uPAR, leading to loss of uPAR function. VN, vitronectin, FAK, focal adhesion kinase, suPAR, soluble uPAR.
with restriction sites PmI1/Xba1, followed by vector digestion using EcoRV/Xba1. GDE6 transcript variant X7 (GDPD4; NCBI: XM_011544834.1) was cloned into pcDNA5_FRT_TO_puro (provided by dr. Geert Kops, University Medical Center Utrecht). All constructs were epitope- tagged on the C-terminus unless otherwise stated. Mutant GDE3(H229A) was generated by amplification with oli-gos containing the mutation, followed by Dpn1 digestion of the template. The viral plasmids (pBABE-GDE3-mCh, pBABE-uPAR-GFP) were constructed by subcloning the GDE3-pcDNA3 and uPAR-GFP-pEGFP-N1 into a pBABE plasmid. GDE3-mCherry-pcDNA3 was cut using PmeI followed by digestion of the pBABE backbone with SnaBI. uPAR-GFP-pEGFP-N1 was cut with BglII and HpaI and ligated into the pBABE vector, digested with BAMHI and SnaB1. Constructs GFP, uPAR-FLAG and non-cleavable uPAR-TM were previously described (Caiolfa et al., 2007; Cunningham et al., 2003). Transmembrane-anchored uPAR-TM was constructed by substituting the GPI-anchoring sequence of uPAR (aa 274–313) with the transmembrane region (aa 614–653) of the human epidermal growth factor receptor (EGFR), as described (Cunningham et al., 2003).
Transfections and RNA
i-mediated knockdown
Cells stably expressing uPAR-GFP or GDE3-mCherry were generated using retroviral transduction and subsequent selection with puromycin. Transient transfections were done using the calcium phos-phate protocol or XtremeGene 9 agent (Roche). Stable uPAR knockdown in MDA-MB-231 cells was achieved using shRNAs in a lentiviral pLKO vector; five shRNAs from three RC human shRNA library were tested: TRCN0000052637, TRCN0000052636, TRCN0000052634, TRCN0000052633 and TRCN0000052635. The latter two were used for experiments; sequences: CCGGCCCATGAATCAA TGTC TGGTACTCGAGTACCAGACATTGATTCATGGGTTTTTG and CGGGCTTGAAGA TCAC-CAGCCTTACTCGAGTAAGGCTGGTGATCTTCAAGCTTTTTG, respectively. For virus production, HEK293T cells were transiently transfected using calcium phosphate, and virus particles were col-lected 48 hr thereafter. uPAR knockdown cells were secol-lected in medium containing 2 mg/ml puromycin.
CRISPR knockout
uPAR and GDE3 knockout cell lines were generated using CRISPR/Cas9 genome editing. CRISPR sequences were designed targeting uPAR (PLAUR; exon 2; 5’- CATGCAGTGTAAGACCAACG-3’ and 5’-CCAGGGCGCACTCTTCCACA-3’) or GDE3 (GDPD2; exon 2; 5’-AGGATGCAAACCAG-CAAGG-3’)and cloned into pX330 (Cong et al., 2013). MDA-MB-231 cells were transfected with the exon-specific pX330 plasmids in addition to a plasmid containing a guide RNA to the Danio RerioTIA gene (5’- GGTATGTCGGGAACCTCTCC -3’) and a cassette of a 2A sequence followed by a BlastR gene, flanked by two TIA target sites. Co-transfection results in infrequent integration of the BlastR gene at the targeted genomic locus by NHEJ, as previously described (Blomen et al., 2015). Successful integration of the cassette renders cells resistant to blasticidin. Three days follow-ing transfection, the culture medium was supplemented with blasticidin (25mg/ml). Surviving colo-nies were clonally expanded, screened for cassette integration and indels into the query gene by PCR (GDE3; 5’- TATGAATCCTGCCCGAAAAG-3’ and 5’-AGAGCAGGCCAAACCAGATA-3’) or by western blot analysis of the target protein (uPAR).
Liquid chromatography-mass spectrometry (LC-MS)
45–50 min 100% B; 50–50.1 min 20% B; 50.1–60 min 20% B) of 100% acetonitrile (mobile phase A) and 50 mM ammonium acetate adjusted to pH 8.0 with ammonium hydroxide (mobile phase B) at a flow rate of 15 ml/min. Inositol 1-phosphate was detected with an LTQ-Orbitrap Discovery mass spectrometer (Thermo Fisher Scientific) operated in negative ionization mode scanning from m/z 258 to 260 with a resolution of 30,000 FWHM. Electrospray ionization was performed with a capillary temperature set at 300
˚
C and the sheath, auxiliary and sweep gas flow set at 17, 13 and 1 arbitrary units (AU), respectively. Setting for Ion guiding optics were: Source voltage: 2.4 kV, capillary voltage: 18 V, Tube Lens: 83 V, Skimmer Offset: 0 V, Multipole 00 Offset: 5 V, Lens 0: 5 V, Multipole 0 Off-set: 5.5 V, Lens 1: 11 V, Gate Lens OffOff-set: 68 V, Multipole 1 OffOff-set: 11.5 V, Front Lens: 5.5 V. Data acquisition was performed using Xcalibur software (Thermo Fisher Scientific). Reference inositol phosphate (Sigma) was used to determine the retention on the Zorbax HILIC plus column. After applying Xcalibur’s build-in smoothing algorithm (Boxcar, 7), extracted ion chromatograms (m/z 259.02–259.03) were used to semi-quantitatively determine inositol phosphate levels.Cell adhesion and spreading
48-wells plates were coated overnight at 4
˚
C with fibronectin (10mg/ml) or vitronectin (5mg/ml), or left untreated. Thereafter, plates were blocked for 2 hr at 37˚
C using 0.5% BSA in PBS. Cells were washed and harvested in serum-free DMEM supplemented with 0.1% BSA. Equal numbers of cells were seeded and allowed to adhere for 1 hr. Non-adherent cells were washed away using PBS. Attached cells were fixed with 4% paraformaldehyde (PFA) for 10 min, followed by washing and staining with Crystal violet (5 mg/ml in 2% ethanol) for 10 min. After extensive washing, cells were dried and lysed in 2% SDS for 30 min. Quantification was done by measuring absorbance at 570 nm using a plate reader. For cell-matrix contact area and lamellipodia measurements, coverslips were coated overnight with fibronectin or vitronectin and washed twice with PBS. Cells were trypsinized, washed and resuspended in DMEM and left to adhere and spread for 4 hr. After fixation (4% PFA) and F-actin staining with phalloidin, images were taken using confocal microscopy. Cell and lamelli-podia area was quantified using an ImageJ macro.Cell scattering and colony formation
Cell scattering was determined as described (LeBeau et al., 2013). In brief, single MDA-MB-231 cells were allowed to grow out as colonies, and the area covered by the scattered colonies (colony size) was measured at 6 days after plating. For measuring colony outgrowth, 500 cells were plated and colonies were counted after 14 days.
Matrix degradation
Coverslips were coated with OG-labelled gelatin (InVitrogen) supplemented with vitronectin (5mg/ ml). About 100.000 cells per coverslip were seeded in DMEM with 10% FCS. After 20 hr, cells were washed, fixed with 4% PFM and stained with phalloidin-Alexa647 (InVitrogen). Gelatin degradation was determined from confocal images of >15 randomly automatically chosen fields of view per cov-erslip (testing at least two covcov-erslips/condition on two separate days: total four covcov-erslips per condi-tion). The images were randomized and the area of degradation was normalized to the total area of cells or to the number of cells.
RT-qPCRT
TGTTCGTCATGGGTGT-3’, GAPDH reverse CCAGGGGTGCTAAGCAGTT-3’, GDE3 forward 1 5’-TGTTTGAGACTGATGTGATGGTC-3’, GDE3 reverse 1 5’-TTCGGGTTGGGAATACAGAG-3’
Western blotting
For Western blotting, cells were washed with cold PBS, lysed in RIPA buffer supplemented with pro-tease inhibitors and spun down. Protein concentration was measured using a BCA protein assay kit (Pierce) and LDS sample buffer (NuPAGE, Invitrogen) was added to the lysate or directly to the medium. Equal amounts were loaded on SDS-PAGE pre-cast gradient gels (4–12% Nu-Page Bis-Tris, Invitrogen) followed by transfer to nitrocellulose membrane. Non-specific protein binding was blocked by 5% skimmed milk in TBST; primary antibodies were incubated overnight at 4
˚
C in TBST with 2% skimmed milk. Secondary antibodies conjugated to horseradish peroxidase (DAKO, Glostrup, Denmark) were incubated for 1 hr at room temperature; proteins were detected using ECL Western blot reagent.Triton X-114 phase separation
HEK293 cells transiently transfected with GDE2, GDE3 or empty plasmid, were plated on PEI-coated 6-well plates. After 24 hr complete medium was replaced with 1 ml serum free medium, 24 hr there-after the conditioned medium was collected. 2% pre-condensed Triton X-114 was added to ice-cold conditioned medium and phases were separated as previously described (Doering et al., 2001). The top aqueous phase and the bottom detergent phase were analyzed by SDS-PAGE and Western blotting.
Microscopy
Cells cultured on 24 mm, #1,5 coverslips were washed and fixed with 4% PFA, permeabilized with 0.1% Triton X-100 and blocked with 2% BSA for 1 hr. Incubation with primary antibodies was done for 1 hr followed by incubation with Alexa-conjugated antibodies or Phalloidin for 45 min at room temperature. For confocal microscopy, cells were washed with PBS, mounted with Immnuno-MountTM (Thermo Scientific) and visualized on a LEICA TCS-SP5 confocal microscopy (63 x objec-tive). Super-resolution imaging was done using a SR-GSD Leica microscope equipped with an oxy-gen scavenging system, as previously described (Matas-Rico et al., 2016). In short, 15000 frames were taken in TIRF mode, at 10 ms exposure time. After post image analysis, movies were analyzed and corrected using the ImageJ plugin Thunderstorm (http://imagej.nih.gov/ij/) followed by correc-tion with an ImageJ macro using the plugin Image Stabilizer. For Total Internal Refleccorrec-tion (TIRF) microscopy, HEK293 cells stably expressing UPAR-GFP and transiently transfected with GDE3-mCherry were imaged using a Leica AM TIRF MC microscope with a HCX PL APO 63x, 1.47 NA oil immersion lens. Excitation was at 488 and 561 nm and detection of fluorescence emission was by a GR filter cube (Leica). Before each experiment, automatic laser alignment was carried out and TIRF penetration depth was set to 200 nm. Data were acquired at 500 ms frame rate. Basolateral uPAR patches were visualized using confocal microscopy and the area was quantified using an ImageJ macro that measured the uPAR patches based on fluorescence intensity.
Flow cytometry
HEK293 cells stably expressing uPAR-GFP were left untreated, treated with PI-PLC or transiently transfected with GDE3-mCherry. MDA-MB-231 cells were stably transfected with GDE3-mCherry. Cells were trypsinized, blocked in 2%BSA and stained with rabbit anti-GFP primary antibody or mouse uPAR (13F6) antibody followed by AlexaFluor-647 coupled rabbit secondary anti-body. Cells were analyzed using a BD LSR Fortessa flow cytometer.
Mouse xenograft assay
considered statistically different. The mouse experiments were approved by the Animal Ethics Com-mittee of the Netherlands Cancer Institute (protocol number: 30100 2015 407 appendix 1 WP 6061).
Statistical analysis
For all single comparisons, a two-tailed unpaired Student’s t-test was used; for multiple comparisons, an ordinary ANOVA with Tukey’s test was used. APvalue < 0.05 was considered statistically signifi-cant. Error bars shown in the bar diagrams were calculated as the standard error of the mean (SEM); whiskers in the box plots depict 95% confidence intervals.
Acknowledgements
We thank the people from the Preclinical Intervention Unit of the Mouse Clinic for Cancer and Age-ing (MCCA) at the NKI for performAge-ing the animal experiments. This work was supported by the Netherlands Organisation for Scientific Research (NWO) and the Dutch Cancer Society (KWF).
Additional information
Funding
Funder Grant reference number Author
Nederlandse Organisatie voor Wetenschappelijk Onderzoek
Graduate Student Fellowship
Daniela Leyton-Puig
KWF Kankerbestrijding Graduate Student Fellowship
Katarzyna M Kedziora
The funders had no role in study design, data collection and interpretation, or the decision to submit the work for publication.
Author contributions
Michiel van Veen, Elisa Matas-Rico, Conceptualization, Data curation, Formal analysis, Validation, Investigation, Methodology; Koen van de Wetering, Daniela Leyton-Puig, Katarzyna M Kedziora, For-mal analysis, Investigation, Methodology; Valentina De Lorenzi, Yvette Stijf-Bultsma, Investigation, Methodology; Bram van den Broek, Methodology; Kees Jalink, Supervision, Investigation, Methodol-ogy; Nicolai Sidenius, Resources, Methodology, Writing—review and editing; Anastassis Perrakis, Formal analysis, Supervision, Validation, Investigation, Methodology; Wouter H Moolenaar, Concep-tualization, Data curation, Formal analysis, Supervision, Funding acquisition, Investigation, Methodol-ogy, Writing—original draft, Writing—review and editing
Author ORCIDs
Anastassis Perrakis http://orcid.org/0000-0002-1151-6227 Wouter H Moolenaar http://orcid.org/0000-0001-7545-198X
Ethics
Animal experimentation: The mouse experiments were approved by the Animal Ethics Committee of the Netherlands Cancer Institute (protocol number: 30100 2015 407 appendix 1).
Decision letter and Author response
Decision letterhttps://doi.org/10.7554/eLife.23649.015 Author responsehttps://doi.org/10.7554/eLife.23649.01
Additional files
Supplementary files.Transparent reporting form
DOI: https://doi.org/10.7554/eLife.23649.014
References
Barretina J, Caponigro G, Stransky N, Venkatesan K, Margolin AA, Kim S, Wilson CJ, Leha´r J, Kryukov GV, Sonkin D, Reddy A, Liu M, Murray L, Berger MF, Monahan JE, Morais P, Meltzer J, Korejwa A, Jane´-Valbuena J, Mapa FA, et al. 2012. The Cancer Cell Line Encyclopedia enables predictive modelling of anticancer drug sensitivity.Nature483:603–307.DOI: https://doi.org/10.1038/nature11003,PMID: 22460905
Blomen VA, Ma´jek P, Jae LT, Bigenzahn JW, Nieuwenhuis J, Staring J, Sacco R, van Diemen FR, Olk N, Stukalov A, Marceau C, Janssen H, Carette JE, Bennett KL, Colinge J, Superti-Furga G, Brummelkamp TR. 2015. Gene essentiality and synthetic lethality in haploid human cells.Science350:1092–1096.DOI: https://doi.org/10. 1126/science.aac7557,PMID: 26472760
Boonstra MC, Verspaget HW, Ganesh S, Kubben FJ, Vahrmeijer AL, van de Velde CJ, Kuppen PJ, Quax PH, Sier CF. 2011. Clinical applications of the urokinase receptor (uPAR) for cancer patients.Current Pharmaceutical
Design17:1890–1910.DOI: https://doi.org/10.2174/138161211796718233,PMID: 21711239
Brinkman EK, Chen T, Amendola M, van Steensel B. 2014. Easy quantitative assessment of genome editing by sequence trace decomposition.Nucleic Acids Research42:e168.DOI: https://doi.org/10.1093/nar/gku936, PMID: 25300484
Caiolfa VR, Zamai M, Malengo G, Andolfo A, Madsen CD, Sutin J, Digman MA, Gratton E, Blasi F, Sidenius N. 2007. Monomer dimer dynamics and distribution of GPI-anchored uPAR are determined by cell surface protein assemblies.The Journal of Cell Biology179:1067–1082.DOI: https://doi.org/10.1083/jcb.200702151,PMID: 1 8056417
Cong L, Ran FA, Cox D, Lin S, Barretto R, Habib N, Hsu PD, Wu X, Jiang W, Marraffini LA, Zhang F. 2013. Multiplex genome engineering using CRISPR/Cas systems.Science339:819–823.DOI: https://doi.org/10.1126/ science.1231143,PMID: 23287718
Corda D, Kudo T, Zizza P, Iurisci C, Kawai E, Kato N, Yanaka N, Mariggio` S. 2009. The developmentally regulated osteoblast phosphodiesterase GDE3 is glycerophosphoinositol-specific and modulates cell growth.
Journal of Biological Chemistry284:24848–24856.DOI: https://doi.org/10.1074/jbc.M109.035444,PMID: 195
96859
Corda D, Mosca MG, Ohshima N, Grauso L, Yanaka N, Mariggio` S. 2014. The emerging physiological roles of the glycerophosphodiesterase family.FEBS Journal281:998–1016.DOI: https://doi.org/10.1111/febs.12699, PMID: 24373430
Cunningham O, Andolfo A, Santovito ML, Iuzzolino L, Blasi F, Sidenius N. 2003. Dimerization controls the lipid raft partitioning of uPAR/CD87 and regulates its biological functions.The EMBO Journal22:5994–6003. DOI: https://doi.org/10.1093/emboj/cdg588,PMID: 14609946
Doering TL, Englund PT, Hart GW. 2001. Detection of glycophospholipid anchors on proteins.Current Protocols
in Protein ScienceChapter 12:Unit 12.5.DOI: https://doi.org/10.1002/0471140864.ps1205s02,PMID: 1842
9111
Ferraris GM, Schulte C, Buttiglione V, De Lorenzi V, Piontini A, Galluzzi M, Podesta` A, Madsen CD, Sidenius N. 2014. The interaction between uPAR and vitronectin triggers ligand-independent adhesion signalling by integrins.The EMBO Journal33:2458–2472.DOI: https://doi.org/10.15252/embj.201387611,PMID: 25168639 Ferraris GM, Sidenius N. 2013. Urokinase plasminogen activator receptor: a functional integrator of extracellular
proteolysis, cell adhesion, and signal transduction.Seminars in Thrombosis and Hemostasis39:347–355. DOI: https://doi.org/10.1055/s-0033-1334485,PMID: 23532573
Furlan F, Galbiati C, Jorgensen NR, Jensen JE, Mrak E, Rubinacci A, Talotta F, Verde P, Blasi F. 2007. Urokinase plasminogen activator receptor affects bone homeostasis by regulating osteoblast and osteoclast function.
Journal of Bone and Mineral Research22:1387–1396.DOI: https://doi.org/10.1359/jbmr.070516,PMID: 1753
9736
Haupt TH, Petersen J, Ellekilde G, Klausen HH, Thorball CW, Eugen-Olsen J, Andersen O. 2012. Plasma suPAR levels are associated with mortality, admission time, and Charlson Comorbidity Index in the acutely admitted medical patient: a prospective observational study.Critical Care16:R130.DOI: https://doi.org/10.1186/ cc11434,PMID: 22824423
Hayek SS, Quyyumi AA, Reiser J. 2016. Soluble Urokinase Receptor and Chronic Kidney Disease.The New
England Journal of Medicine374:891.DOI: https://doi.org/10.1056/NEJMc1515787,PMID: 26962914
Høyer-Hansen G, Rønne E, Solberg H, Behrendt N, Ploug M, Lund LR, Ellis V, Danø K. 1992. Urokinase plasminogen activator cleaves its cell surface receptor releasing the ligand-binding domain.The Journal of
Biological Chemistry267:18224–18229.PMID: 1381366
Kinoshita T, Fujita M. 2016. Biosynthesis of GPI-anchored proteins: special emphasis on GPI lipid remodeling.
Journal of Lipid Research57:6–24.DOI: https://doi.org/10.1194/jlr.R063313,PMID: 26563290
Kjøller L, Hall A. 2001. Rac mediates cytoskeletal rearrangements and increased cell motility induced by urokinase-type plasminogen activator receptor binding to vitronectin.The Journal of Cell Biology152:1145– 1158.DOI: https://doi.org/10.1083/jcb.152.6.1145,PMID: 11257116
LeBeau AM, Duriseti S, Murphy ST, Pepin F, Hann B, Gray JW, VanBrocklin HF, Craik CS. 2013. Targeting uPAR with antagonistic recombinant human antibodies in aggressive breast cancer.Cancer Research73:2070–2081. DOI: https://doi.org/10.1158/0008-5472.CAN-12-3526,PMID: 23400595
Maeda Y, Kinoshita T. 2011. Structural remodeling, trafficking and functions of glycosylphosphatidylinositol-anchored proteins.Progress in Lipid Research50:411–424.DOI: https://doi.org/10.1016/j.plipres.2011.05.002, PMID: 21658410
Mann KJ, Hepworth MR, Raikwar NS, Deeg MA, Sevlever D. 2004. Effect of glycosylphosphatidylinositol (GPI)-phospholipase D overexpression on GPI metabolism.Biochemical Journal378:641–648.DOI: https://doi.org/ 10.1042/bj20031326,PMID: 14611645
Matas-Rico E, van Veen M, Leyton-Puig D, van den Berg J, Koster J, Kedziora KM, Molenaar B, Weerts MJ, de Rink I, Medema RH, Giepmans BN, Perrakis A, Jalink K, Versteeg R, Moolenaar WH. 2016.
Glycerophosphodiesterase GDE2 Promotes Neuroblastoma Differentiation through Glypican Release and Is a Marker of Clinical Outcome.Cancer Cell30:548–562.DOI: https://doi.org/10.1016/j.ccell.2016.08.016, PMID: 27693046
Matas-Rico E, van Veen M, Moolenaar WH. 2017. Neuronal differentiation through GPI-anchor cleavage.Cell
Cycle16:388–389.DOI: https://doi.org/10.1080/15384101.2016.1259894,PMID: 27860541
Mehlert A, Ferguson MAJ. 2009. Proteomic scale high-sensitivity analyses of GPI membrane anchors.
Glycoconjugate Journal26:915–921.DOI: https://doi.org/10.1007/s10719-008-9116-x
Montuori N, Ragno P. 2009. Multiple activities of a multifaceted receptor: roles of cleaved and soluble uPAR.
Frontiers in Bioscience14:2494–2503.DOI: https://doi.org/10.2741/3392,PMID: 19273214
Multhaupt HA, Mazar A, Cines DB, Warhol MJ, McCrae KR. 1994. Expression of urokinase receptors by human trophoblast. A histochemical and ultrastructural analysis.Laboratory Investigation; a Journal of Technical
Methods and Pathology71:392–400.PMID: 7933989
Munch EM, Sparks AE, Gonzalez Bosquet J, Christenson LK, Devor EJ, Van Voorhis BJ. 2016. Differentially expressed genes in preimplantation human embryos: potential candidate genes for blastocyst formation and implantation.Journal of Assisted Reproduction and Genetics33:1017–1025.DOI: https://doi.org/10.1007/ s10815-016-0745-x,PMID: 27241529
Mustjoki S, Sidenius N, Sier CF, Blasi F, Elonen E, Alitalo R, Vaheri A. 2000. Soluble urokinase receptor levels correlate with number of circulating tumor cells in acute myeloid leukemia and decrease rapidly during chemotherapy.Cancer Research60:7126–7132.PMID: 11156421
Park S, Lee C, Sabharwal P, Zhang M, Meyers CL, Sockanathan S. 2013. GDE2 promotes neurogenesis by glycosylphosphatidylinositol-anchor cleavage of RECK.Science339:324–328.DOI: https://doi.org/10.1126/ science.1231921,PMID: 23329048
Paulick MG, Bertozzi CR. 2008. The glycosylphosphatidylinositol anchor: a complex membrane-anchoring structure for proteins.Biochemistry47:6991–7000.DOI: https://doi.org/10.1021/bi8006324,PMID: 18557633 Pedersen N, Schmitt M, Rønne E, Nicoletti MI, Høyer-Hansen G, Conese M, Giavazzi R, Dano K, Kuhn W, Ja¨nicke
F. 1993. A ligand-free, soluble urokinase receptor is present in the ascitic fluid from patients with ovarian cancer.Journal of Clinical Investigation92:2160–2167.DOI: https://doi.org/10.1172/JCI116817,PMID: 8227331
Persson M, Skovgaard D, Brandt-Larsen M, Christensen C, Madsen J, Nielsen CH, Thurison T, Klausen TL, Holm S, Loft A, Berthelsen AK, Ploug M, Pappot H, Brasso K, Kroman N, Højgaard L, Kjaer A. 2015. First-in-human uPAR PET: Imaging of Cancer Aggressiveness.Theranostics5:1303–1316.DOI: https://doi.org/10.7150/thno. 12956,PMID: 26516369
Pierleoni C, Samuelsen GB, Graem N, Rønne E, Nielsen BS, Kaufmann P, Castellucci M. 1998.
Immunohistochemical identification of the receptor for urokinase plasminogen activator associated with fibrin deposition in normal and ectopic human placenta.Placenta19:501–508.DOI: https://doi.org/10.1016/S0143-4004(98)91043-8,PMID: 9778123
Ploug M, Eriksen J, Plesner T, Hansen NE, Danø K. 1992. A soluble form of the glycolipid-anchored receptor for urokinase-type plasminogen activator is secreted from peripheral blood leukocytes from patients with
paroxysmal nocturnal hemoglobinuria.European Journal of Biochemistry208:397–404.DOI: https://doi.org/10. 1111/j.1432-1033.1992.tb17200.x,PMID: 1325906
Scallon BJ, Fung WJ, Tsang TC, Li S, Kado-Fong H, Huang KS, Kochan JP. 1991. Primary structure and functional activity of a phosphatidylinositol-glycan-specific phospholipase D.Science252:446–448.DOI: https://doi.org/ 10.1126/science.2017684,PMID: 2017684
Shariat SF, Roehrborn CG, McConnell JD, Park S, Alam N, Wheeler TM, Slawin KM. 2007. Association of the circulating levels of the urokinase system of plasminogen activation with the presence of prostate cancer and invasion, progression, and metastasis.Journal of Clinical Oncology25:349–355.DOI: https://doi.org/10.1200/ JCO.2006.05.6853,PMID: 17264329
Sidenius N, Sier CF, Ullum H, Pedersen BK, Lepri AC, Blasi F, Eugen-Olsen J. 2000. Serum level of soluble urokinase-type plasminogen activator receptor is a strong and independent predictor of survival in human immunodeficiency virus infection.Blood96:4091–4095.PMID: 11110678
Smith HW, Marshall CJ. 2010. Regulation of cell signalling by uPAR.Nature Reviews Molecular Cell Biology11: 23–36.DOI: https://doi.org/10.1038/nrm2821,PMID: 20027185
Stephens RW, Nielsen HJ, Christensen IJ, Thorlacius-Ussing O, Sørensen S, Danø K, Bru¨nner N. 1999. Plasma urokinase receptor levels in patients with colorectal cancer: relationship to prognosis.Journal of the National
Cancer Institute91:869–874.DOI: https://doi.org/10.1093/jnci/91.10.869,PMID: 10340907
Yang J, Yan R, Roy A, Xu D, Poisson J, Zhang Y. 2015. The I-TASSER Suite: protein structure and function prediction.Nature Methods12:7–8.DOI: https://doi.org/10.1038/nmeth.3213,PMID: 25549265