Protein Behavior in Crowded Environments
Lisa M. Charlton
A dissertation submitted to the faculty of the University of North Carolina at Chapel Hill in partial fulfillment of the requirements for the degree of Doctorate of Philosophy in the Department of Chemistry.
Chapel Hill 2008
Approved by
Advisor: Professor Gary J. Pielak, Ph.D.
Reader: Professor Linda L. Spremulli, Ph.D.
Reader: Professor Matthew R. Redinbo, Ph.D.
Abstract
Lisa M. Charlton: Protein behavior in crowded environments (Under the direction of Professor Gary J. Pielak, Ph.D.)
The cell’s interior is a complex milieu where proteins exist in an environment crowded with other macromolecules. The influence of macromolecular crowding is prevalent in every cellular function—from metabolism to signal transduction to protein folding. It is even hypothesized that macromolecular crowding dictates the organization of the intracellular environment and the evolution of a single-cell
species. Even though proteins are prevalent in every biochemical process, we lack fundamental knowledge about how crowding affects proteins. When studying
proteins in a crowded environment, one can either develop a system that mimics the cellular interior or develop a technique that observes proteins inside cells. Herein, I report a residue-level interrogation on the stability of chymotrypsin inhibitor 2 under macromolecular crowded conditions. This is the first study that offers
comprehensive information about the effects of crowding on the stability of the native state of a globular protein. I also present observations about the behavior of
Dedication
Acknowledgements
Graduate school is not a road that is taken alone. I would like to thank those who have helped and supported me over the years. To Gary Pielak, my advisor and an excellent scientist, thank you for all the opportunities and for training me to think like a scientist. To my committee members, Drs. Matt Redinbo, Linda Spremulli, Susan Lord, and Ashutosh Tripathy, thank you for your advice and time. To past and present Pielak lab members, you have made this time both memorable and
Table of Contents
Dedication...iv
Acknowledgements... v
Table of Contents...vi
List of Illustrations ... x
List of Abbreviations and Symbols ... xiii
1 Introduction ... 1
1.1 Macromolecular crowding and the cell... 1
1.2 In-cell NMR ... 4
2 Measuring the stability of chymotrypsin inhibitor 2 under macromolecular crowded conditions ... 8
2.1 Introduction ... 8
2.1.1 Implications of a crowded environment ... 8
2.1.2 Chymotrypsin inhibitor 2 ... 9
2.2 Materials and Methods... 10
2.2.1 Purification of chymotrypsin inhibitor 2 ... 10
2.2.2 Sample preparation for nonexchange experiments ... 12
2.2.3 NMR conditions for nonexchange experiments ... 12
2.2.4 NMR ... 13
2.2.5 Data analysis ... 13
2.2.7 GdmCl equilibrium denaturation ... 15
2.2.8 Measuring the diffusion coefficient ... 16
2.3 Results and Discussion... 17
2.4 Conclusions ... 23
2.5 Figures... 24
3 Caveats of in-cell NMR in Escherichia coli... 38
3.1 Introduction to in-cell NMR of globular, partially folded, and natively disordered proteins ... 38
3.2 Materials and Methods... 40
3.2.1 In-cell NMR preparation of chymotrypsin inhibitor 2 (CI2) and apocytochrome b5... 40
3.2.2 In-cell NMR preparation of α-synuclein and FlgM ... 41
3.2.3 NMR analysis of extracellular protein ... 41
3.2.4 Post-spectrometer SDS-PAGE analysis... 42
3.2.5 Encapsulating E. coli cells ... 43
3.2.6 NMR experiments of encapsulated cells ... 44
3.3 Results... 45
3.3.1 In-cell NMR of chymotrypsin inhibitor 2 ... 45
3.3.2 In-cell NMR and α-synuclein ... 46
3.3.3 In-cell NMR and FlgM... 47
3.3.4 In-cell NMR and apocytochrome b5... 47
3.3.5 In-cell NMR of encapsulated cells ... 48
3.4 Conclusions ... 48
4 In-cell NMR of Pichia pastoris... 60
4.1 Introduction... 60
4.1.1 Pichia pastoris... 60
4.1.1 Why yeast?... 62
4.2 Materials and Methods... 63
4.2.1 Ligation... 63
4.2.2 Preparation of DNA for transformation into P. pastoris... 64
4.2.3 Spheroplasting... 65
4.2.4 Transformation of P. pastoris... 66
4.2.5 Test expression of recombinant proteins... 67
4.3 Results... 70
4.3.1 Expression and in-cell NMR of chymotrypsin inhibitor 2... 70
4.3.2 Expression and in-cell NMR of α-synuclein ... 71
4.3.3 Expression of FlgM... 71
4.4 Conclusions ... 72
4.5 Figures... 74
List of Tables
Table 2-1. 1H, 15N assignments and kex for the I29A:I37H variant of chymotrypsin
List of Illustrations
Figure 2.1. Plots of chemical shift disturbances in 300 g/L PVP and 100 g/L NEP.. 24 Figure 2.2. Plots of absorbance at 280 nm and linewidth changes in 300 g/L PVP . 25 Figure 2.3. Molecular diffusion of the I29A:I37H variant in dilute solution and in 300
g/L PVP40, 50 mM acetate buffer, pH 5.4, 37 oC. ... 26 Figure 2.4. Exchange curves for Leu 32 (●) and Asp 52 (▼) in dilute solution (blue)
and 300 g/L PVP (green)... 27 Figure 2.5. GdmCl denaturation curves of the I29A:I37H variant at 37 oC for three
trials measured by circular dichroism at 234 nm. ... 28 Figure 2.6. Plot of log kobs (pH 5.4) vs. log kobs (pH 6.2) to determine EX2
mechanism. ... 29 Figure 2.7. Exchange of Residue 37 using CLEANEX-PM ... 30 Figure 2.8. Histogram of for chymotrypsin inhibitor 2 in 300 g/L PVP and dilute
solution. ... 31 Figure 2.9. Ribbon structure of wild-type chymotrypsin inhibitor 2 (PDB, 2CI2)
colored by ∆ °'
op
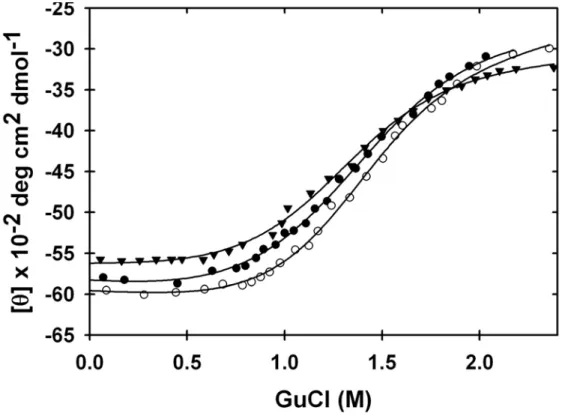
G . ... 32 Figure 2.10. GdmCl denaturation of the I29A:I37H variant at 37 oC in 300 g/L PVP
for three trials measured by circular dichroism at 242 nm. ... 33 Figure 2.11. Standard curve relating refractive index to [GdmCl] in 300 g/L PVP.... 34 Figure 3.1. Schematic of encapsulation device... 50 Figure 3.2. Spectra of chymotrypsin inhibitor 2 from in-cell NMR experiment... 51 Figure 3.3. Commassie-stained, SDS-PAGE of chymotrypsin inhibitor 2 from the
cytoplasm and the supernatant of an in-cell NMR experiment. ... 52 Figure 3.4. Spectra of α-synuclein from an in-cell NMR experiment... 53 Figure 3.5. Commassie-stained, SDS-PAGE of α-synuclein recovered from the
Figure 3.6. Spectra of FlgM from an in-cell NMR experiment ... 55 Figure 3.7. Spectra of apocytochrome b5 from an in-cell NMR experiment ... 56
Figure 3.8. Commassie-stained, SDS-PAGE of apocytochrome b5 recovered from
the cytoplasm and supernatant of an in-cell experiment... 57 Figure 3.9. Spectra from α-synuclein and chymotrypsin inhibitor 2 inside cells,
supernatant, and encapsulated cells. ... 58 Figure 3.10. 1D 15N -filtered spectrum of chymotrypsin inhibitor 2 after dissolving
alginate encapsulate... 59 Figure 4.1. General diagram of P. pastoris vector ... 74 Figure 4.2. Yeast plasmid map used in present studies... 75 Figure 4.3. Single crossover during a homologous recombination event with HIS4
selectable marker ... 76 Figure 4.4. Double crossover event during homologous recombination ... 77 Figure 4.5. Coomassie-stained gel of test expression for CI2 in P. pastoris... 78 Figure 4.6. Coomassie-stained SDS gel of CI2 test expression in P. pastoris in
Yeastone media ... 79 Figure 4.7. NMR spectrum P. pastoris cells expressing chymotrypsin inhibitor 2 .... 80 Figure 4.8. Coomassie-stained SDS gel of chymotrypsin inhibitor 2 after in-cell NMR
experiment... 81 Figure 4.9. Coomassie-stained SDS gel for test expression of α-synculein in P.
pastoris in BMMY media... 82
Figure 4.10. Representative Western blot analysis for presence of α-synuclein from screening colonies grown on MM agar plates. ... 83 Figure 4.11. Western blot analysis of α-synuclein test expression in BMMY and
Yeastone medias... 84 Figure 4.12. Coomassie-stained SDS gel of α-synuclein insoluble material from test
Figure 4.13. Representative gel of Western blot analysis of insoluble α-synuclein from test expression in BMMY and Yeastone... 86 Figure 4.14. NMR spectrum of in-cell experiment for α-synuclein ... 87 Figure 4.15. Western blot of α-synuclein samples after an in-cell NMR experiment
with P. pastoris. ... 88 Figure 4.16. Coomassie-stained SDS gel of His-FlgM test expression in P. pastoris
in BMMY media. ... 89 Figure 4.17. Coomassie-stained SDS-PAGE analysis for presence of His-FlgM after
screening colonies grown on MM agar plates. ... 90 Figure 4.18. Coomassie-stained SDS gel of His-FlgM from test expression of P.
pastoris in BMMY and Yeastone media... 91
Figure 4.19. Coomassie-stained SDS-PAGE analysis for screening the presence of His-FlgM, α-synuclein, or chymotrypsin inhibitor 2 in P. pastoris
List of Abbreviations and Symbols
1D one-dimensional 2D two-dimensional 3D three-dimensional 1/Kop equilibrium constant for closing
AOX1 primary promoter for alcohol oxidase amp ampicillin
BMGY buffered complex minimal glycerol media BMMY buffered complex minimal methanol media
CaS 1 M sorbitol, 10 mM Tris-HCl, pH 7.5, 10 mM CaCl2
CD circular dichroism
CI2 chymotrypsin inhibitor 2
CIP calf intestinal phosphatase
cm centimeter Da Dalton DTT dithiothreitol EDTA ethylenediaminetetraacetic acid
EtBr ethidium bromide
g standard gravity
GdmCl guanidinium hydrochloride
h hour His histidine
HSQC heteronuclear single quantum correlation Hz hertz
IPTG isopropyl β-D-1-thiogalactopyranoside kan kanamycin kcal kilocalorie kex intrinsic 1st order rate constant
kobs observed 1st order rate constant
Kop equilibrium constant for opening
kb kilobase kDa kilodalton kV kilovolt
LB Luria broth
MD minimal dextrose media
MHz megahertz min minute mg milligram mL milliliter mm millimeter
MM minimal methanol media
Mut+ methanol utilization fast
MutS methanol utilization slow
nm nanometer
NEP N-ethyl pyrrolidone
OD optical density
PAGE polyacrylamide gel electrophoresis
PCR polymerase chain reaction
pDNA plasmid DNA
PEG polyethylene glycol
PEG/CaT 40% PEG 3350 (w/v); 20 mM Tris-HCl, pH 7.5, 20 mM CaCl2
PMSF phenylmethylsulphonyl fluoride
PVP poly(vinyl pyrrolidone)
R gas constant
RD regeneration dextrose
rpm revolutions per minute
R-T room temperature
SCE 1M sorbitol, 1 mM EDTA, 10 mM sodium citrate, pH 5.8 sec seconds
SDS sodium dodecyl sulfate
SED 1M sorbitol, 25 mM EDTA, 1M DTT, pH 8.0
STAM2 signal transducing adaptor molecule T temperature TE Tris-EDTA
Tris trishydroxymethylaminomethane
v/v volume/volume w/v weight/volume
YFG your favorite gene
YNB yeast nitrogen base
YPD yeast extract, peptone, dextrose
Greek Based Symbols
α-SN alpha-synuclein
∆Gden free energy of denaturation
∆Gop free energy of opening
1 Introduction
1.1 Macromolecular crowding and the cell
As early as the late 1950s, science was interested in studying proteins and polysaccharides in concentrated systems (1). At that time, a highly characterized polysaccharide, hyaluronan, was shown to have an unexpected concentration dependent sedimentation rate. At infinite dilution the sedimentation coefficient depended on the molecular weight, but at higher concentrations, there was no molecular weight dependence. This behavior was also observed for other polymers (1). It was determined that hyaluronan formed a 3-dimensional, randomly-distributed chain network at high concentrations (>100 mg/ml) but behaved as a
non-interacting, expanded, random coil in dilute solution (1).
The ability of hyaluronan to form a mesh-like network at high concentrations prompted further studies. Ogston and Phelps, in 1960, made equilibrium
measurements of the partitioning of proteins between hyaluronan solution and buffer and observed that proteins favored the buffer. From this observation, they concluded that hyaluronan excluded proteins and solutes from part of the space, and this
(1, 3, 4). These results were some of the earliest demonstrations of excluded volume theory.
Excluded volume theory states that two molecules cannot occupy the same space at the same time. Therefore, the presence of cosolutes, particularly in high concentrations, excludes volume to another solute molecule. In general, a cell’s interior is 20-30% volume-occupied, thus, having 20-30% of its volume excluded to other molecules. These macromolecules have partial specific volumes close to 1 ml mg-1, resulting in a crowded interior with macromolecules achieving concentrations of 200-300 mg/ml (5). The steric exclusion that results from macromolecular crowding has considerable consequences for a cell’s function.
The high protein concentration in the cellular environment affects diffusion of both small and large molecules; however, the cell has evolved to overcome these diffusive barriers. With respect to metabolism, enzymes organize to form static, multi-enzyme complexes of related enzymes that co-localize with the respective small molecules (6). The formation of such complexes promotes metabolite
conclusions, one may argue that macromolecular crowding promotes metabolite channeling, which is considered to be an important evolutionary driving force behind cellular function (11).
The mechanism by which macromolecules form discrete compartments in the nucleus can also be explained by macromolecular crowding. The concentration of macromolecules in the nucleus approximates 100 mg/mL (12). Within this
environment, non-membrane bound, nuclear compartments, such as the nucleoli, form from the compartmentalization of their macromolecular components.
Macromolecular crowding plays an essential role in the assembly and function of this compartment. For instance, nucleoli disassembled and nucleolar transcription decreased by 85% when nuclei isolated from human erythroleukemia (K562) cells were expanded in medium of low cation concentration. The macromolecular concentration decreased by approximately 2-fold upon nuclear expansion. After addition of inert, penetrating macromolecules (8 kDa polyethylene glycol or 10.5 kDa dextran) to a homeostatic concentration, the nucleoli reassembled and nucleolar transcription resumed (12). DNA replication in the nucleus also depends on a crowded environment. A nucleus must form for DNA replication to initiate and progress (13) and has been demonstrated in vitro that crowding is critical to assembly of replication machinery (14).
The influence of macromolecular crowding is prevalent in every cellular function—from metabolism to signal transduction to protein folding. It is even hypothesized that macromolecular crowding dictates the organization of the
studies mimicked the cellular environment by crowding with inert macromolecules. These experiments are inherently flawed because the concentration of
macromolecules inside cells is neither homogenous nor inert. Experiments evolved to look at small molecules inside living cells, providing extraordinary detail on the function of the metabolome (15). Now, the interest lies in monitoring the behavior of macromolecules inside living cells. This can be accomplished using a novel
technique, in-cell NMR.
1.2 In-cell NMR
In-cell protein NMR is the first technique to give atomic-level resolution inside living cells. An in-cell NMR spectrum can be collected on a 15N,13C, or 19F-enriched, overexpressed, soluble protein within the cell’s interior (16). The first in-cell
experiment on a protein was from the Brindle lab in 1997 (17). These investigations quantified the rotational mobility of three glycolytic enzymes in Saccharomyces cerevisiae by observing an unnaturally incorporated 5-fluorotryptophan. Four years
The Pielak lab published the first paper using in-cell NMR to investigate a natively-disordered protein, FlgM (19). A 15N HSQC spectrum was collected for FlgM inside living E. coli, and crosspeaks belonging to the C-terminal residues disappeared, whereas those belonging to the N-terminal residues remained. The data suggest that the C-terminal portion becomes structured inside cells. Exchange is occurring between a structured and unstructured C-terminal which leads to line-broadening and disappearance of crosspeaks. The Pielak lab then went on to study another natively-disordered protein, α-synuclein (α-SN) (20). McNulty et al.
determined that the E. coli periplasm prevented a temperature induced
conformational change that occurs at 35 oC in dilute solution (20). The crowded periplasm stabilized the disordered α-SN monomer. These two studies emphasized the need to examine proteins in their natural environment, particularly since many disordered proteins are involved in neurodegenerative diseases.
Hubbard et al. reported the first in-cell NMR results relating the structure of a regulatory protein to its interaction with a potential drug (21). The regulatory protein, CheY, is involved in chemotaxis in bacteria and binds both Mg2+ and Ca2+. By comparing chemical shifts between spectra acquired in dilute solution and inside cells, Hubbard and colleagues concluded that CheY exists predominantly in the Mg2+-bound conformation inside cells. They identified the residues that interact with the potential drug inside cells by observing chemical shift changes.
The Shekhtman group provided the first glimpse of protein-protein interactions from studies of ubiquitin and signal transducing adaptor molecule
the binding interface between STAM2 and ubiquitin, and the authors hypothesized an increase in binding affinity supported by the appearance of an additional binding interface inside cells. Shekhtman and colleagues observed chemical shift changes, line-broadening, and crosspeaks disappearing in regions of binding inside cells when compared to data obtained in dilute solution.
The Dötsch lab was the first to move away from detecting 15N nuclei to
observing 13C inside E. coli (23, 24). Their 2003 paper incorporated 15N/13C enriched histidine in the protein NmerA to measure the intracellular pH and the tautomeric state of the histidine by observing the chemical shift of histidine 13Cε1 or
13Cδ2 resonances (24). Their second paper in this area described a method for the
selective observation of 13C-enriched methyl groups of methionine and alanine residues in proteins (23). This method not only increases the sensitivity 3-fold compared to the observation of amide proton resonances but also provides an attractive alternative to monitoring large proteins and complexes intracellularly.
Over the span of one decade, in-cell NMR has been used to observe structural changes in individual proteins, ligand interactions, and protein-protein interactions inside living E. coli. The next frontier is to develop in-cell NMR for proteins in eukaryotic cells.
microinjected the purified, recombinant, 15N-enriched GB1 domain protein from E.
coli into the cytoplasm of frog oocytes. Microinjecting proteins into the cellular
environment prevents nonspecific incorporation of NMR-active nuclei into
background metabolites. This elimination of background signal permits collection of high resolution NMR data at low intracellular protein concentrations (~10 µM) (26). The limitations of using this technique are then only size and solubility of the protein.
Few groups have attempted to use in-cell NMR to monitor basic biophysical characteristics of a protein such as stability, dynamics, and diffusion. I focused on protein stability. There were two questions I attempted to answer with my research. Does the intracellular environment of E. coli stabilize the protein chymotrypsin
inhibitor 2 as predicted by others? And does this stability correlate with the stability measured in the presence of macromolecular crowding agents? Chapter 2 presents the results of measuring the stability of variant chymotrypsin inhibitor 2 in 300 g/L polyvinyl pyrrolidone (PVP) using NMR-detected amide proton exchange. Chapter 3 addresses several problems we encountered with in-cell NMR as well as the
2 Measuring the stability of chymotrypsin inhibitor 2
under macromolecular crowded conditions
2.1 Introduction
2.1.1 Implications of a crowded environment
Macromolecular crowding is predicted to stabilize proteins (27). Even though proteins participate in every biochemical process and are used as therapeutics, we lack fundamental knowledge about crowding and protein stability. The consequences of macromolecular crowding are expected to be profound (27), yet, surprisingly, most biophysical studies are conducted only in dilute solution. Quantitative information about the effects of crowding on globular proteins would not only provide new insights into intracellular constraints on protein stability, but also help find formulations that increase the stability and facilitate the long-term storage of protein pharmaceuticals.
shows crowding can promote stabilization. These data, however, were acquired under extreme conditions, did not involve the native state of the protein, and focused on bulk rather than residue-specific measurements.
Other studies of protein stability in the presence of macromolecules have reported minimal increases in stability (31-34). These reports may underestimate the increase in stability because such systems often ignore aggregation and do not focus on stable native states (29, 35). We have developed a simple system that provides information about the effects of macromolecular crowding on protein stability. Our system gives unambiguous data about the effects of a polymeric crowding agent on the stability of each residue in a globular protein. This quantitative information offers new insights into macromolecular stabilization of proteins.
2.1.2 Chymotrypsin inhibitor 2
We chose chymotrypsin inhibitor 2 (CI2) as our model globular protein because this protease inhibitor is small (7.5 kDa), amenable to biophysical study, and well-studied in terms of its structure, folding, and stability (36-38). More specifically, we used the I29A:I37H variant because the destabilizing isoleucine-to-alanine change (39) allows stability measurements to be completed in 24 h, and the histidine side chain provides an internal pH probe. We chose 40 kDa
polyvinyl(pyrrolidone) (PVP40) as the macromolecular crowding agent because this random-coil polymer is extremely soluble, has protein-like solution properties, and is metabolically inert (40, 41). PVP has been widely used in pharmaceutical
degradation (44-46), but it’s usefulness as a stabilizing agent for small proteins has never been investigated.
2.2 Materials and Methods
2.2.1 Purification of chymotrypsin inhibitor 2
The pet28a plasmid (Novagen) containing the gene for truncated wildtype CI2 was a gift from Dr. Andrew Lee (UNC). The first 19 residues of full length CI2 are disordered and are not included in this construct. Residue 20 of full-length CI2 is referred to here as residue 1. Site-directed mutagenesis was used to incorporate the I29A and I37H mutations (Stratagene kit). The forward primer for I29A was 5’GAA GCG CAG GCA ATC GTG C 3’, where the changed codon is bolded. The forward primer for I37H was 5’ CT GCC GGT GGG CAC CCA TGT GAC CAT GGA ATA TC 3’. The mutated plasmid was transformed into DH5α E. coli cells. DNA sequence analysis (Genome Analysis Facility, UNC) with the T7 forward sequencing primer was used to confirm the sequence.
After sequence analysis, the plasmid was transformed into BL-21(DE3-Gold) competent Escherichia coli cells (Stratagene). The transformants were spread onto Luria broth agar plates containing 60 µg/mL kanamycin (LBkan). Twenty-five mL of 15N-enriched Spectra 9 media (Spectra Stable Isotopes) were inoculated with a
single colony and incubated overnight at 37 oC with shaking at 200 rpm. This
absorbance at 600 nmof 1.0. The cells were induced with isopropyl β -D-1-thiogalactopyranoside (Sigma) at a final concentration of 1 mM. The cells were harvested after 5 h by centrifugation at 7300 x g in a swinging bucket centrifuge for 20 min.
The cell pellet was resuspended in 25 mL of 50-mM Tris buffer, pH 8.0. The slurry was sonicated (Fisher Scientific, Sonic Dismembrator Model 500) on ice (4 cycles, 4 min each, 30% duty cycle). The lysate was centrifuged at 20,000 x g for 30 min. The pellet was discarded, and the supernatant treated with a 10% solution of polyethyleneimine (final concentration 0.2%). After incubation on ice with stirring for 30 min, the precipitated nucleic acids were removed by centrifugation at 20,000 x g for 30 min.
The clear lysate was loaded onto an anion-exchange column (Q Sepharose® high performance resin, GE Healthcare, 1.6 cm x 10 cm) connected to an AKTA FPLC (GE Healthcare) at 4 oC. The column was equilibrated with 25-mM Tris buffer, pH 8.0, before loading the sample. After loading, the column was thoroughly
washed with 100 mL of 25-mM Tris, pH 8.0. CI2 does not interact strongly with the column material and was found in the flow-through and wash. Purity was assessed by using SDS-PAGE on an 18% gel with Coomassie staining. If needed, the protein was further purified in H2O by size-exclusion chromatography (HiLoad 16/60
Superdex 75 column, 1.6 cm x 60 cm, GE Healthcare) at 4 oC. The protein eluted between 80 and 100 mL. Protein concentration was determined by using the absorbance at 280 nm and an extinction coefficient of 7.04 x 10³ M-1cm-1 (47).
structural changes by comparing chemical shifts with nonlyophilized protein. No significant change was observed. Typical yield of pure protein is 100 mg per 1 L culture.
2.2.2 Sample preparation for nonexchange experiments
Lyophilized protein was resuspended in 1 mL of 50-mM sodium acetate buffer (90% H2O/ 10% D2O, v/v), pH 5.4, containing 50, 100, 200, or 300-g/L 40 kDa
poly(vinylpyrrolidone) (PVP40, Fisher). The final protein concentration was 800 µM. Consecutive, 1 h 15N HSQC spectra were collected at 37 oC. The data were
analyzed for changes in peak volumes, line-widths, and chemical shifts.
2.2.3 NMR conditions for nonexchange experiments
Two-dimensional, gradient-enhanced 15N HSQC spectra (48, 49) were
acquired in dilute solution and in 300-g/L PVP40. Lyophilized protein was dissolved in 50-mM sodium acetate buffer, pH 5.4 to a final concentration of 700 µM for dilute solution and in 50-mM sodium acetate, 300-g/L PVP40, pH 5.4 to a final
concentration of 800 µM. The data were collected on a Varian Inova 700-MHz spectrometer equipped with a coldprobe. The 1H dimension was acquired with a sweep width of 11499 Hz and consisted of 1024 complex points. The 15N dimension
1H and 15N resonance assignments were obtained from hncacb and
cbca(co)nh spectra (52, 53) on a 1-mM sample of 13C-15N enriched protein (Table 1).
2.2.4 NMR
For exchange experiments, the spectrometer was first shimmed by using a protein sample in 50-mM sodium acetate buffer, pH 5.4, at 37 oC. The exchange reaction mixture was prepared by dissolving lyophilized protein in 1 mL of 50-mM sodium acetate buffer, pH 5.4, to a final concentration of 700 µM, followed by
centrifugation and transfer of the supernatant to a 5-mm NMR tube. This buffer and those described below were made with 99.9% D2O (Acros Organics). The sample
was equilibrated in the spectrometer at 37 oC for 15 min before collecting the first spectrum. Consecutive HSQC spectra were collected for 24 h. The dilute-solution samples were saved for further experiments with GdmCl-induced denaturation. For the crowding study, lyophilized protein was resuspended in 50-mM sodium acetate buffer, 300-g/L, 100-g/L, or 50-g/L PVP40, pH 5.4 to a final concentration of 800 µM. Shimming and data acquisition were performed as described above. The pH of each sample was checked before and after data collection using a Fisher brand pH meter and electrode. The reported pH value for deuterated solutions is uncorrected for the isotope effect. Peak volumes were obtained by using NMRview (51).
2.2.5 Data analysis
I = Aexp(-kobst) + C,
where I represents the normalized peak volume, t is time in min, A is the amplitude of the exchange curve, kobs is the observed exchange rate determined from the
decrease in signal versus time, and C is the constant taking into account the residual water. Due to crosspeak overlap, residues 47/27, 8/11, 55/56 were fit a
five-parameter exponential decay
I = Aexp(-kobst) + B(-kobs2t) + C
The intrinsic rate constants for exchange, kex, were determined for each residue at
the designated pH and temperature using the program Sphere (54).
2.2.6 Measuring kex using CLEANEX-PM
The intrinsic rate of exchange (kex) for amide protons in the unprotected loop
of the I29A:I37H variant was measured by using the water saturation transfer experiment, CLEANEX-PM (55). Samples were prepared to a final concentration of 800-µM protein in 50-mM sodium acetate buffer, pH 5.4 alone or in the presence of 300-g/L PVP40, or 100-g/L N-ethylpyrrolidone (NEP). The pH of each sample was determined before and after data collection using a pH meter. The data were
2.2.7 GdmCl equilibrium denaturation
Denaturation of the I29A:I37H variant of CI2 was measured by using circular dichroism (CD) spectrapolarimetry (Aviv Model 62DS) at 37 oC and 234 nm. The NMR samples were diluted to 20 µM with 50-mM sodium acetate buffer made with D2O, pH5.4. One mL of the sample was transferred to a 1-cm pathlength quartz
cuvette. A solution of 20 µM protein in ~7 M GdmCl, 50-mM sodium acetate in D2O
was automatically titrated into the sample. The refractive index was measured at the end of each trial with a Palm Abbe refractometer (Misco). The GdmCl concentration was determined by using the equation:(56)
[GdmCl] = [(n-1.3344)/0.0161] mol/L, where n is the refractive index.
The CD signal was plotted versus GdmCl concentration and fitted to the following equation by using SigmaPlot (Systat Software):
T * R / ) C ] GdmCl ([ * m T * R / ) C ] GdmCl ([ * m d d n n m m
e
1
e
)
b
]
GdmCl
[
*
m
(
b
]
GdmCl
[
*
m
]
[
− − − −+
+
+
+
=
Θ
,where [Θ] is the ellipticity at a particular [GdmCl], mn and bn are the slope and
intercept of the native baseline, md and bd are the slope and intercept of the
denatured baseline, Cm is the [GdmCl] at the transition midpoint, R*T is the product
of the gas constant and absolute temperature. The free energy of denaturation
' den
G°
∆ is calculated from:
' den
G°
∆ = Cm * m,
where m is ∆ ' den
G°
2.2.8 Measuring the diffusion coefficient
NMR experiments were performed on a 600-MHz Varian Inova spectrometer equipped with a triple resonance probehead and xyz gradients at 37 °C on a 1 mM sample of CI2 in 50-mM acetate buffer pH 5.4, 10% D2O. An stimulated echo (STE)
pulse sequence (57) with an x-gradient was employed to measure the diffusion of the small molecule reference compound, the sodium salt of trimethylsilyl-1-propane-sulfonic acid (TSP). The water signal was suppressed by using a selective pulse (sel-STE). Convection was suppressed by application of an x-gradient (57). The methyl proton signal of TSP was selectively excited in the diffusion measurements. Due to the short proton T1 (~30 ms) and T2 (~6 ms) values for CI2 in PVP40 (fast
decay gave a low signal-to-noise ratio) a spin echo or stimulated echo was not suitable for assessing the diffusion of CI2 in PVP40. A long 15N T1 (~ 1.4 s) was
utilized to determine the diffusion of CI2 in PVP40 by a heteronuclear stimulated echo (X-STE) as described by Ferrage et al. (58). Several pulse sequences were used to validate these measurements. [These pulse sequences included sel-STE (57), X-STE (58) and WIF-PGSTE (59).] The measurements agreed within 5%.
Ten 1D HSQC spectra were collected as a function of gradient strength. The logarithm of the peak intensities were plotted versus gradient strength, and fitted to the following equation
)
3
/
(
G
)
I
ln(
)
I
ln(
2 2 2o
t
=
−
γ
δ
∆
−
δ
,where Io is the initial intensity, γ is the gyromagnetic constant, G and δ are the
A 50 ms delay between gradient pulses was used for TSP, and 200 ms and 800 ms were used for CI2 in buffer and PVP40, respectively. Gradient strengths ranged from 480 G/m to 5800 G/m. The integrated area between 8 and10 ppm was used to monitor the signal decay as a function of gradient strength. The intensities were normalized to the first experiment with weakest gradient strength. Data were processed and analyzed by using VNMR (Varian) and NMRpipe.(50) Origin lab software was used to fit the NMR diffusion data.
2.3 Results and Discussion
High concentrations of crowding agents might alter a globular protein’s structure and aggregation state (60), thereby confounding interpretation of their effects on stability. NMR chemical shifts are sensitive, empirical indicators of structure. We found PVP40-induced changes in 1H and 15N backbone chemical shifts only in the loop and turn regions of CI2 (Figure 2.1). Small changes in loops and turns are expected because crowding causes compaction and, unlike the protein core, loops are not by definition maximally compact (61, 62). These
chemical shift changes might also reflect weak interactions between PVP and these surface regions. We assessed the aggregation state of CI2 by quantifying the effect of PVP40 on the protein’s extinction coefficient, 1H and 15N resonance line-widths,
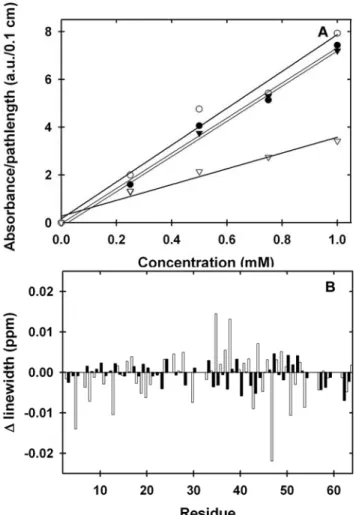
An increase in line-widths would signify an increase in the molecular weight of the protein, particularly aggregation. Small increases and decreases in line-widths were observed in dilute solution and in 300-g/L PVP40 (Figure 2.2B). Since the changes were both positive and negative, instead of solely positive, these changes are attributed to random error introduced during the experiment.
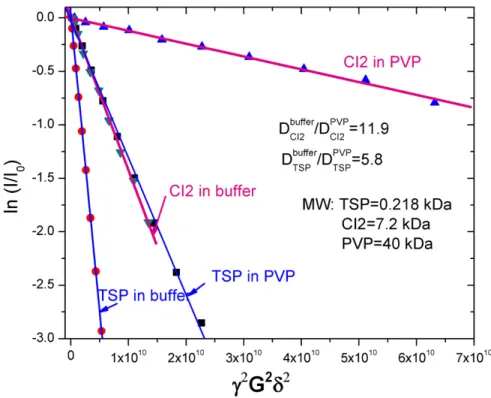
Lastly, the diffusion data are consistent with the monomeric nature of the protein in both dilute and crowded solutions. The ratio of the self-diffusion coefficient (D) of CI2 in buffer to CI2 in 300-g/L PVP is 12; whereas, the ratio of D for the small molecule standard, trimethylsilyl-1-propane-sulfonic acid sodium salt (TSP), in buffer compared to 300-g/L PVP is 6 (Figure 2.3). The ratio of these two values is the oligomeric state of CI2 in PVP, which suggests CI2 is a dimer. Diffusion
measurements are interpreted using the Stokes-Einstein equation which takes into consideration the viscosity of the solution. By comparing DTSP to DCI2, one can
eliminate the need to measure the viscosity of the solution. However, TSP was determined to be an inappropriate standard for this experiment because of the large size difference between PVP40 and the small molecule. Therefore, we can
conclude that CI2 is no more than a dimer in 300-g/L PVP as measured by the self-diffusion.
We conclude CI2 does not aggregate in the presence of 300-g/L PVP. These results indicate that the combination of PVP40 and CI2 is amenable to stability studies.
or buffer plus PVP40). The exchange rate of backbone amide protons for
deuterons, kobs, is quantified by measuring the decrease in the signal from individual
amide protons in serially-acquired NMR spectra over 24 h. The exchange reaction is described by equation 1 (63).
closed kop openstates ex exchange
cl k k ⎯→ ⎯ ⎯ ⎯ → ⎯ ⎯ ⎯ ⎯
← (1)
The native state of the protein opens and closes with rate constants kop and
kcl. Exchange occurs in the solvent-exposed open state with the rate constant kex.
The generally accepted view is that the open states are ensembles whose
subpopulations range from small, low amplitude fluctuations of the native state to rare, globally unfolded forms (64, 65).
As shown in Figure 2.4, the 300-g/L PVP40 solution exhibits considerably slower exchange compared to dilute solution. This result is consistent with
crowding-induced stabilization, but quantitative analysis of protein stability requires information about the rate constants in equation 1.
The observed first-order rate constants for exchange at individual residues, kobs, can be used to assess stability provided kop/kcl << 1 and kcl >> kex. Under these
conditions, ex ' op ex cl op
obs (k /k )k K k
k = = °
(2) where '
op
K° is the equilibrium constant for opening.(66) Stability is measured as the free energy of opening,∆ °'
op
G , where ∆G°op' =−RTlnKop°' (3)
<<1 for the slowly-exchanging protons because independent unfolding experiments give kop/kcl ~ 10-3 (Figure 2.5). To show that kcl>>kex, we measured the pH
dependence of kobs (66). If kcl>>kex is true, then kobs is dependent on kex which is
acid/base catalyzed (66). Therefore, if kcl >> kex, plotting kobs values at one pH
against values at another pH will give a line of unitary slope (36). As anticipated, plots for experiments conducted in dilute solution and in 300-g/L PVP40 at two pH values (Figure 2.6) exhibit unitary slopes. The data show that kop/kcl will equal Kop
and can be used to assess stability in dilute solution and in 300-g/L PVP40, but using equations 2 and 3 to assess the effect of crowding requires knowledge of kex in dilute
and crowded conditions.
Values of kex in dilute solution are computed from data on unstructured
peptides (54, 67, 68). To assess the effect of 300-g/L PVP40 on kex, we used
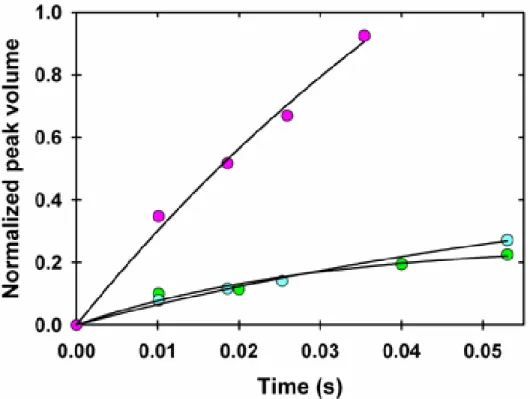
residue 37 in CI2’s unprotected, extended loop (residues 35-45) as a mimic for an unstructured peptide. Exchange in the loop occurs too quickly to use the method described above, so we turned to the saturation transfer experiment, CLEANEX-PM (55). Those data indicate that kex in 300-g/L PVP40 equals kex in dilute solution
(Figure 2.7). With these data in hand, we calculated ∆ °'
op
G values at each residue of CI2 and assessed the effects of crowding on stability.
A histogram of∆ °'
op
G values in dilute solution and 300-g/L PVP40 as a function of CI2 sequence position is shown in Figure 2.8 ,and∆ °'
op
G values are superimposed on the protein structure (PDB 2CI2) in Figures 2.9A and 2.9B. PVP40
increases∆ °'
op
(1/ ' op
K° ). This agrees with the predicted increases of 10- to 100-fold (27). We
attempted to confirm the maximum ∆ °'
op
G values by performing a circular-dichroism detected denaturation in PVP solutions supplemented with the denaturants
guanidinium chloride or urea (Figure 2.10). Unfortunately, PVP interacts strongly with the cosolutes. Such behavior has been observed previously (41).
Nevertheless, we feel our results are valid because the PVP concentration dependence of ∆ °'
op
G values extrapolates smoothly to zero PVP concentration (vide infra), and many previous studies have shown correspondence between maximum
' °
∆Gopand free energies derived from global denaturation experiments (64). To show the increases in∆ °'
op
G arise from the macromolecular nature of the crowding agent, we repeated the experiment in a solution of a model monomer for PVP, N-ethylpyrrolidone (NEP). CI2 precipitates in 300-g/L NEP, but is soluble in 100-g/L NEP. At this concentration, kex, as measured with the CLEANEX-PM
experiment, increases four-fold compared to dilute solution (Figure 2.7). We used this NEP-observed value to scale the calculated kex values. Values of∆Gop°' in
100-g/L NEP are overlaid on the protein structure in Figure 2.9D. NEP has a small effect, with most changes being destabilizing compared to dilute solution. Higher NEP concentrations are expected to be even more destabilizing. These
Measuring∆ °'
op
G on a residue-by-residue basis provides insight into the native and open states of CI2. Since the magnitude of∆ °'
op
G in dilute solution depends on the amount of surface exposed upon unfolding (70), it is expected, and observed (Figure 2.9A), that the smallest ∆ °'
op
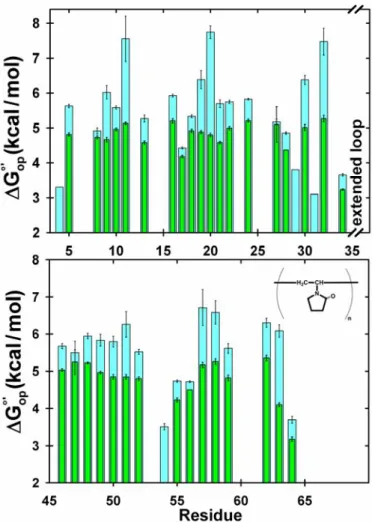
G values tend to correspond to surface-exposed residues, and the largest values correlate with residues that become exposed only upon extensive unfolding. Identical patterns of local and global unfolding are observed in PVP40 and NEP compared to dilute solution (Figures 2.9B and 2.9C). These data show that PVP40 significantly increases the stability of globally-unfolding residues compared to dilute solution and NEP while leaving the stability of locally-unfolding residues nearly unchanged. From these observations, we conclude that crowding with PVP40 does not alter the exchange-competent forms (i.e., the open states) but decreases their probability.
Theories used to explain the effects of stabilizing (or destabilizing) cosolutes on protein stability predict that '
op
G°
∆ should depend not only on differences in surface area but also on cosolute concentration (27, 70-72). We expect a positive
correlation between∆ °'
op
G values and the differential quantity, ∂∆ °'
op
G /∂[PVP], which describes the sensitivity of∆ °'
op
G to PVP40 concentration. To test this idea we examined the effect of PVP40 concentration on∆ °'
op
G and mapped values of ∂∆ °'
op
G /∂[PVP] onto the structure (Figure 2.9D). Comparing Figure 2.9B to Figure 2.9D shows exactly the correlation predicted by theory; residues with the
largest∆ °'
op
G values have the largest ∂∆ °'
op
2.4 Conclusions
We used a simple system comprising a globular protein, a random-coil polymer, and an established equilibrium thermodynamic method to quantify the stabilizing effects of macromolecular crowding at the level of individual residues. The maximum stabilizing effect is sizable, up to ~3 kcal/mol, which represents an increase in stability of ~50% compared to dilute solution. Our residue-by-residue measurements show that crowding has the largest effects on opening reactions that expose the most surface area but has little or no effect on regions that are solvent exposed in both the native and open states. This observation reinforces the
2.5 Figures
Figure 2.1. Plots of chemical shift disturbances in 300 g/L PVP and 100 g/L NEP.
Panel A: The average weighted chemical shift difference, with error bars
representing the standard deviations from three trials, for the I29A:I37H variant of CI2 in 300 g/L PVP40 under exchange conditions. Weighted chemical shift differences were calculated by using the formula [(∆1H ppm)2 + (∆15N ppm x
Figure 2.2. Plots of absorbance at 280 nm and linewidth changes in 300 g/L PVP.
Panel A: Dependence of the 280-nm absorbance on protein concentration in dilute solution, in 300 g/L PVP40, and in 400 g/L dextran at 0 and 24 h for the for the I29A:I37H variant of CI2. The extinction coefficient is 7.4 ± 0.3 mM-1cm-1for dilute
solution (▼), 7.4 ± 0.4 mM-1cm-1 for 300 g/L PVP40 at 0 h (●), 7.7 ± 0.6 mM-1cm-1 for
300 g/L PVP40 at 24 h (o), and 3.3 ± 0.3 mM-1cm-1 for 400 g/L dextran (∇). The
Figure 2.3. Molecular diffusion of the I29A:I37H variant in dilute solution and in 300 g/L PVP40, 50 mM acetate buffer, pH 5.4, 37 oC.
Using trimethylsilyl-1-propane-sulfonic acid sodium salt (TSP) as a reference small molecule, the diffusion coefficient of CI2 was 2 times greater in 300 g/L PVP40 than dilute solution suggesting dimerization. However, the measured diffusion of TSP in PVP40 results is an apparent diffusion coefficient ratio that is most likely an
Figure 2.4. Exchange curves for Leu 32 (●) and Asp 52 (▼) in dilute solution (blue) and 300 g/L PVP (green).
Figure 2.5. GdmCl denaturation curves of the I29A:I37H variant at 37 oC for three trials measured by circular dichroism at 234 nm.
The sample was 20 µM protein in 50 mM acetate buffer made with D2O. The
average m value is 1.97 ± 0.04, the average [GdmCl]50% is 2.05 ± 0.04, and the
Figure 2.6. Plot of log kobs (pH 5.4) vs. log kobs (pH 6.2) to determine EX2 mechanism.
Figure 2.7. Exchange of Residue 37 using CLEANEX-PM
The exchange of residue 37 was measured in 50 mM acetate, pH 5.4 at 37oC in 300 g/L PVP40 (cyan), in dilute solution (green), and in100 g/L NEP (magenta) using the CLEANEX-PM experiment (55). The rate is 9 ± 2 s-1 in dilute solution, 7 ± 1 s-1 in
PVP40, and 32 ± 3 s-1 in NEP. The smooth curve is determined as described by
Figure 2.8. Histogram of for chymotrypsin inhibitor 2 in 300 g/L PVP and dilute solution.
Macromolecular crowding with PVP40 stabilizes the I29A:I37H variant of CI2 relative to dilute solution. Values of ∆ °'
op
G , in300 g/L PVP40(cyan) and dilute solution (green) are plotted versus residue number. The height of each bar represents the average from three trials. The error bars represent the standard deviation.
Conditions: 700 - 800 µM variant protein, 50 mM acetate buffer made with D2O, pH
Figure 2.9. Ribbon structure of wild-type chymotrypsin inhibitor 2 (PDB, 2CI2) colored by ∆ °'
op
G .
(A) dilute solution (B) 300-g/L PVP40, and (C) 100-g/L NEP [blue: ∆ °'
op
G < 3.0 kcal/mol; green: 3.0 kcal/mol < ∆ °'
op
G < 5.0 kcal/mol; yellow: 5.0 kcal/mol < ∆ °'
op
G < 5.5 kcal/mol; cyan: 5.5 kcal/mol < ∆ °'
op
G < 8.0 kcal/mol]. (D) ∆ °'
op
G was measured in 0, 50, 100, and 300-g/L PVP40, and δ∆ °'
op
G / δ[PVP40] values were superimposed onto the structure [blue: δ∆ °'
op
G / δ[PVP40] = 0, yellow: 0 < δ∆ °'
op
G / δ[PVP40] < 2.5 x 10⁻³ (kcal/mol)/M, cyan: 2.5 x 10⁻³ (kcal/mol)/M < δ∆ °'
op
G / δ[PVP40] < 1.0 x 10⁻²
(kcal/mol)/M]. Residues for which there are no data are colored grey.
C
B
Figure 2.10.GdmCl denaturation of the I29A:I37H variant at 37 oC in 300 g/L PVP for three trials measured by circular dichroism at 242 nm.
The sample was 800 µM in 50 mM acetate buffer made with D2O, 300 g/L PVP. The
average m value is 2.3 ± 0.2 , the average [GuCl]50% is 1.31 ± 0.04, and the average
Table 2.1. 1H, 15N assignments and k
3 Caveats of in-cell NMR in
Escherichia coli
3.1 Introduction to in-cell NMR of globular, partially folded, and
natively disordered proteins
In-cell NMR is quite advantageous for studying proteins in a near
physiologically relevant environment, such as inside living E. coli. The technique gives atomic-level information about a protein in a noninvasive manner. The primary disadvantage, however, is that the technique depends tremendously on the
characteristics of the protein. In general, NMR is limited by the molecular weight of a protein. A large protein will slowly tumble causing broadening of linewidths, which can lead to complete disappearance of usable data. This tumbling rate depends upon the viscosity of the solution, and the viscosity of the E. coli cytoplasm is 9 times that of water (75). The viscosity of other cells types is 2 times greater than that of water (76). This increase in viscosity leads to an apparent increase in the molecular weight of a macromolecule inside the cytoplasm of all cell types, but most drastically for E. coli.
For a globular protein, signals from the amide backbone depend on the tumbling rate; therefore, the protein must be small, not bound to other
backbone since it does not have a rigid structure. The increased rotational freedom reduces T2 relaxation before severe line-broadening occurs. This allows one to observe a greater molecular weight range for natively-disordered proteins inside the cell compared to globular or partially-folded proteins. For instance, the Pielak lab has observed the natively disordered proteins FlgM (14 kDa) (19), α-SN (14 kDa) (20, 77), and human tau protein (45 kDa) [Brian McNulty, unpublished], and the Dötsch lab has observed the globular protein NMerA (7 kDa) (18).
3.2 Materials and Methods
3.2.1 In-cell NMR preparation of chymotrypsin inhibitor 2 (CI2) and apocytochrome b5
The following protocol is for in-cell NMR of CI2 and apocytochrome b5. The
plasmid was transformed into BL21 (DE3) Gold cells (Stratagene), plated on LB agar plates, and grown overnight at 37 oC. A single colony was used to inoculate 20 mL
15N-enriched Martek media (Spectra Stable Isotopes). The culture was grown
overnight at 37 oC with shaking (225 rpm). Fifteen mL of this starter culture was added to 250 mL of media in a 1 L Erlenmeyer flask. The culture was grown to an optical density of 1.0 (Abs600) at 37 oC with shaking (225 rpm). The cells were
induced with isopropyl thiogalactoside (IPTG, final concentration, 1 mM), and expression was allowed to occur at 37 oC for 5 h. Chloroamphenicol was then added to a final concentration of 50 µg/mL, and the culture was shaken for another 15 min. The cells were harvested at 1600 g for 30 min. The supernatant was decanted, and 2 mL were reserved for resuspension and spectrometer shimming. The wet pellet typically weighs 1.2 -1.5 g. The variation arises from the liquid remaining in the pellet. The pellet was resuspended in 200 µL of spent media (or buffer of interest). The final volume of the sample was approximately 1.2 mL. A 90:10 mixture of cell slurry:D2O was added to the NMR tube.
supernatant were subjected to analysis by SDS-PAGE to determine the relative amount of protein found in the supernatant.
3.2.2 In-cell NMR preparation of α-synuclein and FlgM
The preparation for in-cell NMR of α-SN and FlgM was adapted from McNulty et al. (20) and Dedmon et al. (19), respectively. The pT7-7 vector containing the
α-SN gene was transformed into E. coli BL21 Gold cells and selected with ampicillin. The pMCA4 vector containing the FlgM gene was also transformed into BL21 cells and selected with ampicillin (100 µg/mL). A 15 mL overnight culture was grown from a single colony and used to inoculate 250 mL of LBamp. The culture was grown to an
Abs600of 1.0 at 37 oC with shaking at 225 rpm. The cells were gently centrifuged at
1600 g for 30 min at 4 oC. The cell pellet was resuspended in 250 mL of M9 minimal media (Table 2.1), induced with IPTG to a final concentration of 1 mM, and grown in a rotary shaker (225 rpm) at 37 oC for 4 h. Following expression, the cells were harvested by centrifugation at 1600 g for 30 min at 4 oC. The cell pellet was resuspended in spent media to a final volume of 1.5 mL. A 90:10 mixture of sample:D20 was placed in a 5 mm NMR tube for data collection.
3.2.3 NMR analysis of extracellular protein
duplicate (referred to as Sample 1 and Sample 2). Sample 1 was immediately centrifuged. The supernatant from sample 1 was reserved for an NMR experiment and for analysis by SDS-PAGE. A 15N HSQC was collected on a cell slurry from sample 2 before the supernatant was harvested by centrifugation at 775 x g for 30 min. The supernatant was then removed and 15N HSQC spectra were collected on the supernatants from sample 1 and sample 2. The peak intensities were used to quantify the extracellular signal using NMRview (51).
3.2.4 Post-spectrometer SDS-PAGE analysis
The volume of the post-spectrometer sample was determined to two significant figures. The volume was approximately 1.5 mL. The sample was then centrifuged at 775 x g for 45 min, and the supernatant was removed. Both the supernatant and the cells were again centrifuged at 16,000 x g for 30 min. The second centrifugation frees the supernatant of cellular debris and removes most of the external buffer from the pelleted cells. All supernatants were combined and referred to as the extracellular supernatant since this contains any protein that has leaked from the cells during the experiment.
The volume of extracellular supernatant was subtracted from the total volume of sample to determine the volume of the cells. The pellet was resuspended in a volume of lysis buffer (50-mM acetate, pH 5.5)1 that was equivalent to the pellet volume. Lysozyme was not used because it overlaps on SDS-PAGE with the
proteins investigated. The resuspended cells were subjected to ten freeze/thaw cycles by using a dry ice/ethanol bath and room temperature water bath. The slurry was then centrifuged at 16,000 g for 30 min. The supernatant was removed, and the pellet was centrifuged again for 15 min. The two supernatants were combined, and referred to as the cellular supernatant. Finally, the ratio of the combined supernatant volumes to the original volume of the pellet was determined.
The extracellular supernatant volume was adjusted according to the increase in volume in the previous step. For instance, if the original pellet volume is 600 µL and the supernatant volume from the pellet is 700 µL, the volume of the extracellular supernatant is increased by 15% with the lysis buffer.
Ten µL of extracellular supernatant was diluted to 40 µL with lysis buffer, and 8 µL of SDS loading dye. This regimen was repeated with the cellular supernatant. The samples were then placed at 90 oC for 5 min. Three µL of each sample were loaded into an 18% SDS gel (75 mm x 8 cm). Gels were electrophoresed at 200 V for 50 min. The gel was stained with Coomassie Brilliant Blue and destained. The destained gel was scanned and analyzed using the freeware program ImageJ (NIH, http://rsb.info.nih.gov/ij/). The pixel density from the extracellular and cellular
supernatants was compared directly to quantify the relative amount of protein that is in the extracellular supernatant.
3.2.5 Encapsulating E. coli cells
filtered with a 0.22 filter. E. coli cells expressing 15N-enriched protein were grown
and prepared as previously described for in-cell experiments. A 50% v/v solution was made from the 2% alginate stock solution and the cell slurry.
The electrostatic encapsulation device comprised a 1-mL syringe, a 24-gauge angiocatheter (24 gauge, 0.7 x 19 mm tip, winged, Braun), a 23-gauge needle, a syringe pump, and an adjustable power supply ranging between 3.2 and 5.5 kV. The cell slurry/alginate mixture was loaded into the 1 mL syringe, the angiocatheter was attached, and the syringe was connected to the syringe pump in a vertical position (Fig. 3.1). The needle was inserted through the angiocatheter in a horizontal orientation. A 250-mL beaker with a stir bar and 150 mL of 150-mM CaCl2 was
placed below the syringe as a receiving bath. The positive voltage clamp was connected to the needle, and a copper-tip grounding wire was submerged in the receiving bath. The power supply was set to 3.7 kV, and the syringe pump was set to a rate of 0.71 mL/min. The cell slurry/alginate mixture was forced through the tip of the angiocatheter and streamed into the receiving bath below. The Ca2+-ion induced polymerization of the alginate formin the encapsulated bead of cells. The encapsulated cells were retrieved with suction and placed in solution of 90:10 LB/D2O for NMR studies.
3.2.6 NMR experiments of encapsulated cells
Data were collected on encapsulated cells expressing α-SN and CI2 for 16 h. The 15N HSQC spectra consisted of 128 transients and 100 increments. Following
cells and replaced with 1 mL of 10 mM ethylenediaminetetraacetic acid (EDTA). The EDTA dissolves the polymer by binding Ca2+. An 15N HSQC spectrum was collected on the unencapsulated cells.
3.3 Results
3.3.1 In-cell NMR of chymotrypsin inhibitor 2
It was initially believed that the CI2 was the perfect molecule for in-cell NMR. The protein is small, soluble, and overexpressed. Initial experiments resulted in well-resolved, low noise HSQC spectra of CI2 as seen in Fig. 3.2. The sample was analyzed for extracellular protein by SDS-PAGE, and this amount was determined to be minimal, ~100 µM (Fig. 3.3). However, the initial conclusions were incorrect. Although the amount of extracellular protein was small relative to the amounts of cytoplasmic protein (Fig 3.3), the NMR signal detected was from the extracellular protein. Figure 3.2, panel A shows a spectrum of the supernatant that has been immediately harvested from cells expressing CI2; panel B is a spectrum of CI2 “inside cells”; and panel C is a spectrum of supernatant that has been harvested after an in-cell experiment. It was initially thought that signal from inside the cells was seen “on top” of the signal from the extracellular protein since the concentration of cytoplasmic protein was at least 10-fold higher.
in peak intensity can be either the result of a decrease in linewidth, caused by, for instance, a decrease in viscosity, or an increase in protein concentration. A
decrease in viscosity would be expected if the protein is being released from the cytoplasm into the solution. The widths of CI2 crosspeaks were measured over a period of 24 h, and no change in peak linewidth was detected. This observation suggested that the increasing peak intensity was due solely to a change in concentration. This change was attributed to an increase in cell density in the detector region of the spectrometer. This was referred to as “cell settling”.
Cell settling was an inaccurate interpretation of the data. Figure 3.2 shows that CI2 was found in the supernatant at the beginning and the end of the
experiment. Since there was also no observable change in linewidths, we conclude that the CI2 signal originated from protein in the supernatant and not the cell. The increase in peak intensity was not the result cell settling but protein leaking from the cells into the supernatant. This CI2 result also implies that the CI2 in the cells is not observable, although, the concentration inside cells far exceeds the concentration of protein in the supernatant (Figure 3.3). The Almeida lab also concluded an increase in peak intensity was the result of increasing the concentration of extracellular
protein (78).
3.3.2 In-cell NMR and α-synuclein
Proteins previously used for in-cell NMR were reinvestigated to ensure that protein signal was coming from inside the cells, not from the extracellular
as shown in Figure 3.4. Figure 3.4 panels A and C show that there is no α-SN signal from the supernatant at either the beginning or the end of the experiment. The crosspeaks present in panels A and C belong to small molecules that incorporated
15N during expression. The spectrum in panel B is identical to the original work of
McNulty et al. (20). Also, SDS-PAGE analysis shows no protein detected in the extracellular supernatant (Figure 3.5). These data imply that α-SN does not leak from the cells during the length of an in-cell NMR experiment.
3.3.3 In-cell NMR and FlgM
FlgM was also investigated, and it was determined that all signal was from inside living E. coli. Figure 3.6 panels A and C shows that no FlgM is detectable in the extracellular supernatant before or after the in-cell NMR experiment. Panel B shows the spectrum of FlgM from the in-cell experiment inside living cells. The spectrum in panel B is identical to the original work of Dedmon et al. (19). The crosspeaks that are present in panel A and C belong to small molecules that incorporated 15N during protein expression.
3.3.4 In-cell NMR and apocytochrome b5
experiments. According to SDS-PAGE, the extracellular protein is minimal (Fig. 3.8); however, the signal is only observed from the extracellular protein (Fig 3.7). I concluded the signal from apocytochrome b5 during in-cell experiments arises from
the extracellular protein.
3.3.5 In-cell NMR of encapsulated cells
Panels A and B in Figure 3.9 show spectra from encapsulated cells
expressing α-SN and CI2, respectively. α-SN can be detected inside encapsulated cells proving we can still observe protein from inside cells even when encapsulated (Fig. 3.9A). On the other hand, CI2 was not observed inside alginate-encapsulated cells (Fig. 3.9B). CI2, however, was observed after dissolution of the encapsulates (Fig. 3.10). This proves encapsulation prevents protein leakage into the surrounding media. The observation also shows that CI2 cannot be observed in the E. coli
cytoplasm, suggesting the increased viscosity of the cytoplasm compared to dilute solution affects globular proteins differently than natively-disordered proteins.
3.4 Conclusions
The interpretation of in-cell NMR data must be pursued with caution. As determined above, SDS-PAGE analysis of the extracellular supernatant is not sufficient to support the interpretation that the spectra of CI2 and apocytochrome b5
apocytochrome b5 have been retracted (79). The definitive control for in-cell NMR is
to measure the signal in the supernatant at the beginning and end of the experiment. Both apocytochrome b5 and CI2 are ideal candidates for in-cell NMR since
they are small, soluble, and overexpressed; yet, it appears that no signal arises from inside cells. Recent results measuring protein dynamics show that globular proteins are more affected by the intracellular viscosity than natively-disordered proteins (Li, et al. in press, JACS). The increased cytoplasmic viscosity increases the transverse
3.5 Figures
Figure 3.2. Spectra of chymotrypsin inhibitor 2 from in-cell NMR experiment. Panel A: Spectrum collected on the supernatant from cells expressing CI2. The supernatant was collected from immediate centrifugation of Sample 1. Panel B: Spectrum collected on an in-cell sample of CI2 (Sample 2). Panel C: Spectrum collected on the supernatant collected from the in-cell sample of CI2 (from panel B) after 2 h incubation at room temperature under anaerobic conditions.
A
B
Figure 3.3. Commassie-stained, SDS-PAGE of chymotrypsin inhibitor 2 from the cytoplasm and the supernatant of an in-cell NMR experiment. Lanes: 1, Marker; 2, CI2 recovered from cytoplasm; 3, 2-fold dilution of lane 2; 4,
4-fold dilution of lane 2; 5, CI2 recovered from supernatant; 6, 1 mM CI2 standard ; 7, 750 µM CI2 standard; 8, 500 µM CI2 standard; 9, 250 µM CI2 standard; 10, 100 µM CI2 standard; 11, 50 µM CI2 standard.
Figure 3.4. Spectra of α-synuclein from an in-cell NMR experiment. Panel A: Spectrum collected on the supernatant collected immediately after
preparation from cells expressing α-SN (Sample 1). Panel B: Spectrum collected on an in-cell sample of α-SN (Sample 2). Panel C: Spectrum collected on the supernatant collected from the in-cell sample of α-synuclein (from Panel B) after 2 h incubation at room temperature under anaerobic conditions.
Figure 3.5. Commassie-stained, SDS-PAGE of α-synuclein recovered from the cytoplasm and supernatant of an in-cell NMR experiment.
Lanes:1, Marker; 2, 1 mM CI2 standard; 3, 750 µM CI2 standard; 4, 500 µM CI2 standard; 5, 250 µM CI2 standard; 6, 100 µM CI2 standard; 7, extraceullar α-SN from in-cell NMR sample; 8, cytoplasmic α-SN from in-cell NMR sample; 9, 2-fold dilution of lane 8; 10, 4-fold dilution of lane 8.
Figure 3.6. Spectra of FlgM from an in-cell NMR experiment
Panel A: Spectrum collected on the supernatant from cells expressing FlgM. The supernatant was collected from immediate centrifugation of the sample (Sample 1).
Panel B: Spectrum collected on an in-cell sample of FlgM (Sample 2). Panel C: Spectrum collected on the supernatant collected from an in-cell sample of FlgM (from Panel B) after 2 h incubation at room temperature under anaerobic conditions.
Figure 3.7. Spectra of apocytochrome b5 from in-cell NMR experiment. Panel A: Spectrum collected on the supernatant from cells expressing
apocytochrome b5. The supernatant was collected from immediate centrifugation of
the sample (Sample 1). Panel B: Spectrum collected on an in-cell sample of apo-b5
(Sample 2). Panel C: Spectrum collected on the supernatant collected from an in-cell sample of apo-b5 (from Panel B) after 2 h incubation at room temperature under
anaerobic conditions.
A
B
Figure 3.8. Commassie-stained, SDS-PAGE of apocytochrome b5 recovered from the cytoplasm and supernatant of an in-cell experiment.
Lane 1: Marker, Lane 2: cytoplasmic apocytochrome b5, Lane 3: apocytochrome b5
recovered from the extracellular supernatant.
Figure 3.9. Spectra from α-synuclein and chymotrypsin inhibitor 2 inside cells, supernatant, and encapsulated cells.
Right panel: α-SN, Left panel: CI2, from alginate encapsulated cells. (Li, et al., in press, JACS).