RECEIVED9 September 2015 REVISED3 November 2015 ACCEPTED23 January 2016 PUBLISHED ONLINE FIRST28 March 2016
Toward a better understanding of task
demands, workload, and performance
during physician-computer interactions
Lukasz M Mazur,1Prithima R Mosaly,1Carlton Moore,2Elizabeth Comitz,1Fei Yu,3
Aaron D Falchook,1Michael J Eblan,1Lesley M Hoyle,1Gregg Tracton,1Bhishamjit S Chera,1and Lawrence B Marks1
ABSTRACT
...
ObjectiveTo assess the relationship between (1) task demands and workload, (2) task demands and performance, and (3) workload and perfor-mance, all during physician-computer interactions in a simulated environment.
MethodsTwo experiments were performed in 2 different electronic medical record (EMR) environments: WebCIS (n¼12) and Epic (n¼17). Each participant was instructed to complete a set of prespecified tasks on 3 routine clinical EMR-based scenarios: urinary tract infection (UTI), pneumo-nia (PN), and heart failure (HF). Task demands were quantified using behavioral responses (click and time analysis). At the end of each scenario, subjective workload was measured using the NASA-Task-Load Index (NASA-TLX). Physiological workload was measured using pupillary dilation and electroencephalography (EEG) data collected throughout the scenarios. Performance was quantified based on the maximum severity of omis-sion errors.
ResultsData analysis indicated that the PN and HF scenarios were significantly more demanding than the UTI scenario for participants using WebCIS (P<.01), and that the PN scenario was significantly more demanding than the UTI and HF scenarios for participants using Epic (P<.01). In both experiments, the regression analysis indicated a significant relationship only between task demands and performance (P<.01).
DiscussionResults suggest that task demands as experienced by participants are related to participants’ performance. Future work may support the notion that task demands could be used as a quality metric that is likely representative of performance, and perhaps patient outcomes. ConclusionThe present study is a reasonable next step in a systematic assessment of how task demands and workload are related to perfor-mance in EMR-evolving environments.
...
Keywords: task demands, workload, performance, NASA-TLX, errors, EMR
BACKGROUND AND SIGNIFICANCE
There is increasing reliance on health information technology systems to perform clinical work. As part of their daily workflow, providers are required to interact continually with multiple, sometimes disparate, computer-based systems (eg, electronic medical records [EMRs], computerized physician order entry, image repositories, directories for paging, and the diverse informational offerings of the Internet) while providing care to patients, talking to family, or working with staff. There is no question that features of these computer-based systems afford unparalleled opportunities for improved patient care (eg, more ready access to patient-specific information, data integration, decision support, etc.) and thus have been vigorously embraced, explaining their near-universal implementation in provider health systems.1–7
Nevertheless, the suboptimal levels of adoption and integration of health information technology in US hospitals, and the need for providers to interact with multiple computer-based systems, also raise serious challenges that can hinder quality care.8,9 The unintended conse-quences include temporal productivity losses,10and increased rates of information processing errors11–14and catastrophic errors.15–18These studies are concerning and suggest that thoughtful systems design is required for effective electronic health records system implementation, incorporating only key safety- and quality-enhancing features while min-imizing additional workload placed on providers.
Specifically, the extraction and integration of data from EMRs can be cumbersome to providers and add unnecessary work. Providers
need to efficiently review and interpret diverse types of electronic in-formation, including text (eg, clinical notes), quantitative data (eg, laboratory measures), and medical images. This can be challeng-ing, especially as the amount of useful clinical data is rapidly growing.5–7,19If interfaces are designed and implemented subopti-mally, they can increase task demands and providers’ workload, which in turn may negatively affect their performance and patient safety.20–24Numerous studies in various health care settings
demon-strate that excess task demands and workload streaming from task complexities,25–27cross-coverage,28workflow interruptions,29 subop-timal workflows,30job-related stress,31staffing levels,32and overall cognitive information processing33–38 can hinder performance and safety. Workload in general has been shown to affect performance, in-cluding in aviation39–42and nuclear power.44–45
OBJECTIVES
Thus it seems reasonable to further advance our understanding of the relationship between clinical task demands, workload, and perfor-mance.46,47This could allow providers to develop safer EMR systems for better care, and to acquire new skills and knowledge to proactively manage their task demands and workload while maintaining concern for patient safety.49–51The objective of this research was to assess the relationship between (1) task demands and subjective and physio-logical measures of workload, (2) task demands and performance, and (3) subjective and physiological measures of workload and
Correspondence to Lukasz M Mazur, PhD, Department of Radiation Oncology, Box 7512, University of North Carolina, Chapel Hill, NC 27514, USA; [email protected]; Tel: (919) 616-9702; Fax: (919) 515-8585. For numbered affiliations see end of article.
VC The Author 2016. Published by Oxford University Press on behalf of the American Medical Informatics Association. All rights reserved. For Permissions, please email: [email protected]
RESEARCH
AND
APPLICATIONS
performance, all during physician-computer interactions in a simulated environment (Figure 1).
MATERIALS AND METHODS
Environment
Assessments were performed in a simulated environment as part of an Institutional Review Board approved study. All potential participants were given an opportunity to review a consent document that included information regarding study goals, procedures, risks and benefits, the voluntary nature of their participation, the confidentiality of data, etc. The following risks were also discussed with all potential participants (1) stress and anxiety during experiments, especially for participants with past experiences/memories of patient harm, and (2) possibility of boredom, mental fatigue, embarrassment at poor performance, frus-tration, and/or coercion. All participants had the right to decline partici-pation at any time. All participants who were offered participartici-pation signed the consent form and participated in the study.
Scenarios
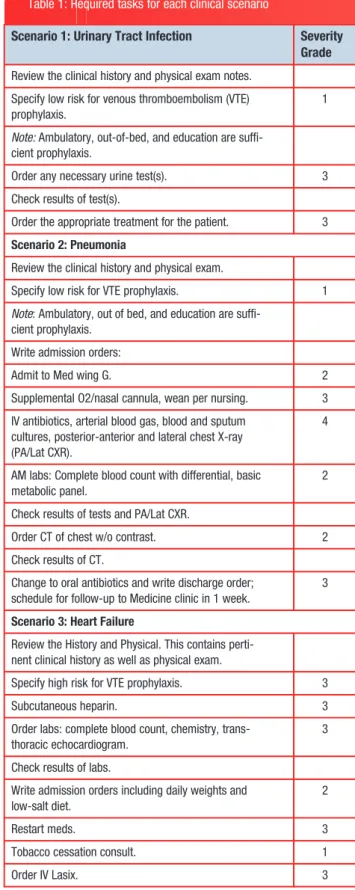
Each subject performed a set of predefined clinical tasks related to 3 scenarios (clinical task flows were based on the current best clinical practices). The 3 scenarios were designed by experienced physicians to vary by level of clinical complexity (the urinary tract infection [UTI] case being relatively “simple” with 5 tasks, and the pneumonia [PN] and heart failure [HF] cases being relatively more “difficult” with 8 and 9 tasks, respectively), and an increasing number of clinical tasks (Table 1). Each task within each scenario corresponding to ordering tests and/or medications was preassigned a severity grade based on its potential clinical impact (Grade 0: no error; Grade 1: Mild with no direct meaningful clinical impact expected; Grade 2: Moderate with no meaningful clinical impact expected; Grade 3: Severe with meaningful clinical impact expected; Grade 4: Life-threatening clinical impact ex-pected; Grade 5: Death) (Table 1). The proposed severity grading system is analogous to the National Cancer Institute Common Terminology Criteria for Adverse Events. The grading was determined by a consensus of physicians who helped to create the scenarios.
Participants
For the experiment run in the Web Computer Information System (WebCIS) environment, invitations to participate in the research study were sent to all residents and fellows in the school of medicine to form a relatively heterogeneous group with variable levels of clinical and WebCIS experience as related to our simulated scenarios (Table 2). For the experiment in the Epic environment, experiment invi-tations were sent only to medical students and resident physicians from the Emergency and Internal Medicine departments to form a rela-tively homogenous group with a relarela-tively similar level of clinical and EMR experience as related to our simulated scenarios (Table 2).
All participants were incentivized to participate with a $100 gift card. Final selections were made based on participants’ availability to participate in the study during designated weeks for data collection. Twelve participants completed the WebCIS experiment and 17 partici-pants completed the Epic experiment, all from 1 teaching hospital.
Figure 1:Study Objectives Table 1: Required tasks for each clinical scenario
Scenario 1: Urinary Tract Infection Severity Grade
Review the clinical history and physical exam notes.
Specify low risk for venous thromboembolism (VTE) prophylaxis.
1
Note:Ambulatory, out-of-bed, and education are suffi-cient prophylaxis.
Order any necessary urine test(s). 3
Check results of test(s).
Order the appropriate treatment for the patient. 3
Scenario 2: Pneumonia
Review the clinical history and physical exam.
Specify low risk for VTE prophylaxis. 1
Note: Ambulatory, out of bed, and education are suffi-cient prophylaxis.
Write admission orders:
Admit to Med wing G. 2
Supplemental O2/nasal cannula, wean per nursing. 3
IV antibiotics, arterial blood gas, blood and sputum cultures, posterior-anterior and lateral chest X-ray (PA/Lat CXR).
4
AM labs: Complete blood count with differential, basic metabolic panel.
2
Check results of tests and PA/Lat CXR.
Order CT of chest w/o contrast. 2
Check results of CT.
Change to oral antibiotics and write discharge order; schedule for follow-up to Medicine clinic in 1 week.
3
Scenario 3: Heart Failure
Review the History and Physical. This contains perti-nent clinical history as well as physical exam.
Specify high risk for VTE prophylaxis. 3
Subcutaneous heparin. 3
Order labs: complete blood count, chemistry, trans-thoracic echocardiogram.
3
Check results of labs.
Write admission orders including daily weights and low-salt diet.
2
Restart meds. 3
Tobacco cessation consult. 1
Order IV Lasix. 3
RESEARCH
AND
APPLICATIONS
Each participant was instructed to complete a set of prespecified tasks on 3 routine clinical EMR-based scenarios under a “cross-coverage” status (not familiar with the patients) in a simulated environment (Table 1).
Data collection and processing
Quantification of scenario-specific demands
To obtain the click- and time-related data, scenario workflows were reconstructed from recorded screen-capture videos, including eye movements and computer pointer movements and clicks.
Click analysis: The total number of clicks for participants to com-plete each scenario was quantified, and further subcategorized into: (i) navigation clicks (eg, moving from one window to another window on the screen, etc.), (ii) decision clicks (eg, selecting a test or medication, etc.), (iii) search clicks (eg, initiating the search op-tion for medicaop-tions/orders, etc.), and (iv) total clicks (sum of navi-gation, decision, and search clicks).
Time analysis: The total time for participants to complete each sce-nario was quantified.
Quantification of subjective workload
The NASA-Task-Load Index (TLX) is widely considered to be a valid and reliable subjective measure of workload, and is used across many disciplines.52,53The NASA-TLX considers 6 dimensions: mental, phys-ical, temporal demands, frustration, effort, and performance. At the end of each simulated scenario, participants completed the NASA-TLX questionnaire without being aware of their actual clinical performance. First, each participant performed 15 separate pair-wise comparisons between the 6 dimensions (mental, physical, and temporal demands, frustration, effort, and performance) to determine the relevance (and hence a greater weight) of that dimension for a given scenario for that participant. Second, participants marked a workload score ranked from “low” (corresponding to 0) to “high” (corresponding to 100) for each dimension for each scenario. Finally, the composite NASA-TLX
score for each scenario was obtained by multiplying the dimension weight (number of times a dimension was chosen) with the corre-sponding NASA-TLX dimension score, summing across all dimensions, and dividing by 15.
Quantification of physiological workload (eye-data)
For the WebCIS experiment, pupil dilation data was recorded from the left eye using the 60 Hz VisionTrak (ISCAN Inc., Burlington, MA, USA) head-mounted eye-tracking system. For the Epic experiment, pupil di-lation data was recorded as an average value derived from both eyes using the 60 Hz Tobi TX-60 remote eye-tracking system. For both ex-periments, the baseline pupillary data regarding cognitive work was computed by averaging the pupillary dilation collected during the last 1 second prior to recall of the 3-letter memorization tasks repeated 10 times, as previously recommended by experts.54–57
Eye blinks and other artifacts (partial closures and outliers, based on visual inspection by an expert) were removed from the raw pupil di-ameter data and linearly interpolated to fill the missing data, resulting
in<10% loss for any participant. We used the average pupil diameter
and the percent of time that a subject’s pupil was dilated by 0.45 mm, calculated from our baseline as measures of workload. As shown by scholars, in both basic and practical applications, maximum pupillary dilation response under cognitive load ranges from 0.5– 0.7 mm (corresponding to about a 6-digit memorization task), and pu-pil dilation0.45 mm was considered as “high” workload where per-formance degradation might be expected.
Quantification of physiological workload (EEG)
During the experiment in the WebCIS environment, electroencephalog-raphy (EEG) data were collected using a Nicolet nEEG V32 amplifier. Electrodes were placed using the 10–20 international system on Fp1, Fp2, F3, F4, T3, T4, Cz, O1, O2 with reference and ground electrodes at FCz/A1 and A2 and CPz, respectively. Data processing was accom-plished by subtracting the averaged A1/A2 reference signal from the remaining 9 neural signals. Data was filtered using the fourth-order Butterworth band-pass filter with cutoff frequencies of 0.3 Hz and 250 Hz. Independent component analysis58was performed to remove temporal muscle activity from signals. Extreme value rejection was performed on epoched data (1 s event-locked trials) with a rejection threshold at 3 times the largest standard deviation across all electrode sites. Frequency content extraction was accomplished using a Morlet wavelet,59for 0.5–50 Hz at 0.5 Hz increments, allowing us to analyze EEG rhythmic activity frequency bands. We compared the average power of the frontal midline theta signal (6–7 Hz) at Fz, with the power of the posterior midline alpha signal at Pz (8–10 Hz). The averaged data have been converted toz-scores for each participant across the scenarios and then averaged across participants. This methodology was originally developed to measure working memory load,60,61and
was further refined by Smith, Gevins, and colleagues62for monitoring task loading during complex forms of human-computer interactions (eg, air traffic control), with increase (synchronization) in theta and de-crease (de-synchronization) in alpha power indicating higher mental effort to perform the task.
During experiment in the Epic environment, EEG data collection was done using the X-10 wireless EEG headset system from Advanced Brain Monitoring (ABM). The ABM system included multiple bipolar sensor sites: Fz, F3, F4, Cz, C3, C4, POz, P3, and P4. In general, ABM software filters EEG signals with a band-pass filter (0.5–65 Hz) before the analog-to-digital conversion. In order to remove environmental artifacts from the power network, sharp notch filters at 50 Hz, 60 Hz, 100 Hz, and 120 Hz are applied. The algorithm
Table 2: Composition of participants within each experiment
Post-graduate year
No. of participants
Experience with EMR (years)
WebCIS 1 1 1
2 2 0.5–2
3 4 0.5–3
4 1 2
5 2 0.5–2
>5 2
Epic 0a 7 0.5
1 4
2 1
3 2
4 2
5 1
a
Medical students
RESEARCH
AND
APPLICATIONS
automatically detects and removes a number of artifacts in the time-domain EEG signal, including spikes caused by tapping or bumping of the sensors, amplifier saturation, and excursions that occur during the onset or recovery of saturations. In addition to the conventional data analysis methodology (power of theta [6–7 Hz] at Fz versus power of alpha signal at Pz [8–10 Hz]),62the ABM’s algorithm automatically cal-culated the index of cognitive workload using quadratic and linear dis-criminant function analyses of model-selected EEG variables derived from the power spectral analysis of the 1 Hz bins from 1–40 Hz,63,64
which is different from the conventional analysis.60–62 It has been shown that ABM’s workload index increases with working memory load and increasing difficulty of cognitive tasks (eg, arithmetic, prob-lem-solving), and has been validated in a variety of “simple” and “complex” environments, including military, industrial, and educational simulation environments.65–68
Quantification of performance
From a patient’s perspective, clinical outcome is arguably the most meaningful endpoint. Performance is the most immediate upstream surrogate for clinical outcome, and is therefore a commonly consid-ered metric.1,6,11,13,16,33,69Performance was quantified using the fol-lowing set of metrics:
Errors: Not ordering predetermined tests and/or medications speci-fied in clinical scenarios as shown inTable 1was considered an omission error (seeTable 1for severity scores as related to studied tasks). For each participant, the error with the most severe grade was considered for analysis.
Data analysis
As physicians vary in how they interact with computer-based systems (ie, use different workflows to complete tasks), the actual task de-mands as experienced by participants needed to be determined as part of data analysis. The standard least square regression analysis was used to check for significant differences in task demands be-tween scenarios as quantified by the total number of clicks and the
time to complete scenarios, while treating the scenarios (UTI, PN, HF) as a fixed effect and participants as a random variable. This allowed us to rank tasks demands as “low” or “high,” which was further used during analyses of main objectives.
The relationship between (1) task demands and workload was de-termined using standard least square regression analysis. The rela-tionships between (2) task demands and performance and (3) workload and performance were determined using ordinal regression analysis. Before data analysis, we completed tests for normality and equal variance for all study variables using Shapiro-Wilk’s and Bartlett tests, respectively. Results indicated that assumptions were satisfied (normality: allP>.05; equal variance: allP>.05). All our data analy-ses were conducted using JMP 10 software while specifying missing data (during the WebCIS experiment, our research team neglected to collect one NASA-TLX score for the HF scenario; we also lost 4 data points related to click analysis due to corrupted video-recording files).
RESULTS
Quantification of task demands
Descriptive statistics of task demands, subjective and objective work-loads, and performance for each scenario are provided inTable 3. The fixed effects test indicated significant differences between scenarios as quantified by the total number of clicks: WebCIS:F(2,19)¼13.99,
P<.01 with PN and HF significantly >UTI; Epic: F (2,32)¼31.86,
P<.01 with PN significantly>UTI and HF; and time to complete sce-narios: WebCIS: F (2,22)¼25.53, P<.01 with PN and HF significantly>UTI; Epic: F (2,32)¼29.01, P<.01 with PN significantly>HF and UTI. This allowed us to establish appropriate ranking of task demands as experienced by participants (WebCIS: PN and HF>UTI; Epic: PN>UTI and HF). MANOVA revealed significant differences (with at leastP<.05) between all types of clicks (naviga-tion, decision, searching) in both experiments (further reassuring the ranking; seeTable 1). Overall, in both the UTI and HF cases in both ex-periments, the severity of omission errors was generally<grade 3 (no meaningful clinical impact). In the PN case, participants in each experiment were more likely to be noted with severitygrade 3. The
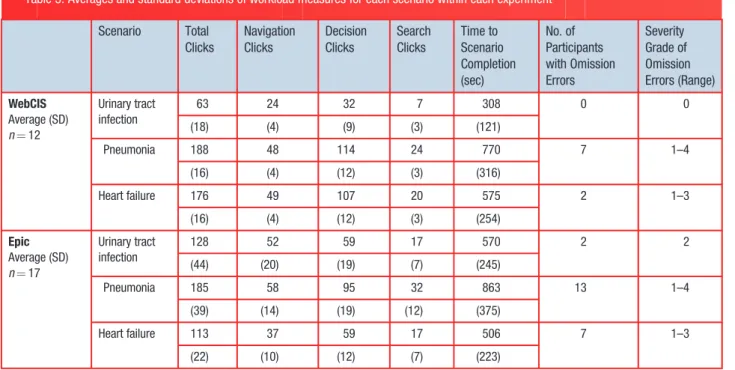
Table 3: Averages and standard deviations of workload measures for each scenario within each experiment
Scenario Total Clicks
Navigation Clicks
Decision Clicks
Search Clicks
Time to Scenario Completion (sec)
No. of Participants with Omission Errors
Severity Grade of Omission Errors (Range)
WebCIS Average (SD) n¼12
Urinary tract infection
63 24 32 7 308 0 0
(18) (4) (9) (3) (121)
Pneumonia 188 48 114 24 770 7 1–4
(16) (4) (12) (3) (316)
Heart failure 176 49 107 20 575 2 1–3
(16) (4) (12) (3) (254)
Epic Average (SD) n¼17
Urinary tract infection
128 52 59 17 570 2 2
(44) (20) (19) (7) (245)
Pneumonia 185 58 95 32 863 13 1–4
(39) (14) (19) (12) (375)
Heart failure 113 37 59 17 506 7 1–3
(22) (10) (12) (7) (223)
RESEARCH
AND
APPLICATIONS
number of participants with omission errors and the associated range of severity grade are presented inTable 3.
Relationship between task demands and subjective workload (NASA-TLX)
Standard least square analysis indicated a significant relationship be-tween task demands and NASA-TLX scores in the WebCIS experiment:
F(1,33)¼10.54, with parameter estimateb ¼ 12.93,P<.01, with NASA-TLX scores UTI [30 (12)], PN [46 (11)], and HF [39 (9)] (Figure 2a); but not in the Epic experiment, with NASA-TLX scores UTI [41 (18)], PN [48 (17)], and HF [43 (20)] (Figure 2b). Considering all NASA-TLX dimensions as dependent variables simultaneously, the MANOVA revealed significant differences in both experiments (WebCIS: mental (46)>effort (40)>temporal (39)>frustration (36)>performance (26), with physical dimension not applicable [not selected during pair-wise comparisons]; Epic: mental (51)>effort (48)>temporal (44)>frustration (32)>performance (32), with physical dimension not applicable [not selected during pair-wise comparisons]).
Relationship between task demands and physiological workload (eye data)
In both experiments there were no significant relationships between task demands and eye data as quantified by frequency of pupillary di-lations>0.45 mm and average amplitude from the 3-letter memoriza-tion baseline.
Relationship between task demands and physiological workload (EEG data)
In both experiments there were no significant relationships between scenario-specific demands and EEG as quantified by conventional methods (theta versus alpha powers) and the ABM’s index of workload.
Relationship between task demands and performance
Ordinal regression analysis indicated a significant relationship be-tween scenario-specific demands and severity of errors in the WebCIS X2ð1;N¼36Þ ¼8:73, P
<.01 (Figure 2a) and Epic
X2ð1;N ¼51Þ ¼16:67,P<.01 (Figure 2b) experiments. Relationship between subjective and objective measures of workload and performance
Ordinal regression analysis indicated a significant relationship between subjective workload, as quantified by the NASA-TLX, and severity of errors in the WebCISX2ð1;N¼35Þ ¼11:86,P<.01 (Figure 2a) but not in the Epic experiment. There were no significant relationships in either ex-periment between physiological measures of workload and performance.
DISCUSSION
The results suggest that there was a significant relationship between tasks demands as experienced by participants and performance as quantified by the severity of omission errors. This relationship was seen in both experiments irrespective of study group and type of EMR, thus suggesting that task demands as experienced by physicians (eg, more clicks, more time) are related to performance (more omission er-rors). This is most evident in the PN case, which demanded that par-ticipants complete a set of predefined admission orders (see step 3 in Table 2) with relatively detailed instructions, resulting in more omis-sion errors (eg, forgetting to complete the order, not being able to find the order set/item). A relationship between task demands and severity of omission errors has not been widely quantified and reported for physicians interacting with EMRs. Future work may support the notion that human-computer behavioral data (clicks) as well as total time spent to complete EMR-based tasks could also be used as quality metrics that are likely representative of performance, and perhaps
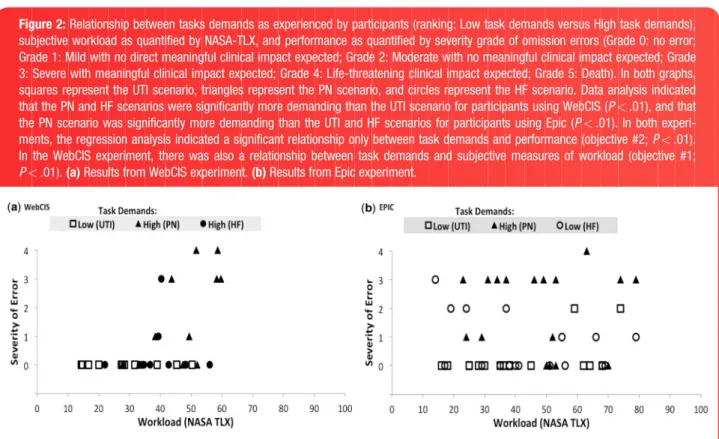
Figure 2:Relationship between tasks demands as experienced by participants (ranking: Low task demands versus High task demands),
subjective workload as quantified by NASA-TLX, and performance as quantified by severity grade of omission errors (Grade 0: no error; Grade 1: Mild with no direct meaningful clinical impact expected; Grade 2: Moderate with no meaningful clinical impact expected; Grade 3: Severe with meaningful clinical impact expected; Grade 4: Life-threatening clinical impact expected; Grade 5: Death). In both graphs, squares represent the UTI scenario, triangles represent the PN scenario, and circles represent the HF scenario. Data analysis indicated that the PN and HF scenarios were significantly more demanding than the UTI scenario for participants using WebCIS (P<.01), and that the PN scenario was significantly more demanding than the UTI and HF scenarios for participants using Epic (P<.01). In both experi-ments, the regression analysis indicated a significant relationship only between task demands and performance (objective #2;P<.01). In the WebCIS experiment, there was also a relationship between task demands and subjective measures of workload (objective #1;
P<.01).(a)Results from WebCIS experiment.(b)Results from Epic experiment.
RESEARCH
AND
APPLICATIONS
patient outcomes. This could be operationalized using automated scoring technology in EMRs (eg, an unusually high number of total/ navigation/search/decision clicks, etc.).
Our results also suggest the existence of relationships between the subjective measure of workload as quantified by the NASA-TLX scores and (i) task demands as quantified by the behavioral interactions (clicks and time to complete) and (ii) performance as quantified by the severity of omission errors. However, these relationships were only found in the WebCIS experiment, which included a relatively heteroge-neous group of participants with a variable level of clinical and EMR experience as related to our simulated scenarios. Future work may support the notion that perceived workload by physicians could also be considered as a quality metric that is representative of performance and perhaps patient outcomes. Asking providers to score their work-load at the end of a preselected task involving EMRs could be relatively easily operationalized in actual clinical environments. However, in the more homogeneous group of participants tested in the Epic environ-ment, there was no relationship between either subjective measures of workload and task demands or performance. This suggests that the subjective evaluation of workload may be masked by participants’ ex-perience (or confidence) and therefore might not reflect the actual suboptimal behavioral experience (more clicks, time) with the EMR.
No significant relationships were found between task demands and physiological measures of workload. This is somewhat contradictory to previous findings supporting the applicability of physiological mea-sures of workload to detect differences in task demands or perfor-mance.60–68,70–72 This might be indicative of limitations to our data
processing and quantification procedures and methods, or the pres-ence of other confounding factors related to cognitive information pro-cessing or general cognitive states (eg, arousal, anxiety, stress) experienced by participants during our simulated experiments. It is also possible that the physiological measures of workload used in this study, which were primarily developed and validated based on activations re-lated to working memory,60–64might not be appropriate (ie, sensitive
and specific enough) to reflect the complex information processing ex-perienced by participants during our experiments. We also acknowl-edge the possibility that despite significant differences in task demands (eg, clicks, time), the workload experienced by participants was not “distinctive” enough to produce significant differences in their physio-logical responses.
There are several limitations to this study, and thus caution should be exercised in generalizing our findings. First, the results are based on 2 experiments, each with a limited number of participants (medical stu-dents, resistu-dents, and fellows) from 1 teaching hospital, performed on a set of specific scenarios without random assignment of scenarios to participants. In the WebCIS experiment, we purposefully sampled from a relatively heterogeneous population of participants with variable levels of clinical and EMR experience as related to our simulated scenarios, so that we could sample a range of capabilities. However, inclusion of 2 particular residents who committed the most errors and most severe errors, including the highest severity scores (both indicated perfor-mance degradation at the end of the experiment), may have unduly af-fected the results. The analysis was repeated with the 2 residents excluded, and the overall conclusions regarding our findings remained virtually unchanged. None of the participants in the Epic experiment in-dicated performance degradations at the end of the experiment. Similarly, we repeated our analysis while excluding the 1 participant with the severity score of 4, and the overall conclusions regarding our findings also remained virtually unchanged. Nonetheless, larger stud-ies, controlling for levels of clinical and EMR experience, could allow for a regression of provider-specific factors like specialty, training level,
etc. We also purposefully did not randomly assign scenarios to partici-pants in order to avoid potential differences in the learning curve and to control for a potential carryover of a workload effect from scenario to scenario, which could unexpectedly bias the study. To minimize this ef-fect, we elected to administer experiments consistently across all par-ticipants starting with the UTI case and followed by the PN and HF cases.
Second, performing the tasks in the simulated environment, where the participants knew that their work was going to be critiqued, may have caused stress and anxiety that could influence their physiological measures and performance. On the other hand, performing the tasks in the simulated environment might have induced less attentiveness and vigilance in participants as perceived by no possibility of real harm to patients based on performance.70This potential bias is present in es-sentially all simulation-based research. To minimize this effect, all par-ticipants were informed (via the consent form and verbally by the researchers before the experiments) that they had the right to decline participation and that the subject-specific findings would remain confi-dential. None of the participants voiced any concerns to the researchers over this issue, and no participants declined participation in the study.
Third, reporting workload via NASA-TLX is subjective and can be chal-lenging for some participants. Our research group has had extensive ex-perience with the NASA-TLX tool in the clinical and simulated environment, and investigators in the present study felt most comfortable instructing participants on how to complete this assessment. Further, some of the NASA-TLX dimensions might not be relevant for this research setting (eg, physical demand).53Using multiple instruments and measures
could provide more robust results and protect against potential interpretive errors. Nevertheless, the NASA-TLX is currently the most widely accepted instrument to perform such assessments.53We repeated the analyses for a modified NASA-TLX excluding the physical demand component from the global score, and the results were largely unchanged.
Fourth, the techniques used to assess human-computer interaction behaviors are inexact. For example, the investigators may or may not have accurately interpreted all clicks (decision versus navigation ver-sus search) related to the appropriate behavior while reviewing the videos. To minimize this source of error, 2 investigators of this study independently reviewed the original analysis to ensure accuracy.
Fifth, the use of different instrumentation for collection of physiologi-cal data could have affected participants differently (eg, differences in setup). However, it is not likely that instrumentation would affect partici-pants’ overall performance. Sixth, our simulation environment did not fully replicate a real clinical environment, as some components or condi-tions of the studied scenarios were not easily emulated in our simulation. For example, some participants wanted to look up documentation in an alternative piece of software while conducting a simulated scenario, or had a question regarding how to locate a particular test or medication within the EMR. Thus, all participants were informed about the limitations of our simulated environment before the experiments (eg, no access to additional software, no consultations/help regarding the use of EMR, etc.). Despite these limitations, we believe that the findings support the use of task demands and subjective evaluation of workload as quality metrics representative of performance, and perhaps patient outcomes.
Directions for future research include: (i) random assignment of scenarios to participants with additional assessments and with a larger sample size, (ii) assessment of the targeted population of physicians in terms of academic background and EMR experience, and (iii) additional studies involving alternative EMR environments. It might be particularly valuable to perform studies focused on task demands, workload, and performance in real clinical settings. In the future, one might be able to perform a prospective assessment of an intervention using projected
RESEARCH
AND
APPLICATIONS
task demands and workload metrics to distribute work more evenly among staff in order to prevent dangerous task demands and workload thresholds from being crossed. This would need to be carefully done in order to control for confounding variables such as system design, vary-ing technologies, communication, workflow, and environment. Indeed, it is the presence of such confounding variables that makes simulation-based research appealing.70There is also a need to further develop and assess the utility of physiological measures of workload to predict performance while considering potential confounding factors streaming from cognitive information processing or general cognitive states (eg, participants’ arousal, anxiety, and stress).
CONCLUSION
It is widely believed that health information technology, when de-signed, implemented, and used appropriately, can enhance patient safety and improve quality of care. However, designed and applied in-appropriately, health information technology can add complexity and frustration, increase task demands, increase workload, and reduce performance that can negatively affect clinical care. Physicians will continue to be challenged by the increasing reliance on computer-based tools in the clinical environment. Much has been written about the unforeseen consequences of health information technology, with many scholars and practitioners raising concerns about decreased quality of care. The present study is a reasonable next step in the sys-tematic assessment of how task demands and workload are related to performance in EMR-evolving environments.
ACKNOWLEDGEMENTS
This study was originally funded by the Innovation Center at the University of North Carolina (UNC) and the UNC Health Care System. The data analysis of subjective and psychological measures of workload was partially supported by grants R18HS023458 and R21HS024062 from the Agency for Healthcare Research and Quality. The content is solely the responsibility of the authors and does not neces-sarily represent the official views of the Agency for Healthcare Research and Quality. We want to thank Dr Flavio Frohlich and his graduate student Michael Boyle from the Department of Psychiatry, Cell Biology and Physiology, and Biomedical Engineering at UNC for their support in collecting and analyzing the EEG-related data. We would also like to thank Drs Shereef Elnahal and Joseph Herman from the Department of Radiation Oncology and Molecular Radiation Sciences at Sidney Kimmel Comprehensive Cancer Center at Johns Hopkins University School of Medicine in Baltimore, MD, for reviewing and providing their insightful inputs regard-ing study designs and results. Finally, we want to express our gratitude to all partici-pants for their time and effort while participating in our experiments.
REFERENCES
1. Bates DW, Leape LL, Cullen DJ,et al. Effect of computerized physician order entry and a team intervention on prevention of serious medication errors. JAMA.1998;280:1311–1316.
2. Elnahal SM, Joynt KE, Bristol JS,et al. Electronic health record functions dif-fer between best and worst hospitals. Am J Manag Care. 2011;17: e121–e147.
3. Blumenthal D, Glaser JP. Information technology comes to medicine.N Engl J Med.2007;356:2527–2534.
4. Aarts J, Koppel R. Implementation of computerized physician order entry in seven countries.Health Aff.2009;28:404–414.
5. Chaudhry B, Wu S, Maglione M,et al. Systematic review: impact of health information technology on quality, efficiency, and costs of medical care.Ann Intern Med.2006;144:e12–e22.
6. Kaushal R, Shojania KG, Bates DW. Effects of computerized physician order entry and clinical decision support systems on medication safety: a system-atic review.Arch Intern Med.2003;23;163:1409–1416.
7. DesRoches CM, Campbell EG, Vogeli C,et al. Electronic health records’ lim-ited successes suggest more targeted uses.Health Aff.2010;29:639–646. 8. Jha AK, DesRoches CM, Campbell EG,et al. Use of electronic health records
in U.S. hospitals.N Engl J Med.2009;360:1628–1638. 9. Leape LL. Errors in medicine.Clin Chim Acta.2009;404:2–5.
10. Cheriff AD, Kapur AG, Qiu M,et al. Physician productivity and the ambulatory EHR in a large academic multi-specialty physician group.Int J Med Inform. 2010;49:492–500
11. Ash JS, Berg M, Coiera E. Some unintended consequences of information technology in health care: the nature of patient care information system re-lated errors.J Am Med Inform Assoc.2004;11:104–112.
12. Ash JS, Sittig DF, Dykstra RH,et al. Categorizing the unintended sociotech-nical consequences of computerized provider order entry.Int J Med Inform. 2007;76(Suppl 1):21–27.
13. Ash JS, Sittig DF, Dykstra R,et al. The unintended consequences of com-puterized provider order entry: findings from a mixed methods exploration. Int J Med Inform.2009;78(Suppl 1):69–76.
14. Campbell EM, Sittig DF, Ash JS,et al. Types of unintended consequences related to computerized provider order entry.J Am Med Inform Assoc. 2006;13:547–556.
15. Dexter PR, Perkins SM, Maharry KS,et al. Inpatient computer-based stand-ing orders vs. physician reminders to increase influenza and pneumococcal vaccination rates: a randomized trial.JAMA.2004;292:2366–2371. 16. Han YY, Carcillo JA, Venkataraman ST,et al. Unexpected increased mortality
after implementation of a commercially sold computerized physician order entry system.Pediatrics.2005;116:1506–1512.
17. Harrison MI, Koppel R. Interactive sociotechnical analysis: identifying and coping with unintended consequences of IT implementation. In Khoumbati K, Dwivedi YK, Srivastava A, Lal B, eds.Handbook of Research on Advances in Health Informatics and Electronic Healthcare Applications: Global Adoption and Impact of Information Communication Technologies. Hershey, PA: IGI Global; 2010:31–49.
18. Dekker S. Doctors are more dangerous than gun owners: a rejoinder to error counting.Hum Factors.2007;49:177–184.
19. Carayon P, Smith P, Hundt AS,et al. Implementation of an electronic health records system in a small clinic: the viewpoint of clinic staff.Behav Inf Technol.2009;28:5–20.
20. Vicente KJ.Cognitive Work Analysis: Toward Safe, Productive and Healthy Computer-based Work. Mahwah, NJ: Lawrence Erlbaum Associates; 1999. 21. Peute LP, Jaspers M. The significance of a usability evaluation of an
emerg-ing laboratory order entry system.Int J Med Inform.2007;76:157–168. 22. Wachter SB, Johnson K, Albeit R,et al. The evaluation of a pulmonary
dis-play to detect adverse respiratory events using high-resolution human simu-lator.J Am Med Inform Assoc.2006;13:635–642.
23. Russ AL, Melton BL, Russell SA,et al. Applying human factors principles to alert design increases efficiency and reduces prescribing errors in a sce-nario-based simulation.J Am Med Inform Assoc.2014;21(e2):287–296. 24. Elliott DJ, Young RS, Brice J,et al. Effect of hospitalist workload on the
qual-ity and efficiency of care.JAMA Intern.2014;174:786–793.
25. Mazur LM, Mosaly PR, Jackson M,et al. Quantitative assessment of work-load and stressors in clinical radiation oncology.Int J of Radiat Oncol Biol Phy.2012;83:e571–e576.
26. Yurko YY, Scerbo MW, Prabhu AS,et al. Higher mental workload is associ-ated with poorer laparoscopic performance as measured by the NASA-TLX Tool.Simul Healthc.2010;5:267–271.
27. Zhang Y, Padman R, Levin JE. Reducing provider cognitive workload in CPOE use: optimizing order sets.Stud Health Technol Inform.2013;192:734–738. 28. Mosaly PR, Mazur LM, Jones EL,et al. Quantifying the impact of cross
cov-erage on physician’s workload and performance in radiation oncology.PRO. 2013;3:e179–e186.
29. Weigl M, M€uller A, Vincent C,et al. The association of workflow interruptions and hospital doctors’ workload: a prospective observational study.BMJ Qual Saf.2012;21:399–407.
30. Perna G. Clinical alerts that cried wolf. As clinical alerts pose physician workflow problems, healthcare IT leaders look for answers.Healthc Inform. 2012;29:18–20.
31. Van den Hombergh P, Kunzi B, Elwyn G,et al. High workload and job stress are associated with lower practice performance in general practice: an
RESEARCH
AND
APPLICATIONS
observational study in 239 general practices in the Netherlands.BMC Health Serv Res.2009;9:118.
32. Tarnow-Mordi WO, Hau C, Warden A,et al. Hospital mortality in relation to staff workload: a 4-year study in adult intensive care unit.The Lancet. 2000;356:185–189.
33. Slagle J, Weinger MB. The effects of intraoperative reading on vigilance and workload during anesthesia care in an academic medical center.Anes. 2009;110:275–283.
34. Avansino J, Leu MG. Effects of CPOE on provider cognitive workload: a ran-domized crossover trial.Pediatrics.2012;130:e547–e552.
35. Carswell C. Assessing mental workload during laparoscopic surgery.Surg Innov.2005;12:80–90.
36. Gaba DM, Lee T. Measuring the workload of the anesthesiologist.Anesth Analg.1990;71:354–361.
37. Young G, Zavelina L, Hooper V. Assessment of workload using NASA Task Load Index in perianesthesia nursing.J Perianesthesia Nurs.2008;3:102–110. 38. Byrne A. Measurement of mental workload in clinical medicine: a review
study.Anaesth Pain Med.2001;1:90–94.
39. Ayaz H, Willems B, Bunce, S,et al. Cognitive workload assessment of air traffic controllers using optical brain imaging sensors. In Marek T, Karwowski W, Rice V, eds.Advances in Understanding Human Performance: Neuroergonomics, Human Factors Design, and Special Populations. CRC Press, Taylor & Francis Group; 2010:21–32.
40. Colle HA, Reid GB. Mental workload redline in a simulated air-to-ground combat mission.Int J Aviat Psychol.2005;15:303–319.
41. Lee KK, Kerns K, Bones R,et al. Development and validation of the controller acceptance rating scale (CARS): Results of empirical research.4th USA/ Europe Air Traffic Management Research and Development Seminar (ATM-2001). Santa Fe, NM, 2001.
42. Hoffman E, Pene N, Rognin L,et al. Introducing a new spacing instruction, impact of spacing tolerance on flight crew activity.Proceedings of the 47th Annual Meeting of the Human Factors and Ergonomics Society. Santa Monica, CA, 2003.
43. Haga S, Shinoda H, Kokubun M. Effects of task difficulty and time-on-task on mental workload.Jpn Psychol Res.2002;44:134–143.
44. Byun SN, Choi SN. An evaluation of the operator mental workload of ad-vanced control facilities in Korea next generation reactor.J Korean Inst of Ind Eng.2002;28:178–186.
45. Liang GF, Lin JT, Hwang SL,et al. Evaluation and prediction of on-line main-tenance workload in nuclear power plants.Hum Factors Ergon Manuf. 2009;19:64–77
46. Holden, RJ. Cognitive performance-altering effects of electronic medical re-cords: An application of the human factors paradigm for patient safety.Cog Techno Work.2011;13:11–29.
47. Morrison L, Smith R. Hamster health care: time to stop running faster and redesign health care.Br Med J.2000;321:1541–1542.
48. Karsh BT, Holden RJ, Alper SJ,et al. Human factors engineering paradigm for patient safety: designing to support the performance of the healthcare professional.Qual Saf in Health Care.2006;15:59–65.
49. Karsh BT, Weinger MB, Abbott PA,et al. Health information technology: fal-lacies and sober realities.J Am Med Inform Assoc.2010;17:617–623. 50. Warden GL, Bagian JP.Health IT and Patient Safety: Builder Safer Systems
for Better Care. Washington, DC: Institute of Medicine, National Academies Press; 2011.
51. Stead W, Lin H. Computational Technology for Effective Health Care: Immediate Steps and Strategic Directions. Washington, DC: National Academies Press, 2009.
52. Hart SG, Staveland LE. Development of NASA-TLX (Task Load Index): Results of empirical and theoretical research. In: Hancock PA, Meshkati N,
eds., Human Mental Workload. Amsterdam: North Holland Press; 1988:139–183.
53. Hart SG. NASA-TLX Load Index (NASA-TLX); 20 years later.50th Annual Proceedings of the Human Factors and Ergonomics Society Meeting, Santa Monica, CA; 2006:904–908.
54. Beatty J, Lucero-Wagoner B. The pupillary system. In Cacioppo JT, Tassinary LG, Berntson GG, eds.Handbook of Psychophysiology. New York: Cambridge University Press; 2000;2:142–162.
55. Beatty J. Task-evoked pupillary responses, processing load, and the struc-ture of processing resources.Psychol Bull.1982;91(2):276–292. 56. Peavler WS. Pupil size, information overload, and performance differences.
Psychophysiology.1974;11:559–566.
57. Kahneman D, Beatty D. Pupillary responses in a pitch-discrimination task. Cereb Cortex.1967;2:101–105.
58. Makeig S, Bell AJ, Jung T-P,et al. Independent component analysis of electroencephalographic data. Adv Neural Inf Process Syst. 1996;8: 145–151.
59. Goupillaud P, Grossman A, Morlet J. Cycle-octave and related transforms in seismic signal analysis.Geoexploration.1984;23:85–102.
60. Gevins A, Smith ME, McEvoy L,et al. High-resolution EEG mapping of corti-cal activation related to working memory: effects of task difficulty, type of processing, and practice.Cereb Cortex.1997;7:374–85.
61. Gevins A, Smith ME, Leong H,et al. Monitoring working memory load during computer-based tasks with EEG pattern recognition methods.Hum Factors. 1998;40:79–91.
62. Smith ME, Gevins A, Leong H,et al. Monitoring task loading with multivari-ate EEG measures during complex forms of human-computer interactions. Hum Factors.2001;43:366–380.
63. Berka C, Levendowski DJ, Cvetinovic MM,et al. Real-time analysis of EEG indices of alertness, cognition, and memory with a wireless EEG headset. Inter J Hum-Comput Int.2004:17:151–170.
64. Berka C, Levendowski DJ, Lumicao MN. EEG correlates of task engagement and mental workload in vigilance, learning, and memory tasks.Aviat Space Environ Med.2007;78(5 Suppl.):B231–B244.
65. Tremoulet P, Barton J, Craven R,et al. Augmented cognition for tactical tomahawk weapons control system operators. In Schmorrow D, Stanney K, Reeves L, eds. Foundations of Augmented Cognition. Arlington, VA: Strategic Analysis; 2006:313–318.
66. Berka C, Levendowski D, Ramsey CK,et al. Evaluation of an EEG-workload model in an Aegis simulation environment. In Caldwell JA, Wesensten NJ, eds.Proceedings of SPIE Defense and Security Symposium, Biomonitoring for Physiological and Cognitive Performance during Military Operations. Orlando, FL: The International Society for Optical Engineering; 2005:90–99.
67. Berka C, Levendowski D, Westbrook P,et al. EEG Quantification of alertness: methods for early identification of individuals most susceptible to sleep dep-rivation. In Caldwell JA, Wesensten NJ, eds.Proceedings of SPIE Defense and Security Symposium, Biomonitoring for Physiological and Cognitive Performance during Military Operations. Orlando, FL: The International Society for Optical Engineering; 2005:78–89.
68. Dorneich MC, Whitlow SD, Mathan S,et al. Supporting real-time cognitive state classification on a mobile participant.J Cogn Eng Decis Making. 2007;1:240–270.
69. Mazur LM, Mosaly P, Hoyle L,et al. Relating physician’s workload with er-rors during radiotherapy planning.PRO.2013;4:71–75.
70. Henriksen K, Patterson MD. Simulation in health care: setting realistic ex-pectations.J Patient Saf. 2007;3:127–134.
AUTHOR AFFILIATIONS
...
1Department of Radiation Oncology, University of North Carolina, Chapel Hill,
NC, USA
2
Division of General Medicine, University of North Carolina, Chapel Hill, NC, USA
3School of Information and Library Science, University of North Carolina, Chapel
Hill, NC, USA