BIOPHYSICS OF CANCER PROGRESSION AND
HIGH-THROUGHPUT MECHANICAL CHARACTERIZATION OF BIOMATERIALS
Lukas Dylan Osborne
A dissertation submitted to the faculty of the University of North Carolina at Chapel Hill in partial fulfillment of the requirements for the degree of Doctor of Philosophy in
the Department of Physics and Astronomy.
Chapel Hill 2015
c O 2015
ABSTRACT
LUKAS DYLAN OSBORNE: BIOPHYSICS OF CANCER PROGRESSION AND HIGH-THROUGHPUT MECHANICAL
CHARACTERIZATION OF BIOMATERIALS. (Under the direction of Richard Superfine)
Cancer metastasis involves a series of events known as the metastatic cascade. In this complex progression, cancer cells detach from the primary tumor, invade the sur-rounding stromal space, transmigrate the vascular system, and establish secondary tu-mors at distal sites. Specific mechanical phenotypes are likely adopted to enable cells to successfully navigate the mechanical environments encountered during metastasis.
ACKNOWLEDGMENTS
While contemplating graduate school, I asked my undergraduate advisor about his opinion on UNC. I received enough initial enthusiasm to keep the school on my list and apply. Later, when a decision was needed, I asked again and showed him a list of faculty members to focus the discussion. “Superfine! With a name like this, this guy must be good!” While I can’t say the remark did much to affect any decision making at the time, when I did end up at UNC and saw Superfine on the front of a door in Phillips hall, I did wonder.
And as I sit, years later, Rich is the first person I’d like to thank. I sincerely appreciate the time and patience he has given me, the spoken and unspoken lessons, and the opportunities to learn and grow as a professional. “Learn everything you can from life’s lessons. And then move on.” That particular exchange is probably long forgotten by him, yet I applied it countless times over the years. And I like to think things turned out okay. It turns out, Superfine is pretty good.
biology. Keith, for the opportunity to spend time in his lab, learn from the pros, and the opportunity to collaborate on some incredible projects. And for always having time to sit and talk. I will miss seeing him on his morning walk with Gulliver, as I rode into work. And Gerry, for enabling so many rewarding research experiences into cancer biology, and having the patience for all of my questions.
Over the last six years, I’ve had the pleasure to work with many extraordinary and talented scientists and people. Three, in particular, have become good friends of mine and I would like to thank them next. Christophe, for teaching me the value in doing “real” experiments. Your dedication to your craft, and your genuine curiosity in all things interesting, is truly inspiring. You make difficult things look easy, and always seem to be able to smile. I’m thankful we’ve continued to stay close. UNC is not the same without you. Caitlin, for challenging me to “put in the time”. Your support and kindness have meant a great deal to me. And weekly beers with you at the Mule will undoubtedly be remembered with incredible fondness. I just wish you were a better card player. And Jeremy. For being a “source”. Graduate school would not have been the same without your patience for fielding questions over the years. Your generosity, sarcasm, and humor were a perfect mixture for the daily grind, and I appreciate the friendship we have formed.
to go to a UNC basketball game, despite having to sit in the nosebleeds. Additional thanks goes to Mythreye Karthikeyan for her mentorship, persistence, and patience through my first project. To Justin Moore. For his friendship from day one. To Kellie Bieker, your ever-present smile and unfailing optimism was greatly appreciated at the beginning of a work day. I want to thank the Panoptes group: Russ Taylor, Lea Vicci, and Joe Hsiao for the professional training; as well as past and present members of NSRG: Jay Fisher, Nathan Hudson, Lamar Mair, Rob Judith, Jerome Carpenter, Briana Fiser, Vinay Swaminathan, Ricky Spero, Ben Rardin, Ying Zhou, and Manan Parikh for all the memories.
Finally, I’d like to thank my family. Brian, for talking when I needed to listen, and listening when I needed to talk. I’m not sure I could say enough here. Thank you, big guy. My parents have loved and supported me since I can remember. So much starts right there. I am forever grateful. And to Kelsey. When I started graduate school, you most certainly ran behind me. Now, I look forward to catching back up. I also appreciate the fact that you are so rarely impressed by me. I would expect nothing less from a little sister.
TABLE OF CONTENTS
LIST OF FIGURES . . . xvii
LIST OF ABBREVIATIONS . . . .xviii
1 Introduction . . . 1
1.1 Bird’s Eye View of this Work . . . 1
1.2 Motivations and Overview of Chapters . . . 5
1.3 High-Level Observations . . . 9
2 Background: Cell Mechanics, Cancer, Methods of Measure . . . 13
2.1 Overview. . . 13
2.2 Physical Pictures in this Work . . . 14
2.2.1 Physical Picture a Bead and the Actin Cortex . . . 15
2.2.2 Physical Picture of a Bead on a Cell under Force . . . 17
2.2.3 Physical Picture of a Diffusing Bead on a Cell . . . 23
2.3 Review of Cell Mechanics . . . 27
2.4 Review of Cancer Cell Mechanics . . . 36
2.5 Rheology towards Cell Mechanics . . . 42
2.5.1 Ideal Elastic and Viscous Materials . . . 43
2.5.3 Physical Considerations in Micro-Rheology . . . 49
2.6 Active Microrheology towards Magnetic Tweezer Experiments . . . 51
2.6.1 Step Response of Ideal Elastic and Viscous Materials . . . 52
2.6.2 Step Response of Viscoelastic Materials. . . 53
2.7 Passive Microrheology towards Cell Rheology Experiments . . . 59
2.7.1 Single Particle Diffusion in Newtonian Liquids and Elastic Solids 59 2.7.2 Single Particle Diffusion in Viscoelastic Materials . . . 62
2.7.3 Heterogeneity observed in PBR Cell Experiments . . . 64
2.8 Comparison of Moduli Derived from Microrheology and other Methods 65 3 Advances to Magnetic Tweezer Methods . . . 67
3.1 Overview. . . 67
3.2 Magnetic Tweezers and Cell Mechanics . . . 69
3.3 Improved Selection Criteria for Cell Mechanics Experiments . . . 71
3.4 Can Cells Distinguish between Constant and Pulsatile Forces? . . . 73
3.5 Design of the Rotating Magnet Device . . . 74
3.6 Design of the Constant versus Pulsatile Mechanical Force Experiment . 81 3.7 Pulsatile Mechanical Force Enhances ERK and RhoA Activation . . . . 83
3.8 Pulsatile Mechanical Force Enhances Basal Focal Adhesions . . . 87
3.9 Discussion . . . 90
4 Novel Applications of Microrheology to Cell Mechanics . . . 92
4.1 Overview. . . 92
4.3 Isolated nuclei exhibit a stiffening response to external force . . . 101
4.4 LARG activates RhoA to affect stiffening response to force on ICAM-1 104 4.5 HIF1α and HIF2α are sufficient to promote cancer phenotypes . . . 106
5 Cell Mechanics and the Epithelial to Mesenchymal Transition . . . 108
5.1 Overview. . . 108
5.2 The metastatic cascade and EMT . . . 110
5.3 TGF-β induced EMT alters stiffness and stiffness response to force . . 113
5.4 Comparison of Cell Stiffness from Active and Passive Approaches . . . 120
5.5 RhoA GEF expression and recruitment is lost after EMT . . . 122
5.6 TGF-β regulates Rho GEF expression during EMT . . . 125
5.7 Epithelial-state cells partially adopt post-EMT phenotypes . . . 129
5.8 Mesenchymal-state cells recover epithelial-state phenotypes . . . 133
5.9 Conclusions and signaling model . . . 136
5.10 What is the utility of reduced stiffness and stiffness response? . . . 140
6 A High Throughput Array Microscope . . . 143
6.1 Overview. . . 143
6.2 The Need for High Throughput Mechanical Measurements in Biology . 145 6.3 Array Microscope: Design, Hardware, and Software . . . 147
6.3.1 Optics and Imaging Block . . . 150
6.3.2 XY-calibration of Liquid Lens . . . 152
6.3.3 AHT Data Collection and Analysis . . . 154
6.3.5 Objective Qualification for the Array Microscope . . . 162
6.4 Validation of AHT Microscope: Microrheology of Viscosity Standards . 165 6.5 Conclusions . . . 168
7 Towards High-Throughput Cancer Cell Mechanics. . . 169
7.1 Overview. . . 169
7.2 The Need for High Throughput Cell Mechanics in Cancer Community . 173 7.3 The AHT System meets the Current Needs . . . 175
7.4 Oncogenic Gain of Function Library and Preliminary Results . . . 177
7.5 Automated Motion Model Selection for MSD Trajectories . . . 183
7.5.1 Bayesian Approach to MSD Model Analysis . . . 187
7.5.2 Wrapper for Implementing MSD Model Selection . . . 190
7.5.3 Analysis of Cell and AHT Noise Floor Data . . . 194
7.6 HT Cell Mechanics Assays test Effect of Gain of Function Constructs . 198 7.7 Future Directions . . . 202
A Magnetic Tweezer Instrumentation and Calibration . . . 206
A.1 Instrumentation and Force Calibration . . . 206
A.2 Data Analysis Recipe for Magnetic Tweezer Experiments . . . 210
B Improved Selection Criteria for 3DFM Experiments . . . 213
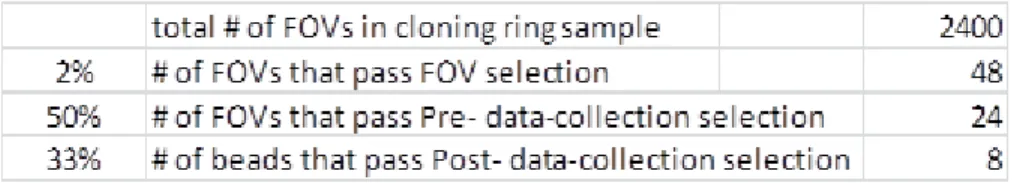
B.1 Field of view (FOV) selection . . . 214
B.2 Pre- data-collection selection. . . 215
B.3 Post- data-collection selection. . . 216
B.3.2 Beads that detach from cells . . . 218
B.3.3 Directed membrane drift . . . 219
B.3.4 Broken bead-cell attachment . . . 220
B.3.5 Anchorage displacement . . . 221
B.3.6 Broken bead-cell attachment and anchorage displacement . . . . 222
B.3.7 Viscoelastic response . . . 223
B.3.8 Viscoelastic cell stiffening response . . . 224
B.3.9 Viscoelastic cell softening response . . . 226
C Scaling of Hoffmann 2006 PBR Data . . . 228
D Protocols. . . 230
D.1 High Throughput Cell Rheology Assay . . . 230
D.2 Gain of Function Construct Preparation Protocol . . . 232
D.3 Invasion Assay Protocol . . . 233
E Bayesian Approach to MSD Model Probability . . . 234
F Gain of Function Construct Validation . . . 237
LIST OF FIGURES
Figure1.1 – Cellular Mechanotransduction . . . 2
Figure1.2 – Passive and Active Microrheology . . . 3
Figure1.3 – Local signaling in the cortical actin . . . 7
Figure1.4 – Summary of 3DFM Experiments. . . 12
Figure2.1 – Microbead in context of cortical actin cytoskeleton . . . 14
Figure2.2 – Summary of magnetic tweezer data . . . 19
Figure2.3 – Hypothesized physical picture of bead under force . . . 22
Figure2.4 – Hypothesized physical picture of a passively diffusing bead . . . 26
Figure2.5 – The nanoscale structure of focal adhesions . . . 30
Figure2.6 – The RhoA mechanoresponse pathway . . . 32
Figure2.7 – Comparison of cell mechanics methodologies . . . 35
Figure2.8 – The metastatic cascade . . . 37
Figure2.9 – Basic deformation geometries for corresponding stresses . . . 43
Figure2.10 –Typical bead response to a step stress . . . 52
Figure2.11 –Summary of mechanical circuit models . . . 58
Figure2.12 –Heterogeneity of a typical (automated) PBR experiment . . . . 64
Figure2.13 –Comparison of shear moduli across methods . . . 66
Figure3.1 – Selection criteria statistics . . . 72
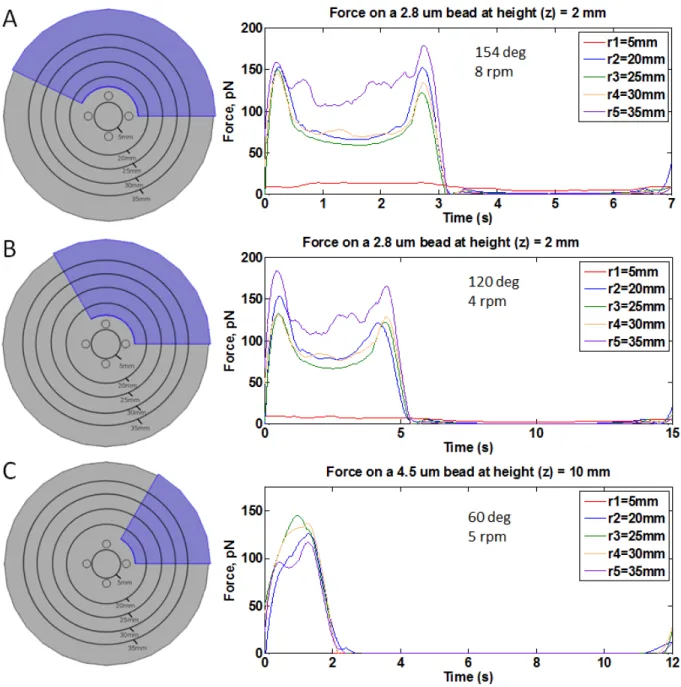
Figure3.2 – The rotating magnet device . . . 75
Figure3.3 – Simulated magnetic flux density in context . . . 77
Figure3.4 – Pulsatile force generated by rotation of permanent magnet . . . 79
Figure3.6 – Constant and pulsatile magnet assay configurations . . . 82
Figure3.7 – Pulsatile mechanical force enhances Erk activation . . . 84
Figure3.8 – Pulsatile mechanical force enhances RhoA activation . . . 85
Figure3.9 – Pulsatile force enhances growth of focal adhesions . . . 88
Figure3.10 –Pulsatile force increases focal adhesion number and size . . . 89
Figure3.11 –Model of PECAM-1-mediated mechanotransduction . . . 89
Figure4.1 – ECM composition determines response to force on PECAM-1 . 96 Figure4.2 – Experimental setup for mechanical characterization of aortic ECs 97 Figure4.3 – Imaging through layers of aortic tissue . . . 98
Figure4.4 – The PKA pathway promotes EC compliance in the aorta . . . . 100
Figure4.5 – Isolated nuclei exhibit a stiffening response to force . . . 102
Figure4.6 – Increased stiffness in response to force on nuclei . . . 103
Figure4.7 – LARG regulates the stiffness response to force on ICAM-1 . . . 105
Figure4.8 – HIFs are sufficient to alter cell invasion and stiffness . . . 107
Figure5.1 – The metastatic cascade and EMT . . . 111
Figure5.2 – Structural change associated with EMT. . . 114
Figure5.3 – Mechanical assay and modeling of cell stiffness . . . 115
Figure5.4 – NMuMG stiffness and stiffness response during EMT . . . 116
Figure5.5 – PANC-1 stiffness and stiffness response during EMT. . . 117
Figure5.6 – PDL coated beads and integrin expression . . . 118
Figure5.7 – PBR assay of cells before and after EMT . . . 121
Figure5.8 – Comparison of magnetic tweezers and PBR . . . 121
Figure5.10 –The rotating permanent magnet probes EMT mechanics . . . . 123
Figure5.11 –LARG and GEF-H1 recruitment to adhesion complex . . . 124
Figure5.12 –ALK5 inhibitor blocks EMT-mediated decrease in GEFs . . . . 127
Figure5.13 –Proteasome degradation of LARG and GEF-H1 during EMT . . 128
Figure5.14 –GEF knockdown experiments . . . 132
Figure5.15 –GEF overexpression experiments. . . 135
Figure5.16 –Interaction of signaling pathways . . . 139
Figure6.1 – The array high-throughput (AHT) microscope . . . 149
Figure6.2 – The optical system of the (AHT) microscope . . . 151
Figure6.3 – Liquid lens provides voltage tunable z-focus . . . 153
Figure6.4 – Data collection and analysis workflow . . . 156
Figure6.5 – Noise floor for the AHT Prototype Microscope . . . 160
Figure6.6 – Comparison of noise floors and limits of measure . . . 161
Figure6.7 – Performance tests for liquid lens installed objectives . . . 164
Figure6.8 – AHT system caracterization of standard Newtonian fluids . . . . 167
Figure6.9 – Time saved with the AHT Microscope . . . 168
Figure7.1 – Paramters from the EMT study in context . . . 172
Figure7.2 – Pathology phenotypes that lead to cancer cell invasion . . . 174
Figure7.3 – HPNE cells are KRAS-transformed HPDE cells . . . 178
Figure7.4 – Average invasiveness for HPDE (DE) and HPNE (NE) cells . . 179
Figure7.5 – Mechanical characterization of the HPDE and HPNE cells . . . 180
Figure7.6 – Constructs increase invasion capacity of HPDEs . . . 181
Figure7.8 – MSD motion models for diffusive behavior . . . 185
Figure7.9 – Workflow of the Bayesian MSD analysis. . . 191
Figure7.10 –Validation of theMSD-based Bayesian analysis . . . 192
Figure7.11 –Typical MSD trajectory for a bead attached to a cell . . . 193
Figure7.12 –MSD model selection applied to cell mechanics data . . . 195
Figure7.13 –Assessment of cell mechanics data . . . 197
Figure7.14 –Effect of constructs on mechanics of pancreatic cells . . . 199
Figure7.15 –AHT assay predicts loss of construct expression . . . 201
Figure7.16 –Binning HT mechanical assay results . . . 203
Figure7.17 –Workflow for a high throughput mechanical screen . . . 205
FigureA.1 –3DFM lid with pole-flat geometry . . . 208
FigureA.2 –Force calibration of the 3DFM . . . 209
FigureA.3 –Active microrheology to cell mechanics workflow . . . 212
FigureB.1 – Selection criteria statistics . . . 213
FigureB.2 – FOV selection . . . 214
FigureB.3 – Stuck bead. . . 217
FigureB.4 – Beads that detach from cells . . . 218
FigureB.5 – Directed membrane drift . . . 219
FigureB.6 – Broken bead-cell attachment . . . 220
FigureB.7 – Anchorage displacement . . . 221
FigureB.8 – Broken attachment and anchorage displacement . . . 222
FigureB.9 – Viscoelastic response . . . 223
FigureB.11 –Cell stiffening response (ex. 2) . . . 225
FigureB.12 –Cell softening response (ex. 1) . . . 226
FigureB.13 –Cell softening response (ex. 2) . . . 227
FigureC.1 –Scaling of Hoffmann 2006 PBR data . . . 229
FigureD.1 –Protocol for Wood library gain of function constructs . . . 232
FigureF.1 – Initial validation of the gain of function constructs . . . 238
LIST OF ABBREVIATIONS
3DFM 3 dimensional force microscope AHT array high throughput
BMP bone morphogenetic protein EC endothelial cell
ECM extracellular matrix
EMT epithelial to mesenchymal transition
FN fibronectin
PBR passive bead rheology
Chapter 1: Introduction
1.1 Bird’s Eye View of this Work
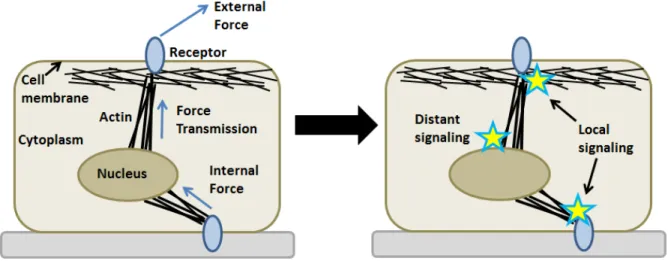
Cells live in a dynamic mechanical environment. Throughout the body, cells expe-rience external forces. For example, cells of the skeletal system expeexpe-rience compressive stress from body weight and cells of the vascular system experience shear stress due to blood flow. Cells receive these forces via mechanosensitive receptors at the cell sur-face. In turn, these receptors relay force information throughout the cell by tranduction into biochemical signals, a process called mechanotransduction. Before transduction, forces can be relayed directly to distant sites (e.g. the nucleus or cell-cell junctions) through transmission across cytoskeletal networks. In addition to exposure of external forces, cells can also exert force on other cells or their environment through actomyosin-contraction on mechanosensitive receptors. The deformation of a cell in response to a force depends on the viscoelastic properties of the cell. The schematic in Fig. 1.1
illustrates these transduction concepts.
The investigation of cell mechanical properties is the study of viscoelastic material properties and cell-generated force. Currently, the interdisciplinary field ofcell mechanics attempts to answer 4 primary questions:
Figure 1.1: Cellular mechanotransduction of external and cell-generated forces. The most important physical structures for our considerations are also shown: cell membrane, cytoplasm, nucleus, apical and basal receptors, actin cytoskeleton.
differentiation, division) and cell behavior (e.g morphology, migration)?
2. How do mechanical properties change in response to chemical (e.ggrowth factors) and mechanical signals (e.g forces and environment stiffness)?
3. By what molecular mechanisms are forces transduced? (i.e. which molecules are strained, or experience conformation change?)
4. How are mechanical properties altered during complex disease states such as atherosclerosis or cancer?
The work in this dissertation contributes to the first, second, and fourth questions, mostly in the context of cancer progression. Although our experiments (presumably) induce molecular level strains, our methods probe larger length scales and hence are not designed to contribute the third question above.
Figure 1.2: Passive bead rheology (PBR) and active bead rheology (magnetic tweezers) probe the cell membrane, adhesions, and cortical actin cytoskeleton through thermal energy and external force, respectively.
the microbead approaches and the bead to cytoskeleton connection.
For active and passive techniques, bead displacement reflects a composite material consistenting of the cell membrane, adhesion-actin linkage, and the cortical actin cy-toskeleton (discussed further in Sec. 2.2). Because these bead-based methods average over many receptor connections and are insensitive to molecular level strains (defor-mations), we parameterize our data with continuum rheological models to determine viscoelastic properties (G, η). We use magnetic tweezers to characterize viscoelastic properties, and to study how these properties change when a cell experiences pulses of force. The low-technology overhead of PBR allows us to characterize viscoelastic properties of cells in automated high throughput experiments.
1.2 Motivations and Overview of Chapters
As mentioned above, cellular mechanical properties are increasingly being impli-cated in the progression of many diseases. However, the molecular mechanisms that regulate or dysregulate disease progression are not well understood. To this end, the primary focus of this work was in elucidating the molecular connection between cel-lular mechanical properties and cancer cell invasiveness. Previous work by our group and others have shown that, compared to normal or non-invasive cells, highly invasive cancer cells have a reduced stiffness and exert larger forces on their environment. In an attempt to capture both mechanical and biochemical properties during inducible cancer progression, I turned my attention to the epithelial to mesenchymal transition (EMT). EMT is a well characterized process in embryogenesis and wound healing, and recently has been implicated as a model for the physical detachment of cancer cells before they begin to metastasize. Thus, my work was first motivated with the follow questions:
1. Is there a mechanical phenotype adopted during EMT?
2. If so, what are the biochemical mechanisms responsible for the alternations in cell mechanics?
evidence showing cellular mechanical properties have been correlated with cancer in-vasiveness. I continue in Chapter 2 to discuss continuum models of rheology towards characterization of cell mechanical properties from active and passive microbead rhe-ology experiments.
In Chapter 3 (and related Appendices A, B), I discuss how cell mechanics can be studied using magnetic systems. I briefly review magnetic tweezers as an instrument to apply force to cells. Then, in order to maintain consistency across experiments, I describe improvements to the methodology of magnetic tweezers in the context of cells mechanics (an improved data selection criteria). Finally, I discuss the design and characterization of a novel device aimed to study cellular biochemistry in response to pulsatile force regimens. We examine the effect of pulsatile mechanical force on endothelial cells by applying external force on the mechanosensor platelet endothelial cell adhesion molecule (PECAM)-1.
experiments that examine the effect of hypoxia-inducible factor (HIF) on the stiffness and invasiveness of melanoma cancer cells. The work in this chapter references four peer-reviewed publications; my contributions to these studies are described in Chapter
4.
Figure 1.3: (Left) Before and after induced cancer progression, passive and active mi-crobead rheology probe the cell membrane and cortical actin cytoskeleton through ther-mal energy and external force, respectively. (Right) Force from magnetic tweezers or rotating permanent magnet activates local signaling at the cortical actin cytoskeleton.
illustrates this transduction concept.
Although significant, results from Chapters 3, 4, and 5 were obtained from a series of low throughput, manually performed experiments testing a small number of environ-mental conditions or genetic manipulations. In general, the technical overhead and time constraints of manual experiments limit the extent of assayed conditions and the ability to test the ubiquity of findings by examining additional cell lines and model systems. A complete understanding of the connection between cellular mechanical properties and physiology/disease will require advances in instrumentation that enable parallelized, high throughput assays capable of probing complex signaling pathways, studying bi-ology in physiologically relevant conditions, and capturing heterogeneity within cell populations. To address this motivating instrumentation need, in Chapter 6, I describe the development and testing of a high throughput microscope designed to characterize the viscoelastic propertials of biomaterials and cells.
1.3 High-Level Observations
In an effort to prepare the reader for ideas and conclusions presented in this work, the following observations are compiled. See links for further discussion.
1. Cells can distinguish between constant and pulsatile mechanical forces. We developed a rotating permanent magnet device that applies pulsatile force to cells before biochemical analysis. Within 2 min of force on apical PECAM-1 (mechanosen-sor in endothelial cells), we find enhanced ERK1/2 and RhoA activation, and an increase in the number and size of basal focal adhesions. (Ch. 3)
2. Mechanical response to force depends on the bead-cell attachment. Re-peated pulses of force on PDL-coated beads (targeting non-specific attachment based on charge) does not increase stiffness . In constrast, repeated pulses of force on FN-coated beads induces a stiffening response within 1 min (FN targets attachment to actin via mechanosensitive proteins). (Fig. 5.6)
3. Cells integrate ECM biochemistry and mechanical cues to modulate me-chanical properties. Endothelial cells plated on FN-coated substrates exhibit a stiffening response to force, whereas on CL-coated substrates no response is observed. Evidence of this integration occuring in vivo is also observed. (Sec. 4.2)
is observed with endothelial cells (Fig. 3.8: 3-fold increase; 100 pN of force at 2 sec on, 10 sec off). RhoA is a protein that regulates the actin cytoskeleton.
5. Integrin, PECAM-1, ICAM mechanotransduction involve RhoA protein. Force application on integrins (Fig. 5.5), PECAM-1 (Sec. 3.7), and ICAM-1 (Sec.
4.4) activate RhoA. The activation of RhoA leads to increased cell stiffness.
6. Active and passive microbead approaches reveal similar trends in cell stiffness. Stiffness measurements determined with magnetic tweezers and PBR have established the same relationship between conditions for cells before and after EMT (Fig. 5.8), and between melanoma cells of varying invasiveness (Fig. 4.8).
7. An altered mechanical phenotype appears to be hardwired into cancer progression. We have shown that stiffness and stiffness response are decreased after EMT (a model for cancer progression). These mechanical changes are regulated by proteasomal degradation of RhoA activators LARG and GEF-H1. Loss of LARG and GEF-H1 increase cell migration and invasion. (Ch. 5)
8. Our developed high throughput microscope accurately measures viscosity standards. All 12 channels statistically distinguished between 4 Newtonian fluid standards: water (η= 0.84 mPa s), 2.04 M sucrose (η= 20.0 mPa s), 2.5 M sucrose (η = 83.1 mPa s), and corn syrup (η = 2840 mPa s). At the plate level, the system measures water, 2.04 M and 2.5 M sucrose with less that 5.5% error. (Sec. 6.4)
Manual execution of 96 well experiments (5 video per well), such as the standards experiment above, would take over 90 hours. On our high throughput microscope this experiment would take 2.2 hours, all of which is unattended. A cell rheology experiment of this size would take 3.2 hours (Ch. 6, Sec. 6.5).
10. A modeling procedure has been implemented to identify subpopulations in high throughput data. Towards assay optimization, our goal was to separate subpopulations within MSD data with an approach that penalizes model complex-ity and enables model competition based on relative probabilities. We implemented a Bayesian analysis procedure and have shown: 1) successful separation of simu-lated heterogeneous datasets (Fig. 7.10), 2) like-model comparisons between cell conditions within a high throughput cell mechanics assay (Fig. 7.14).
11. Our high throughput PBR assay has identified 3 oncogenes that decrease cell stiffness. Our results demonstrate that 3 of 4 tested oncogenes (H-Ras, myr-AKT, and Bcl-2) promote decreased stiffness towards that of a cancer mechanical phenotype define by KRAS transformed cells (Fig. 7.14).
Summary of magnetic tweezer experiments in this work: Fig. 1.4. To compare our forces to physiological stresses in the literature, we estimate the stress: σ=F/(πr2c) where rc is the contact radius. For 2.8 µm and 4.5 µm beads we assume rc = 0.7 µm
andrc= 1µm, respectively. While we assume a uniform contact area in estimating the
Figure 1.4: Summary of magnetic tweezer experiments. EMT cancer study: Ch.
Chapter 2: Background: Cell Mechanics, Cancer, Methods of Measure
2.1 Overview
2.2 Physical Pictures in this Work
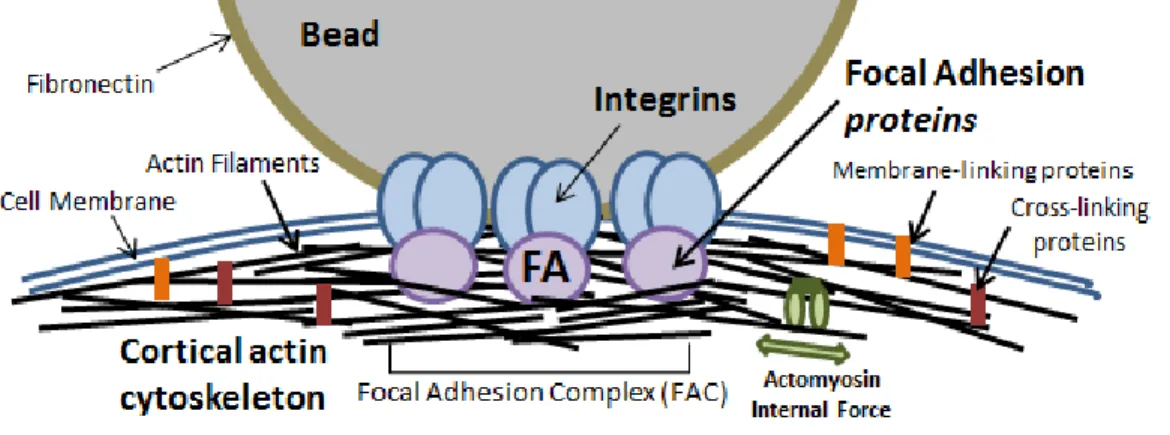
For the majority of experiments in this work (Ch. 5,7), beads are coated with fibronectin (FN) to specifically bind integrin receptors on the cell surface. Inside the cell, integrins are anchored to the cortical actin cytoskeleton through focal adhesion (FA) protein structures (conceptualized in Fig. 2.1).
In the following three subsections, we will describe 1) how microbeads are coupled to the cortical actin cytoskeleton (Sec. 2.2.1), 2) mechanotransduction and a hypothe-sized physical picture for a cell-attached bead under external force (Sec. 2.2.2), and 3) a hypothesized physical picture for a bead diffusing due thermal energy (Sec. 2.2.3). These physical pictures are developed using a combination of community findings, re-sults from this work, and speculation. The schematics presented in Fig. 2.3, and 2.4
will be used to illustrate magnetic tweezer and PBR experiments in Ch. 5,7.
2.2.1 Physical Picture a Bead and the Actin Cortex
2.2.2 Physical Picture of a Bead on a Cell under Force
The leading hypothesis in cellular mechanotransduction is that sensitivity to me-chanical stimulation derives from molecular rearrangements. Under force, mechanosen-sitive proteins are rearranged either by binding-induced conformational changes (al-losteric regulation) or strain-induced unfolding (conceptualized in Fig. 2.3 A,B,C). For example, in the context of integrin mechanotransduction, force-dependent unfolding of the FA protein talin (∼5 pN) results in exposed binding sites for the protein vin-culin (Yao et al., 2014). In turn, vinculin regulates the binding of actin filaments to strengthen the FA (Rio et al., 2009)(Ciobanasu et al., 2014). Other studies have shown that vinculin is required for FA stablization under force, and that a single vinculin protein supports∼ 2.5 pN of tensional force in stable FAs (Grashoff et al., 2010).
Additionally, activators of the protein RhoA – a key regulator of the actin cortex – are known to associate with FA proteins and actin, and are specifically recruited to adhesions during force application (Guilluy et al., 2011)(Osborne et al., 2014). Down-stream biochemical signaling of RhoA leads to actin stabilization, polymerization, and actomyosin contractility (Lessey et al., 2012). The end result of mechanical stimulation is a stronger coupling between FAs and actin and a more mature cortical actin network (conceptualized in Fig. 2.3 D). Focal adhesions, mechanotransduction, and the RhoA signaling pathway will be discussed in more detail in Sec. 2.3.
displacement reflects the strain of the cell; typical bead displacements are on the order of 0.5-1 µm. This displacement excludes the possibility that the observed strain is due to a single protein (∼ 1-10s nm). Additionally, experiments (discussed below) with different bead ligands suggest that the bead “tether” is not contributing to the strain. We suspect the observed strain resulting from a bead under force is likely distributed as deformation of the cell membrane, integrins and FAs, and the cortical actin cytoskeleton. However, the relative strains across each of these components is not known.
Stiffness within magnetic tweezers methodology: Bead displacement from the first pulse of force enables us to determine a stiffness of the cell. The majority of stiff-ness values determined by magnetic tweezers in this work areG= 0.5-2 Pa (FN-coated beads; Ch. 5). This range of stiffnesses is in reasonable agreement with other stud-ies using magnetic tweezers and FN-coated beads to apply force to integrins of many different cell types (Fig. 2.2). We suspect our measurement of stiffness is reflective of a composite material consisting of the cell membrane, integrins and FAs, and the maturation of the actin cortex. To study the effect of the later contribution, Matthews et.al. disrupted the actin cortex with 3 modulators which affect actin through distinct mechanisms (ROCK inhibitor, RhoA inhibitor, myosin ATPase inhibitor). These mag-netic tweezer experiments revealed a 2-fold increase in bead displacement under force on integrins compared to untreated cells (indicative of a reduced stiffness) (Matthews et al., 2006).
Figure 2.2: Comparison of FN-integrin determined cell stiffness and stiffness response measurements using magnetic tweezers. All studies used FN-coated beads to attach to integrin receptors (Matthews et al. used RGD-coated beads, main sequence in FN). The applied forces were between 40-130 pN.
*The provided stiffness response range is the maximum for control conditions where a response was observed; some of the tested conditions reduced or elimated the observed stiffness response in the control conditions. The pulse number at which a stiffening repsonse is observed varies between studies. Many studies measured the “relative dis-placement” of the bead as opposed to the stiffness response; in these cases, “30%” refers to a reduction of bead displacement which we approximate here to be an increase in stiffness.
epithelial cells, we assessed cell stiffness using poly-D-lysine (PDL)-coated beads which target non-specific attachment to the cell based on charge. In these experiments, PDL-coated beads yield the same initial stiffness as FN-PDL-coated beads (Fig. 5.6A). However, under repeated pulses of force on PDL beads, no stiffening response is observed; in con-trast, repeated pulses of force on FN beads induces an increase in cell stiffness (Fig. 5.6
B). These results suggest PDL beads may probe the actin cortex through membrane-cortex linkages, whereas FN beads probe the membrane-cortex through FAs. Additionally, these findings are consistent with Ac-LDL-coated beads (targeting non-integrin cell attach-ment) envoking enhanced cortical actin localization but not recruiting mechanosensitive FA proteins (Plopper and Ingber, 1993). In this model, the presence of the actin cortex would establish a cell stiffness, but the lack of force-sensitive proteins would prevent a mechanoresponse.
Stiffness Response within magnetic tweezers methodology: We determine the stiffening response of a cell by applying repeated force pulses and normalizing later stiffness values to the stiffness observed during the first pulse. For most of the exper-iments in this work, epithelial cells exhibit an increase in stiffness of approximately 20-30% (FN-coated beads; Ch. 5). Figure 2.2 compares how the stiffness response to force on integrins varies with cell type.
cytoskeleton (Tolbert et al., 2013). Studies testing the bundling ability of vinculin have shown that a 50% stiffness response observed in cells with wildtype vinculin is completely lost when Vt-Vt binding is prevented (Shen et al., 2011). These results suggest that vinculin-mediated actin bundling is necessary for a stiffness response to force on integrins.
As a cell transduces repeated pulses of force, the RhoA activators LARG and GEF-H1 are specifically recruited to the FA complex (Guilluy et al., 2011)(Osborne et al., 2014). Although experiments have not yet revealed what structures RhoA activators or their upstream regulators bind to, it is possible that these signaling proteins bind to vinculin or actin. Experiments in this work using epithelial cells show that within 1 min of force application, LARG and GEF-H1 are recruited 2-3.5-fold more than without force, and within 2 min, this increase can be as high as 6.5-fold (Fig. 5.11). We suspect LARG and GEF-H1 activate RhoA in regions local to the site of force application. Although our observations of active RhoA in response to force reveal a 2-fold increase over the no force control (limited to non-localized measurements; Fig. 5.11), we suspect active RhoA is even more abundant at the the site of force application. Within this model, RhoA regulates the maturation and organization of the actin cortex to resist deformation from external forces.
2.2.3 Physical Picture of a Diffusing Bead on a Cell
Stress and strain within PBR methodology: In passive bead rheology (PBR) of cells, thermal energy imparts shear stress to cells (conceptualized in Fig. 2.4A). Similar to magnetic tweezers, we suspect passive bead displacement reflects the strain of the cell. Although this strain is likely distributed as deformation of the cell membrane, integrins and FAs, and the cortical actin cytoskeleton, the distribution across these components may be different than it is for magnetic tweezers.
Stiffness within PBR methodology: Generally, the measured stiffness for cells using PBR in this work (G= 0.1-1 Pa) is on the same order as the stiffness determined by magnetic tweezers (G= 0.5-2 Pa), and in many cases, we identify the same trends between cell conditions using both approaches. This observation is consistent with FN-coated beads inducing the recruitment of integrins, FA proteins, and cortical actin filaments upon attachment (no applied force) (Plopper and Ingber, 1993).
select only strong bead-cell attachments. Bead-cell binding variability would result in PBR measuring a lower effective stiffness compared to magnetic tweezers. Second, cells are known to exhibit linear and nonlinear mechanical responses (i.e. the stress-strain relationship is linear or nonlinear) (Kollmannsberger and Fabry, 2011). Typical RMS displacements of beads in PBR are 30-50 nm, whereas typical bead displacements with magnetic tweezers are on the order of 0.5-1 µm. Therefore it is possible that PBR and magnetic tweezers probe the stiffness of the cell in different rheological regimes and that the observed differences in stiffness are because cells strain-stiffening. As such, PBR may be more sensitive to interactions between FA proteins and actin filaments. In contrast, because of the larger strains involved with magnetic tweezers, beads under a driven force may experience the cross-linking of actin filaments within the cortex and therefore experience a greater stiffness. Third, PBR may not measure biochemically enhanced cell stiffness. Although we currently do not have evidence to suggest the force delivered within a single magnetic tweezer pulse induces biochemical signaling to increase the measured stiffness, if it did and this threshold force was not achieved by thermal energy (or was not achieved as often), one could imagine that PBR would measure a lower effective stiffness.
In Sec. 5.4, we compare the effective stiffness determined by PBR and magnetic tweezers for two cell conditions.
For short timescales, the trajectory of an external bead appears diffusive, potentially reflective of diffusion of integrins within the membrane or FA proteins diffusing withing a cage of the actin cortex mesh. The later possibility is conceptualized in Fig. 2.4 B and illustrated by the red region of Fig. 2.4 D. It is important to note to that “FA” in Fig. 2.4 A,B,C is meant to describe individual proteins or collections of proteins that compose the total focal adhesion structure. The area of a the total focal adhesion complex can be several microns in size.
For timescales between 0.1 ms and 1 sec, the trajectory of an external bead appears subdiffusive (Fig. 2.4 C and green region of D). Although the origin of this viscoelastic response is not known, a possible contribution is increased interaction of FA proteins with actin filaments, potentially because of binding to or bending of actin filaments. Our PBR data is taken within this timescale range (30 ms to 1 sec) and the observed RMS displacement of beads at the 1 sec timescale is 30-50 nm (Ch. 7). Because the average mesh size of the actin cytoskeleton is 20-50 nm (Wirtz, 2009)(Hale et al., 2009), our data may reflect the interaction of FA proteins with actin filaments (FA proteins are coupled through their respective connection with the bead as in Fig. 2.4
C). Additionally our data is consistent with (scaled) external PBR measurements from Hoffmann et. al at the 1 sec timescale. To make this comparison, we performed a volumetric-scaling (4.5µm / 2µm) of the MSD from (Hoffman et al., 2006) to account for the difference in bead size (Appendix Fig. C.1).
Figure 2.4: Hypothesized physical picture of a passively diffusing bead at-tached to a cell. (A) Side-view cartoon showing a bead attached to the cortical actin cytoskeleton through integrins and focal adhesion (FA) proteins. For simplicity, many proteins are not shown. (B,C) Top-view cartoon showing FA proteins coupled through their respective connection to the bead (B) diffusing within the cortical actin mesh (red arrow) and (C) anomalously due to interaction with actin (green). Some degree of attachment to actin is assumed. (D) MSD vsτ data for external PBR. Data from 4.5
2.3 Review of Cell Mechanics
Cells are a highly complex composite materials consisting of many molecules, pro-teins, and compartments. Mechanically, cellular structure is provided by the cytoskele-ton, which in humans, consists of and is regulated by thousands of different proteins (Venter et al., 2001). The cytoskeleton of eukaryotic (nucleated) cells is composed of three distinct polymer systems: microtubules, intermediate filaments, and actin fil-aments. These networks give rise to cellular mechanical properties, allow a cell to withstand the impact of external forces, and enable the cell to exert forces on its envi-ronment. Despite using a significant portion of its metabolic energy to assemble these networks, cells are constantly disassembling and reassembling these structures. This constant remodeling of the cytoskeleton enables a cell to contraction, move, divide, and change shape. During these processes, the mechanical properties of a cell are al-tered dynamically. In this section, we will review cell mechanics from the following perspectives:
1. forces in biology: cell experience and exert forces in a variety of contexts
2. physical structure: the actin cytoskeleton and focal adhesions
3. mechanotransduction: mechanotransmission, mechanosensing, mechanoresponse
4. implications of mechanotransduction to disease states
Cells are constantly experiencing and exerting mechanical forces. Endothe-lial cells lining blood vessels and epitheEndothe-lial cells lining tissue cavities experience shear stresses from the movement of fluid over the cell surface (Jalali, 2001)(Chachisvilis et al., 2006) and tensional force from neighboring cells within the endo- or epithelium (Tzima et al., 2005)(Collins et al., 2012). Osteoblast and chondrocyte cells, which make up the bone and cartilage component of the skeletal system, are constantly under compression forces during body-level activities such as walking or running. Cells also actively exert mechanical forces on their surroundings. Smooth muscle cells generate contractile forces within the vascular system to pump blood and exert force on tendons and bones during general muscle contraction. Fibroblast cells also generate contractile forces on the ECM in order to remodel connective tissue and migrate during wound healing.
Figure 2.5: The nanoscale structure of focal adhesions. Focal adhesions are pro-tein complexes that have structural and signaling roles within a cell. Figure republished from (Kanchanawong et al., 2010) with permission from Nature.
Mechanotransduction is the conversion of physical stimuli into biochemical signals within the cell. As a canonical example, hair cells in the inner ear have mechanosensitive organelles called stereocilia that convert changes in fluid pressure due to sound waves into biochemical signals that ultimately relay information to the auditory nerve (Vollrath et al., 2007). Mechanotransduction can be divided into three subprocesses: 1) mechanotransmission, 2) mechanosensing, and 3) mechanoresponse.
1. Mechanotransmission: Before a mechanical stimuli can be sensed or responded to, transmission of the mechanical signal must occur. Transmission of mechanical cues can occur through adhesion proteins or the cytoskeleton (Hoffman and Crocker, 2009). Mechanical propagation allows for cellular responses to force to be on the order of several hundred milliseconds, much faster than what diffusion of soluble factors would allow (Wang et al., 2009).
proteins to induce various biological consequences. For example, tensional forces in the cellular plamsa membrane during osmotic swelling cause conformational changes in ion channels that allow passage of ions and enable the cell to survive under dy-namic osmotic conditions (Arnadottir and Chalfie, 2010). Another example involves mechanosensing of proteins in focal adhesions. Talin is an adhesion protein in the force transduction layer of focal adhesions (Fig. 2.5). Vinculin serves as the con-nection between talin and actin filaments. Initially, however, many of the binding sites of vinculin on talin are inaccessible. When force is tranmitted to talin, induced strains expose these crytic binding sites and allow for vinculin recruitment and actin connection (Rio et al., 2009)(Thompson et al., 2014).
Figure 2.6: The RhoA mechanoresponse pathway. A combination of biophysical and biochemical techniques were used by (Guilluy et al., 2011) to reveal two regulatory pathways of stiffness response when cells are subjected to externally applied force on integrins.
Mechanotransduction is implicated in disease states. Because of the ubiquity of mechanical forces in biological systems, it may not be a surprise that mechanotrans-duction is involved in many disease states (Jaalouk and Lammerding, 2009), including osteoporosis, muscular dystrophy, hypertension, myopathies, and atherosclerosis. For example, in the vascular system, atherosclerosis (chronic inflammation of vessel walls) occurs more frequently in regions where turbulent blood flow cause significantly var-ied stresses (magnitude and temporally) across cell surfaces compared to laminar flow conditions. We will investigate this phenomena in Chapter 4.
of cancer cell mechanics will be given in the next section (Sec. 2.4).
et al., 2005); magnetic twisting cytometry (Fabry et al., 2001)(Deng et al., 2006); mag-netic tweezers ; external/internal passive microbead rheology (PBR) (Hoffman et al., 2006)(Hale et al., 2009)(Wu et al., 2012a); atomic force microscopy (Alcaraz et al., 2003)(Hiratsuka et al., 2009); traction force microscopy (Paszek et al., 2005)(Liu et al., 2013); and hydrodynamic stretching (Dudani et al., 2013)(Gossett et al., 2012).
From Fig. 2.7, we see that most cell mechanics techniques measure the cell mem-brane, adhesions, and the cortical actin cytoskeleton due to external interaction with the cell. Although Gossett et.alhave extended measurement throughput to 2000 cells/sec, these experiments are performed on non-adherent cells, and therefore limit the direct biological relevance of their determined mechanical properties to specific situations (e.g. circulation within the vascular system in cancer metastasis).
Figure 2.7: Comparison of cell mechanics methodologies in terms of property measured and throughput capacity. Numbers for measurement throughput reflect only data collection, not analysis. *throughput potential for external PBR is based on 3 cell/FOV and uses the itemized breakdown of assay time shown in Fig. 6.9.
2.4 Review of Cancer Cell Mechanics
The most destructive and deadly aspect of cancer is its ability to spread, or metas-tasize. The role of physical forces and mechanical properties in this process have begun to change how researchers study cancer progression (Wirtz et al., 2011). In this sec-tion, we will review the current state of cancer cell mechanics through the following perspectives:
1. The metastatic cascade: the journey of a cell during metastasis
2. Invasive cells display a reduced mechanical stiffness
3. Invasive cells exert larger tractional forces to their substrate
4. Reduced cell stiffness of cancer cells can be observed at the tissue level
5. The epithelial to mesenchymal transition: a model for cancer progression studies
At the end of this section, we will discuss how these elements of cancer cell mechanics influence and motivate the experiments in this work.
Figure 2.8: The metastatic cascade. Cells detach from the primary tumor, in-vade the surrounding stromal space, transmigrate the vascular system, and establish secondary tumors at distal sites. Physical forces and mechanical properties are likely involved in many of these steps. Figure republished from (Wirtz et al., 2011) with permission from Nature.
and nutrients) through vascularization. Cells then detachment from the primary tumor and invade the surrounding stromal space. One proposed model for this process is the epithelial to mesenchymal transition (EMT), which is a biomolecular program that leads to significant changes in biochemical signaling, receptor expression, cell morphology, and invasion potential (EMT will be discussed more later in this section, and at length in Chapter 5). Cancer cells then transmigrate the vascular system by penetrating endothelial and epithelial vessels. Finally a secondary tumor is established at a distal site in the body. Increasing evidence suggests that forces and mechanical properties internal to and external of the cancer cells play a significant role in each step of this process.
trac-tion force microscopy (TFM) to examine the differences in cell-generated force between metastatic and non-metastatic cancer cell lines (Kraning-Rush et al., 2012). Briefly, cells were plated on 500 nm fluorescent bead-loaded polyacrylamide substrates with a known modulus. The beads were imaged before and after removing the cells and the total force was calculated. For breast, prostate and lung cancers, Kraning-Rush et al. found that metastatic cells exerted higher force on their underlying substrate compared to non-metastatic cells (Kraning-Rush et al., 2012). This finding was independent of cell area and increasing the density of collagen I on the substrates, which implies that increased cell-generated force is intrinsically tied to the metastatic state and not the cell’s microenvironment. Similar results have been shown by other groups (Agus et al., 2013).
peaks when comparing stiffness distributions of primary (breast) and secondary (lung) tumors from the same mouse (Plodinec et al., 2012). These findings may suggest that the reduced stiffness adopted by cancer cells may persist to the secondary tumor. Over-all, this work currently provides the most through evidence that the reduced stiffness of cancer cells can be observed at the tissue level.
The epithelial to mesenchymal transition: a model for cancer progression studies. An intermediate conclusion thus far is that cell mechanics (stiffness and force-generation) is essential to understanding cancer metastasis. However, the studies described above and others in the community have not yet addressed or identified the biomolecular mechanisms behind the altered mechanical properties and cancer. Stated as a question: What are the mechanistic links between cell mechanics and metastasis(i.e. proteins and signaling pathways)?
Additionally, while incredible informative, the studies described above make me-chanical comparisons between different immortalized cells lines, different patient cell line, or tissue samples from different stages of cancer progression. Since there is con-siderable genetic variation between these specimens, this different-stage approach is not ideally equipped to identify the regulatory pathways (i.e. the signaling molecules) behind the altered mechanical properties of cancer cells.
tissue and their subsequent invasion into stromal tissue (Yilmaz and Christofori, 2009). There are several well-known drivers of EMT, including transforming growth factor
β (TGF-β) and bone morphogenetic proteins (BMPs) (Gordon et al., 2009). These signaling pathways lead to several classic hallmarks of EMT: 1) altered gene expression (Ranganathan et al., 2007), 2) dramatic changes in cell morphology and the structure of the actin cytoskeleton (Moustakas and Stournaras, 1999)(Hubchak, 2003), 3) down-regulation of cell-cell adhesion molecules such as E-cadherin (Vogelmann et al., 2005), 4) significant increases in cell motility and invasion capacity (Gordon et al., 2009).
These changes in cytoskeletal structure and increased interaction with the ECM implicate a role for altered cell mechanics during EMT (Yilmaz and Christofori, 2009). EMT provides a well characterized biomolecular platform for identifying potential pro-tein mechanisms behind the mechanical changes during cancer progression.
2.5 Rheology towards Cell Mechanics
Although our experiments (presumably) induce molecular level deformations of many cellular components, our microbead-based methods are insensitive to these indi-vidual contributions. Therefore, to parametrize our data, we are going to use continuum models for our magnetic tweezer and passive bead rheology (PBR) assays. Here, we re-view rheology concepts towards cell mechanics measurements using continuum material models.
Rheology is the study of material deformation under force. More specifically, when you apply a force of a given magnitude in a defined geometry for a certain amount of time to a material, rheology captures these quantities and describes the resulting deformation response of the system. In order to characterize material properties inde-pendent of the size or geometry of the system, rheologists use the intensive variables stress (σ) and strain (γ), where
σ≡ force area =
F
A (2.1)
γ ≡relative deformation = 4x
x (2.2)
Figure 2.9: Basic deformation geometries for corresponding stresses.
are dominated by water, and since water is considered incompressible under typical biological forces, stresses usually result in shear or extensional deformations.
The relationship between stress and strain defines the material response of a system. The limiting cases of mechanical response are elastic behavior of an ideal solid, described by Robert Hooke, and viscous behavior of an ideal liquid, described by Issac Newton. Real materials exhibit both elastic and viscous responses depending on the nature of the applied stress and the timescale over which the stress is applied. Real materials are visoelastic systems. The following three sections will discuss elastic, viscous, and viscoelastic responses.
2.5.1 Ideal Elastic and Viscous Materials
between stress and strain may become nonlinear. Depending on how the stress or strain are applied or measured, different types of elastic moduli can be defined (Fig. 2.9). For a shear stressσ and a shear strainγ =4x/h, Hooke’s law gives
σ =Gγ (2.3)
whereGis the elastic shear modulus, which is a measure of the rigidity of the material. The elastic shear modulus describes the extent of deformation when a material expe-riences opposite stresses on opposing surfaces (Fig. 2.9). Under stress, an ideal elastic material will deform immediately and remain in this state until the stress is removed, at which point, the material will return to the undeformed state. Compared to glass (G∼1010 Pa) and a rubber band (G∼ 106 Pa), cells typically have a lower elasticity (G ∼ 101 −103 Pa). The different types of elastic moduli are related under specified conditions; for example, the shear (G) and Young’s (E) moduli are related through (Benenson et al., 2002):
G= E
2(1 +ν) (2.4)
where ν is the Poisson’s ratio and a measure of the compressibility of a material. For isotropic, incompressible materials,ν = 0.5 and hence G= 13E.
(material plus geometry). For example, for an isotropic, incompressible beam, the on axis stiffness is related to the Young’s modulus E through (Benenson et al., 2002):
k = AE
L (2.5)
whereA and Lare the cross-sectional area and length of the beam, respectively. In general, cell mechanics instruments apply a stress to a cell and measure the resulting strain. Cells are viscoelastic materials, so the resulting deformation has both elastic and viscous contributions. Most studies focus on the elastic response of a cell, parameterizing this quantity with an elastic modulus that depends on the nature of the applied stress. For example, compressive forces are often applied in AFM experiments, and by measuring the indentation and making basic assumptions about the probe-cell contact geometry, the Young’s modulusE can be calculated. The community, however, often refers to various moduli of a cell as the cell stiffness. For our considerations, we also focus on the elastic response of cells, and will generally refer to changes in moduli
Gas changes in cell stiffness.
Ideal viscous materials. For an ideal viscous system, abstracted as a dashpot that dissipates mechanical energy, the stress is proportional to the strain rate ˙γ = ddγt, and independent of the strain. These systems are called Newtonian liquids. The stress σ
and strain rate ddγt are related by
σ =ηdγ
where η is the viscosity of the liquid (Pa s in SI units). Hence, viscosity is a measure of the resistance to changes in strain due to a stress. Liquid materials continuously deform while the stress is applied and remain in the deformed state after the stress is removed. Depending on how the stress or strain are applied or measured, liquids can be characterized in terms of different quantities, such as bulk or shear viscosities (similar to elastic materials). For orientation, the viscosity of the cytoplasm of a cell (η ∼ 0.1 Pa s) falls between that of water (η∼0.001 Pa s) and honey (η ∼2−10 Pa s) and is close to the viscosity of a 2.5M sucrose solution (η ∼0.12 Pa s), which we use later as a viscosity standard.
2.5.2 Viscoelastic materials
Viscoelastic systems are materials that have characteristics of both elastic and viscous materials. The rheological properties of viscoelastic materials are often measured by applying small-amplitude, oscillatory stresses or strains to the system. As a result, rheologists tend to work in frequency domain rather than the time domain. If we consider a viscoelastic system under an oscillatory shear strain, with amplitudeγ0 and angular frequency ω= 2πf (ω in rad/s; f is the frequency in Hz), we can write
γ(t) = γ0sinωt (2.7)
σ(t) =σ0sin(ωt+δ) (2.8)
whereσ0 is the amplitude of the stress. For ideal elastic materials, the induced stress is in phase with the strain (δ = 0) and for ideal liquids, the induced stress is phase shifted by 90◦. Using these boundary conditions for a viscoelastic system, we can write the induced stress as a function of an in-phase component with amplitude σ0 = γ0G0, and an out of phase component with amplitude σ00=γ0G00 as (Wang and Discher, 2007)
σ(t) = γ0(G0sinωt+G00cosωt) (2.9)
where the phase shift is between 0 and 90◦. From equation 2.9, the elastic (storage) shear modulus is given byG0 = γσ0
0 and the loss shear modulus (related to the viscosity) is given byG00 = σ00
γ0. For an ideal elastic material, G
0 =Gand G00= 0, and for an ideal
liquid, G0 = 0 and G00 = ωη. Typical materials in biology, such as cells and tissues, are viscoelastic and therefore have both elastic and loss moduli, each dependent on the rate of deformationω: G0(ω), G00(ω). Additionally, materials that are more elastic than viscous G0(ω) > G00(ω) are called viscoelastic solids, wheres materials that are more viscous than elastic G0(ω)< G00(ω) are called viscoelastic liquids.
For convinence, the oscillatory strain and induced stress considered above, Eq. 2.8
complex shear modulus (Ferry, 1980):
σ∗(ω)/γ∗(ω) = G∗(ω) =G0(ω) +iG00(ω) (2.10)
with a real component equal to the elastic modulusG0(ω) and an imaginary component equal to the loss modulus G00(ω).
The linear relationship between stress and strain (ideal elastic system: equation2.3) and between stress and strain amplitude (viscoelastic system: equation 2.9) holds for small strains and small strain amplitudes. These conditions define the linear elastic and linear viscoelastic ranges of a material. At larger strains/amplitudes, some materials exhibit nonlinear material responses which may result in reducedG0 (strain-softening) or increased G0 (strain-stiffening). There is evidence that cells strain-stiffen at high strain (Kollmannsberger and Fabry, 2011).
Creep-recovery experiments probe viscoelastic systems. In this subsection we examined the general, induced stress response from an applied strain for a viscoelastic material. In order to approximate various biological contexts, rheologists often observe the induced strain γ(t) of a system under a fixed stress σ0, and monitor the recov-ery after the strain is removed. The creep compliance J(t) is often the quanitity to characterize these creep-recovery experiments (Wang and Discher, 2007):
J(t) = γ(t)
σ0
(2.11)
under an applied stress, whereas a material with a low compliance is able to resist deformation under stress. We will conduct creep-recovery measurements during our magnetic tweezer experiments throughout this work.
2.5.3 Physical Considerations in Micro-Rheology
To this point we have discussed rheology principals of ideal and viscoelastic materials without consideration to length scale. To help understand how length scale impacts the study of rheology at the micron scale, we consider applying an external force Fexternal
to a point source with mass m that is embedded in a viscous material:
Fexternal = ma
|{z} inertial effects
+ fvv
|{z} viscous effects
(2.12)
where fv is the coefficient of friction. When considering small extended objects a
simplification can be made by considering micron length scales and velocities of such particles in a Newtonian fluid. As a microbead moves through a fluid, volumes of the fluid equal to that of the microbead must be displaced. The Reynolds number (Re) is a dimensionless parameter that relates inertial effects of the displaced volume of fluid to that of the internal friction (viscosity) of the fluid. Parameterized in terms of a characteristic lengthL, the Reynolds number can be written as (Benenson et al., 2002)
Re= ρvL
η (2.13)
η = 0.001 Pa s) moving at 1 and 100µm/s the Reis 10−6 and 10−4, respectively. These conditions are within the low Reynolds number regime defined as Re 1, indicating that viscous effects dominate inertial effects in the flow of fluid around the microbead. These flow conditions are called laminar flow.
The drag force on a microbead in laminar flow conditions is the sum of the integrated pressure and shear stress imposed on the bead from the fluid. The total drag force on the bead with radiusa is given by Stokes law (Benenson et al., 2002)
FD= 6πaηv (2.14)
where η is the viscosity of the fluid and v is the relative velocity. Stokes law assumes spherical particles, homogeneous Newtonian fluid, laminar flow and no particle inter-action. Thus, if we apply an external force to a microbead under these conditions, we see that the drag force is equal to the external force
Fexternal = FD
= 6πaηv
(2.15)
2.6 Active Microrheology towards Magnetic Tweezer Experiments
Active microrheology uses an external force applied to a microbead to locally deform the material and monitor the resulting strain. Active microrheology is the underlining methodology to several cell mechanics techniques: optical tweezers, magnetic twist-ing cytometry, and magnetic tweezers. Creep-recovery experiments, as discussed in Sec. 2.5.2, are used to approximate various biological contexts (e.g. deformation of a cell under a force applied by another cell) and determine mechanical properties. The creep-recovery methodology will be used in magnetic tweezer experiments discussed in Chapters 4 and 5.
Fig. 2.10 shows data for a typical magnetic tweezer experiment. So we can ask ourselves: how do we capture the non-instantaneous elastic deformation followed by a viscous deformation in our data?
Figure 2.10: Typical bead displacement in response to a step stress. We desire a model that captures this functional form under force: a non-instantaneous elastic deformation followed by a viscous deformation. Once we have a model, we intend to fit each bead displacement individually (e.g. 8 fits for the experiment above) so that we can determine whether cellular mechanical properties change over time.
2.6.1 Step Response of Ideal Elastic and Viscous Materials
Step response of an ideal elastic material: The response of an ideal elastic material to a step stress is given by rearranging Eq. 2.3 and casting in terms of compliance
J(t) = γσ(t) 0 :
J(t) = 1
G Hookean Solid (2.16)
Fig. 2.11 shows the response function for an ideal elastic material under a step stress.
casting in terms of complianceJ(t) = γσ(t) 0 :
J(t) = 1
ηt Newtonian Liquid (2.17)
Fig. 2.11 shows the response function for an ideal viscous material under a step stress.
2.6.2 Step Response of Viscoelastic Materials
Maxwell Model: Viscoelastic Model 1. The Maxwell model consists of an elastic spring and a viscous dashpot in series. The stress experienced across each element is equal to the total stress (σtotal) applied to the system. Also, the total strain of the
system (γtotal) is equal to the sum of the strain each element allows. We can write this
as
σtotal=σspring =σdashpot (2.18)
γtotal =γspring+γdashpot (2.19)
We take the time-derivative of the total strain
dγ
dt =
dγs
dt +
dγd
dt (2.20)
dγ dt = 1 G dσ dt + 1
ησ (2.21)
Integrating with respect to time for a constant input step stress,σ(t) =σ0 (this implies
dσ
dt = 0), the strain as a function of time becomes:
γ(t) = σ0
η t+γ0 (2.22)
The expression for compliance J(t) = γσ(t)
0 for a constant step stress σ0 is given by
J(t) = 1
ηt+
1
G Maxwell model (2.23)
Fig. 2.11 shows the step-stress response function for a Maxwell model – a viscoelastic liquid material with instantaneous elastical deformation. This model would approxi-mately our data, but since no real materials deform instantaneously, we will analyze 2 more viscoelastic models.
Kelvin-Voigt Model: Viscoelastic Model 2. The Kelvin-Voigt model consists of an elastic spring and a viscous dashpot in parallel. The total stress applied to the system (σtotal) is shared by the two elements, and the total strain of the system (γtotal)
σtotal=σspring+σdashpot (2.24)
γtotal =γspring =γdashpot (2.25)
We rewrite the equation for the total stress using the know relations for stress across a spring (Eq. 2.3) and a dashpot (Eq. 2.6):
σ=Gγ+ηdγ
dt (2.26)
We rearrange terms to cast in the standard form for a first order differential equation:
dγ(t)
dt +
G ηγ(t) =
1
ησ(t) (2.27)
Using the standard solution for a first order differential equation, and assuming a constant input step stress, σ(t) = σ0, we have:
γ(t) =Ce−Gηt+σ0
G 1−e
−Gηt
!
(2.28)
If we assume zero strain at time zero,γ(t = 0) = 0, then we see that C = 0. Thus, we can write the strain response as
γ(t) = σ0
G 1−e
−G ηt
!
The expression for compliance J(t) = γσ(t)
0 for a constant step stress σ0 is given by
J(t) = 1
G 1−e
−G ηt
!
Kelvin-Voigt model (2.30)
Fig. 2.11shows the step-stress response function for a Kelvin-Voigt model: viscoelastic solid material. This model does not reflect typical response functions of cells under step stresses.
Jeffreys Model: Viscoelastic Model 3. The Jeffreys model consists of a Kelvin-Voigt model with a dashpot in series. The stress experienced across the Kelvin-Kelvin-Voigt element and the dashpot is equal to the total stressσtotal applied to the system.
Addi-tionally, the total strain of the systemγtotalis equal to the sum of the strain Kelvin-Voigt
element and the dashpot. We can write this as
σtotal =σKelvin-Voight=σdashpot (2.31)
γtotal =γKelvin-Voight+γdashpot (2.32)
γ(t) = σ0
G 1−e
−G η1t
! + σ0
η0
t (2.33)
The expression for compliance J(t) = γσ(t)
0 for a constant step stress σ0 is given by
J(t) = 1
G 1−e
−G η1t
! + 1
η0
t Jeffreys model (2.34)
Fig. 2.11 shows the step-stress response function for a Jeffreys model – a viscoelastic liquid material with non-instantaneous elastical deformation. This model is capture the features of typical response functions for cells under step stresses.
Calculation of cell compliance from bead displacement. In raw form, magnetic tweezer data are position and time measurements produced by the particle tracking software Video Spot Tracker (VST; cismm.org). The radial displacement of the bead is computed, as seen in the data motivating plot at the beginning of this section, Fig. 2.10. The time-dependent compliance J(t) is then calculated using r(t) and the following expression (Ziemann et al., 1994):
J(t) = 6πar(t)
F(t) (2.35)