USING QUANTITATIVE FLUORESCENT MICROSCOPY TO CHARACTERIZE CENTROMERIC EPIGENETIC REGULATION IN THE DEVELOPING EMBRYO OF CAENORHABDITIS ELEGANS.
Lydia Ivy Smith
A dissertation submitted to the faculty at the University of North Carolina at Chapel Hill in partial fulfillment of the requirements for the degree of Doctor of Philosophy in the Genetics and Molecular
Biology Program in the School of Medicine.
Chapel Hill 2018
ABSTRACT
Lydia Ivy Smith: Using quantitative fluorescent microscopy to determine centromeric epigenetic regulation in the developing embryo of Caenorhabditis elegans.
(Under the direction of Paul S. Maddox)
Despite being a canonical feature of all eukaryotic mitotic cell divisions, there is a surprising amount of variability between species for many specific characteristics of centromeres. Using many of the workhorses of biomedical research to study all aspects of centromere composition, organization, and regulation, research has uncovered several key canonical features of centromeres shared between species. In recent years, technology has facilitated higher quality quantitative imaging of experimental systems that previously have been difficult to quantify. In particular, we are interested in filling a deficit in centromeric research by utilizing modern microscopy and post-acquisition analysis techniques to expand our understanding of centromeric regulation into developing embryos. We have chosen C. elegans as our embryonic system as they have a strong track record as an embryonic model system and have tools in place for experimental and molecular manipulation.
canonical are conserved in the context of developing embryos, however, there are several that are unique in a developmental context. This work expands our understanding of the even larger diversity of
ACKNOWLEDGMENTS
I would first like to give a huge thanks to my mentor Paul S. Maddox. After a very rough start to my graduate career, he invited me to join his lab and my graduate career has since taken off. He’s helped me develop as a graduate student, becoming a better scientist, and a fantastic mentor to all of the students I’ve had the pleasure of working with. Paul has been with me every step of the way through my graduate career, through the ups and downs, and all the challenges we’ve had. I am so grateful for seeing the potential in my abilities as a scientist and mentor. I would next like to thank all the members of my committee who have been a fantastic support network for my graduate research and career advice. I have always believed they had my success as their foremost goal for every committee meeting I’ve held. And it is their support and faith in my ability to succeed that has helped give me the confidence to put together this dissertation. Beth Sullivan, Steve Rogers, and Shawn Ahmed have given me all the attention and advice I could ask for, and their unique perspectives have helped shape both the work I’ve performed and myself as a researcher. I would especially like to thank Kerry Bloom for not only being a fantastic chair of my committee but a wonderful mentor as well. Kerry not only read many manuscripts and wrote me letters of recommendation but was available for scientific and career advice whether I needed. I thank him greatly for his support.
I would next like to thank the members, past and present, of Paul’s lab who have been with me in my graduate career along the way. Previous members like Anne-Marie Ladouceur, Ian Ross, and Felix Peng were fantastic lab mates who were always around to help out and lend their expertise. Current members Vincent Boudreau and Tanner Fadero are awesome lab mates who are always around to make every day in the lab interesting. I’d especially like to thank Tanner for reading this manuscript on such short notice. I’d finally like to thank all my friends and family who have supported me through graduate school.
TABLE OF CONTENTS
LIST OF FIGURES ... xi
LIST OF ABBREVIATIONS... xiii
CHAPTER 1: INTRODUCTION AND BACKGROUND. ... 1
A historical perspective of centromeric research... 1
Regulation of CENP-A through multiple cell divisions ... 3
Variability of centromeres across systems studied ... 6
Challenges of experimenting with embryonic systems. ... 10
C. elegans as a model embryonic system ... 11
Developing a quantitative approach to understanding centromeres in embryos ... 12
Our biological questions. ... 13
CHAPTER 2: MATERIALS, METHODS, AND NOVEL MICROSCOPY ANALYSIS. ... 15
C. elegans strains used for all experiments. ... 15
Knocking down proteins via feeding RNAi ... 16
Sample preparation and microscopes use. ... 17
Image Analysis of nuclei in embryo timelapses, Z2/Z3 in L1 larva, and pronuclei/metaphase in zygotes. ... 18
RESULTS ... 20
Embryonic timelapse data can be compiled to visualize the “average” embryo. ... 20
C. elegans canonical histones are stably incorporated during each cell cycle of early embryogenesis. ... 26
DISCUSSION ... 30
CHAPTER 3: CENTROMERIC EPIGENETIC DYNAMICS AND REGULATION IN EARLY CAENORHABDITIS ELEGANS DEVELOPMENT. ... 33
RESULTS ... 35
Absolute nuclear CENP-A levels and nuclear accumulation rates decrease throughout early development. ... 35
CENP-A nuclear import and loading is tied to entry into mitosis. ... 38
C. elegans CENP-A is stably (very low turnover) incorporated during the cell cycle, similar to vertebrates. ... 41
CENP-A regulatory mechanisms are conserved in early embryogenesis... 44
DISCUSSION ... 49
CHAPTER 4: CENTROMERIC EPIGENETIC REGULATION, DISCUSSION AND FUTURE DIRECTIONS OF WORK IN THE DEVELOPING EMBRYO OF CAENORHABDITIS ELEGANS. ... 54
INTRODUCTION ... 54
RESULTS ... 56
Analysis of pronuclear and metaphase chromatin in 1-cell embryos. ... 56
Depletion of several proposed CENP-A regulatory proteins inequitably affects gametic pronuclei under equal depletion conditions. ... 63
Several known and proposed homologous CENP-A regulators affect CENP-A enrichment on zygotic chromatin. ... 66
CYK-4 spatially and temporally localizes to chromatin in a homologous manner to human MgcRacGAP. ... 68
DISCUSSION ... 72
CONCLUSIONS ... 74
CHAPTER 5: DISCUSSION AND FUTURE DIRECTIONS. ... 75
APPENDIX: SEQUENCES OF RNAI EXPRESSING BACTERIA USED ... 80
LIST OF TABLES
Table 1: Worm strains used for all experiments... 15
Table 2: RNAi feeding bacteria used in all the experiments. ... 17
Table 3: List of calculated values for quantifying nuclear accumulation of H2B. ... 25
LIST OF FIGURES
Figure 1: Sharp increase in CENP-A research in the early 21st century. ... 2 Figure 2: Relative timing of CENP-A loading into chromatin across eukaryotic
phylogeny reveals evolutionary differences of loading/incorporation timing. ... 8 Figure 3: Protocol for isolating synchronized embryos to create starved/fed
populations of L1 larva for image analysis of cells re-entering the cell cycle. ... 18 Figure 4: Representative ROIs for image analysis in FIJI/ImageJ... 20 Figure 5: Embryo analysis pipeline involving normalization, organization, and
secondary analysis facilitate quantification of canonical histone behavior in
C. elegans embryos. ... 22 Figure 6: Histone nuclear import rates scale inversely to cell cycle length. ... 25 Figure 7: Protein recovery and recovery rate calculations. ... 28 Figure 8: Protein stability and turnover dynamics can be quantified using population
controls to reveal stable chromatin incorporation... 29 Figure 9: Controls of CENP-A. ... 36 Figure 9: CENP-A nuclear dynamics have both conserved and novel characteristics. ... 37 Figure 10: GFP::CENP-A is loaded at the end of each cell cycle and drops as
embryonic cells exit mitosis and enter a quiescent state. ... 39 Figure 11: Fold increase and representative images of embryos with P4 division. ... 40 Figure 12: CENP-A is significantly reincorporated into chromatin just prior to
mitosis after feeding. ... 41 Figure 13: CENP-A is stably incorporated across multiple lineages and cell
divisions of the early embryo. ... 43 Figure 14: Calculation of recovery and t1/2 of CENP-A... 44 Figure 15: Nuclear accumulation dynamics change in response to perturbations
in centromere loading. ... 45 Figure 16: Centromeric histone dynamics and quantities in early embryos are
significantly affected by depletion of KNL-2. ... 46 Figure 17: Canonical histone dynamics and quantities in early embryos are not
significantly affected by depletion of KNL-2. ... 47 Figure 18: Loss of E2 ubiquitin-conjugating enzyme effects canonical but not
centromeric histone chromatin incorporation. ... 48 Figure 20: Canonical and centromeric histone dynamics using secondary alignment
Figure 21: Known human centromere regulation pathway and proposed
homologous C. elegans pathway. ... 55 Figure 22: Representative images of OD421 pronuclei in zygotes under all RNAi
conditions. ... 57 Figure 23: Pronuclear GFP::CENP-A levels during pronuclear migration,
chromatin condensation, and nuclear envelop breakdown. ... 59 Figure 24: Pronuclear mCherry::H2B levels during pronuclear migration, chromatin
condensation, and nuclear envelop breakdown. ... 59 Figure 25: Representative examples of metaphase in zygotes under all RNAi
conditions. ... 61 Figure 26: Pronuclear GFP::CENP-A levels at metaphase. ... 62 Figure 27: Pronuclear mCherry::H2B levels at metaphase. ... 63 Figure 28: Inequitable distribution of histones between gametic nuclei in several
RNAi conditions. ... 64 Figure 29: Inequitable distribution of histones between gametic chromatin at
metaphase in several RNAi conditions. ... 65 Figure 30: CENP-A enrichment responds to depletions of several homologues of
known CENP-A regulators during pronuclear migration, chromatin condensation,
and nuclear envelope breakdown. ... 67 Figure 31: CENP-A enrichment responds to depletions of several homologues of
known CENP-A regulators during metaphase. ... 68 Figure 32: Hypothesized CYK-4 temporal localization based on homology to human
MgcRacGAP temporal localization. ... 69 Figure 33: CYK-4 spatial-temporal localization to chromatin during late-metaphase
to early-anaphase matches human spatial-temporal localization. ... 70 Figure 34: Control embryos for CYK-4 depletion. ... 71 Figure 35: CYK-1 is not quantifiably recruited to chromatin during mitosis. ... 71 Figure 36: Schematic of micro-fluidic device design to be used to trap and
immobilize L1 larva for imaging. ... 75 Figure 37: Long-term viability of adult C. elegans is affected by depletion of
LIST OF ABBREVIATIONS * Significant, p≤0.05
** Significant, p≤0.01 *** Significant, p≤0.001 **** Significant, p≤0.0001
°C Degrees Celsius
3D/4D Three dimensional/four-dimensional Ant Anterior
ARD Alcohol/Ribitol Dehydrogenase family AU Arbitrary Units
Ave. Average bp Base Pairs
CDC Cell Division Cycle related CENP-A CENtromeric Protein A
CGC Caenorhabditis Genetics Center
ChIP-Seq Chromatin ImmunoPrecipitation + Sequencing CPAR CENP-A Related Protein 1
CREST Calcinosis, Raynaud phenomenon, Esophageal dysmotility, Sclerodactyly, and Telangiectasia
CYK Cytokinesis defect
DIC Differential Interference Contrast EPI abnormal EPIthelia
FIJI Fiji is just ImageJ
FRAP Fluorescence Recovery After Photobleaching G1 G1 Growth Phase
G2 G2 Growth Phase Germ Germline Cells
GFP Green Fluorescent Protein
HCP Histone H3-like Centromeric Protein HJURP Holliday Junction Recognition Protein
IPTG Isopropyl β-D-1-thiogalactopyranoside JH Johns Hopkins (Geraldine Seydoux) KNL Kinetochore Null Protein
LIN abnormal cell LINeage m mili; 10-3 units
Max-Projection Maximum Intensity Projection
MDX Maddox Me Mitotic Exit MG Michael Glotzer
MgcRacGAP Male germ cell Rac GTPase-activating protein
n Nano, 10-9 units NA Numerical Aperture
NEBD Nuclear Envelop Break Down NGM Nematode Growth Media
NIH National Institute of Health ns not significant
OD Oegema Desai P. Body Polar Body
PAR Abnormal embryonic PARtitioning of cytoplasm PIE Pharynx and Intestine in Excess
Post Posterior
RID/RawIntDen Raw Integrated Density
RNAi RNA (RiboNucleic-Acid) Interference ROI Region of Interest
S S Phase Soma Somatic Cells
SUMO Small Ubiquitin-like MOdifier UBC UBiquitin Conjugating enzyme VALAP Vaseline-Lanolin-Paraffin
WI Water Immersion (Objective) WT Wild Type
ZYG Zygote defective: embryonic lethal α Alpha
β Beta
μ Mu/micro; 10-6 units
CHAPTER 1: INTRODUCTION AND BACKGROUND. A historical perspective of centromeric research
In 1882, Walther Flemming published his pioneering work on salamander cells undergoing mitosis in his collections Zell-substanz, Kern und Zelltheilung (Cell-Substance, Nucleus, and Cell-Division (Flemming 1882; O’Connor & Miko 2008)). With his newly utilized aniline dyes, Flemming was able to kill cells and stain their chromosomes, conferring what he saw under the microscope into the drawings he published in 1882. His work was the first of its kind to describe the dramatic physiological changes of the inside of a cell as it underwent cell division. Even with the relatively rudimentary staining and optics Walther Flemming possessed at the time, a modern observer can still clearly distinguish the primary, condensed constriction points on each chromosome where ‘spindle fibers’ have attached (Flemming 1882). From this historical moment onward, our macro view of centromeres has not changed
substantially, as centromeres are still described broadly as a constricted region of chromatin where kinetochores are built, and “microtubules” attach to facilitate segregation (Britannica 2012). In fact, except for the addition of color, the macroscopic way the scientific field draws and describes centromeres in textbooks and manuscripts has not changed significantly in the last 136 years. However, it is the field’s microscopic understanding of centromeres that has been revolutionized by an exponential increase of technological advances.
Through continuous research and publications (Figure 1), CENP-A is considered the most upstream known epigenetic mark of centromeres in eukaryotes given that no candidate protein or epigenetic mark has been found to be both as necessary and as sufficient as CENP-A in establishing a centromere. Every organism in which a CENP-A homologue has been identified is unable to establish centromeres or build kinetochores when CENP-A is depleted or knocked out. CENP-A is also the only known centromere protein able to induce the formation of a neocentromere, a functional
centromere/kinetochore in a genomic locus that does not form a centromere in wild-type cells (Scott & Sullivan 2014; Barnhart et al. 2011).
Figure 1: Sharp increase in CENP-A research in the early 21st century.
CENP-A related research picks up in at the turn of the century and experiences a doubling of publications succeeding the introduction of ChIP-Seq in 2007 (Johnson et al. 2007), indicated by a single-headed arrow.
These findings have been consistent with our initial understanding of centromeres as persistent regions of heterochromatin or ‘closed’ chromatin, similar to telomeres.
It was not until the advent of ChIP-Seq in 2007 that the field was able to determine the location and genomic sequences associated with CENP-A-containing nucleosomes in the genome (Johnson et al. 2007). It is because of this technology that recent data has challenged the assumption of transcriptional inactivity at the centromere by demonstrating that they are in fact transcriptionally active, especially during mitosis (Hall et al. 2012; Wong et al. 2007; Chen et al. 2008). However, these findings are perplexing given that transcription is traditional understood to require ‘open’ chromatin, and CENP-A is inversely correlated with transcription, as is the case for worms (Gassmann et al. 2012). Our lab’s recent findings appear to support the more ‘open’ model of centromeric chromatin given that metaphase chromosomes that condense to a smaller size in smaller cells do so by incorporating less CENP-A. A phenomenon supported by over expression of CENP-A resulting in larger condensed chromosomes (Ladouceur et al. 2017).
Regulation of CENP-A through multiple cell divisions
It has been well understood that the regulation of this crucial epigenetic centromeric mark can be broken down into several distinct mechanisms of inheritance. Because CENP-A is a histone, every cell cycle will see the amount of protein halved into the two daughter cells. This means that new CENP-A must be incorporated into chromatin to replace what was lost or risk diluting the most upstream epigenetic mark of centromeres. The field has identified three main mechanisms of regulating the incorporation of CENP-A-containing nucleosomes within chromatin, identified as: Licensing/initiation of the chromatin, loading/deposition of A-containing nucleosomes, and epigenetically modifying the CENP-A/nucleosome in some way to maintain/stabilize it within chromatin and distinguish it from exogenously incorporated CENP-A nucleosomes (Lagana et al. 2010; Stellfox et al. 2013).
In order for CENP-A-containing nucleosomes to be incorporated into chromatin, the accepting chromatin must first be primed in some way to facilitate their recruitment. In humans, this
loading (in vertebrates) occurs during mitotic exit and into the next G1 (elaborated on below). It is
hypothesized that the DNA where CENP-A nucleosomes will be incorporated is epigenetically modified in some way by this complex, possibly with a histone acetylation, but it is unclear if this mark is necessary (Fujita et al. 2007). It is known, however, that this complex recognizes already incorporated CENP-A as its way of identifying ‘centromeric chromatin’ (French et al. 2017; Hori et al. 2017a). It is the binding of this complex to chromatin that makes it possible for CENP-A nucleosomes to be incorporated into chromatin, and without it, no new CENP-A is recruited to or incorporated into chromatin. This process is conserved across phylogeny, and in C. elegans (where it was initially discovered), the Mis18 complex homologue is KNL-2, and complete knockdown of this protein results in complete loss of CENP-A within chromatin (Maddox et al. 2007; Hayashi et al. 2004).
Newly synthetized CENP-A during the cell cycle spontaneously binds to H4, which can then form a heterotetramer (a dimer of two heterodimers) with itself. This conformation is similar to the H3-H4 heterotetramer found in canonical histones (Black et al. 2004), only with a tighter molecular conformation than canonical nucleosomes (Black et al. 2007; Falk et al. 2016). It is this CENP-A-H4 heterotetramer that can bind to a canonical H2A-H2B heterotetramer to form a fully functional centromeric octameric
More recently, the cytoskeleton formin protein mDia2 was found to have a nuclear role during cell division, involving incorporation of HJURP bound CENP-A into chromatin. This formin protein was found to be necessary for incorporation of CENP-A into chromatin, as depletion of mDia2 resulted in CENP-A remaining bound to HJURP and not incorporated into chromatin by the next cell cycle. The mechanism of mDia2’s involvement in CENP-A loading is unclear, but the current hypotheses are either 1) assisting in chromatin-remodeling or 2) altering the organization of chromatin (Liu & Mao 2016). The C. elegans homologue to mDia2 is CYK-1, and although its role in cytokinesis is well-studied, it has no known nuclear or centromeric role (Jantsch-Plunger et al. 2000).
Proper centromeric epigenetic maintenance requires that the biologically correct amount of CENP-A-containing nucleosomes is maintained within chromatin every cell cycle. If too little CENP-A is maintained within chromatin, too few or undersized kinetochores will be built, resulting in chromosome non-disjunction, aneuploidy, and often cell/organism death. However, too much CENP-A within chromatin can cause aberrant gene silencing and the formation of neo-centromeres, which can result in
chromosome breakage, aneuploidy, and cell/organism death (Gonzalez et al. 2014). Because both too much and too little CENP-A is detrimental to a cell’s ability to proceed through mitosis with no
physiological damage, the levels of CENP-A must be carefully regulated and maintained.
One mechanism that cells use to do this is through the epigenetic marking of new, appropriately incorporated CENP-A. This mechanism, although not well understood, allows the cell to differentiate between correctly localized CENP-A-containing nucleosomes and exogenously incorporated CENP-A. It is unknown exactly how a cell is able to recognize endogenously and exogenously incorporated CENP-A, but once correctly incorporated CENP-A has been marked, it will not be removed from chromatin. There is evidence to suggest that ubiquitinated “old-CENP-A” facilitates the ubiquitination of “new-CENP-A”. This process could be a mechanism by which the cell is able to distinguish exogenously incorporated CENP-A (Niikura et al. 2016).
centromere by the end of G1. Utilizing pulse/chase experiments, it was confirmed that it was the newly synthesized CENP-A nucleosomes (not those already incorporated in chromatin, inherited from the mother cell) that are lost. It was also confirmed that it was not MgcRacGAP specifically affecting CENP-A maintenance but a Rho family GTPase cycle as ECT-2 (corresponding GEF) and CDC42 (target of both) depletion resulted in the same CENP-A phenotype (Lagana et al. 2010). Interesting, MgcRacGAP depletion can be rescued by constitutively active mDia2 (Liu & Mao 2016). It is therefore hypothesized that mDia2 activation is downstream of MgcRacGAP and the GTPase pathway. In C. elegans, the known MgcRacGAP homologue is CYK-4 (Jantsch-Plunger et al. 2000; Zhang & Glotzer 2015), and like CYK-1, this protein is very well studied in the context of cytokinesis but no centromeric role is known. In C. elegans, CDC-42 and ECT-2 have homologues of the same names respectively (Gotta et al. 2001; Morita et al. 2005).
Variability of centromeres across systems studied
Given that centromeres are an essential and fundamental part of all eukaryotic cell divisions, it is counterintuitive that there would be such a large amount of variability between species. There is
significant variability in not only CENP-A protein structure, but also DNA sequence (Roach et al. 2012), centromere size (Neumann et al. 2015), regulatory proteins (Xiao et al. 2017), and the position and organization of centromeres (Mandrioli & Manicardi 2012). This diversity is predicted to be a result of a phenomenon coined ‘centromeric drive’ (Kursel & Malik 2018). This ‘drive’ originates from the centromeric competition to become part of the oocyte (rather than the polar body) genome during meiosis II or
oogenesis. Because only one of the products of meiosis II becomes part of the next generation, physically larger centromeres have a mechanical advantage, disproportionally positioning themselves to become part of the oocyte genome (Chmátal et al. 2014). This selection creates an “arms race” for centromeres resulting in the variability we observe. Despite this evolutionary pressure, centromeric function remains unchanged in all eukaryotic mitotic divisions, an evolutionary phenomenon coined “the Red Queen hypothesis” where changes occur, but the outcome remains the same (Lythgoe & Read 1998).
One important source of variation among centromeres, position and organization, breaks down into two main categories. The most commonly researched centromeric organization is known as
built and microtubules attach to facilitate segregation. Monocentrism, although always epigenetically defined by the location of CENP-A-containing nucleosomes (with the exception of budding yeast, which also relies on sequence specificity (Gonzalez et al. 2014)), can vary in centromere size from a single nucleosome (point centromeres in yeast) to megabases in length (humans and mice).
The other centromeric organization is known as holocentrism. Holocentric organisms have centromeres distributed along almost the entire length of their chromosome and facilitate the formation of multiple kinetochores, creating multiple unique microtubule attachment points along each centromere. The distribution of the centromere mark CENP-A has topologically distinct enrichments, telomeres commonly being the only locations barren of CENP-A (Steiner & Henikoff 2014; Gassmann et al. 2012). Holocentrism is present in plants (angiosperms), and animals (arthropods and nematodes) (Melters et al. 2012). Because of the distribution of restricted phylogenetic branches that contain holocentric
chromosomes, it is hypothesized that holocentrism has arisen independently several times via convergent evolution (Melters et al. 2012; Dernburg 2001).
It is currently unclear what why both centromeric organizations are maintained throughout evolution. It is suggested that holocentric organisms are more resilient to the deleterious effects of chromosomal breakages given that even small fragments of chromosomes have the ability to form centromeres and properly segregate (Mandrioli & Manicardi 2012). However, holocentrism’s advantages may be counteracted by disadvantages during meiosis (Maddox et al. 2004). Given that both models have stably persisted on evolutionary scales supports the hypothesis that the advantages and disadvantages confer similar biological fitnesses.
nucleosomes are incorporated into chromatin to ensure each daughter strand has the correct number/concentration of nucleosomes before entering mitosis. Like all other aspects of centromere biology, the timing of the loading of newly synthesized CENP-A-containing nucleosomes is not conserved throughout eukaryotes.
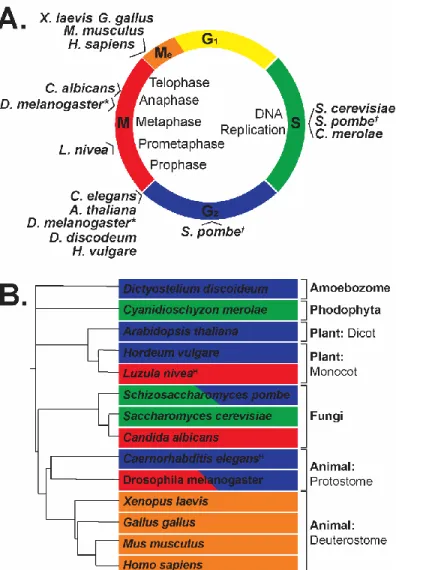
Figure 2: Relative timing of CENP-A loading into chromatin across eukaryotic phylogeny reveals evolutionary differences of loading/incorporation timing.
(A) List compiled from current literature (Nechemia-Arbely et al. 2012) plotting each species’ known CENP-A loading time onto a canonical cell cycle chart. M=Mitosis, Me=Mitotic Exit; G1=G1 Growth Phase, S=S-phase; and G2=G2 Phase. *D. melanogaster loading during G2 phase was demonstrated in syncytial nuclei, while M phase loading was demonstrated in cell culture. †S. pombe has been shown to have dual loading of CENP-A within each cell cycle. (B) Phylogenetic tree of species with known CENP-A loading times, adapted from a phylogenetic tree created using itol.embl.de (Letunic & Bork 2016).
synthesized CENP-A to fill in the gaps (Dunleavy et al. 2011). There are several organisms that do load newly synthesized CENP-A during DNA replication, such as: the budding yeast S. cerevisiae (Pearson et al. 2004), the fission yeast S. pombe (which actually has dual loading (Takayama et al. 2008)), and the red algae C. merolae (Maruyama et al. 2007). However, for other organisms where CENP-A loading is un-coupled from S-phase, a placeholder nucleosome fills in for the missing centromeric nucleosomes of each daughter cell, a process which is believed to maintain the size and position of the epigenetic mark of centromeres until newly synthesized CENP-A-containing nucleosomes are incorporated into chromatin (Dunleavy et al. 2011). In humans, this process was found to occur immediately after chromatin exited telophase, right at the beginning of G1. It was during this time that the ‘placeholder’ nucleosomes were removed and the newly synthesized CENP-A nucleosomes were incorporated into chromatin, restoring the full epigenetic mark of centromeres in these cells. This same pattern of loading of CENP-A during mitotic exit/early G1 was also found in chickens/G. gallus (Silva et al. 2012), frogs/X. laevis (Moree et al. 2011), and mice/M. musculus (Kim et al. 2012).
Outside of these vertebrate systems, we find even more diversity of CENP-A loading times, with most species still maintaining an uncoupling of CENP-A loading from canonical histone loading. Fission yeast/S. Pombe (Lando et al. 2012), flowering plants/A. thaliana (Lermontova et al. 2006), amoebae/D. discoideum (Dubin et al. 2010), barley/H. vulgare (Lermontova et al. 2007) and nematodes/C. elegans (elaborated on in Chapter 3) were found to incorporate CENP-A into chromatin after S-phase had
distinct from the other CENP-A loaders mentioned previously, as they are the only ones active during mitosis.
Challenges of experimenting with embryonic systems.
One of the primary reasons cell culture has become such a large part of most medical research is the ease and experimental simplicity the system offers. Cell cultures usually are very cheap, easy to maintain, and very amenable to experimental perturbations. When used to study cell division, there are several more advantages cell culture confers including the ability to be synchronized at different stages of the cell cycle, stereotypical progression through each identical cell cycle indefinitely, and uniformity in height and positioning on a coverslip, which introduces very little experimental variation into quantitative image analysis. These characteristics of cell cultures have helped move the mitosis field forward and allowed for robust quantification of cell cycle components using light microscopy.
Despite the huge leaps and bounds the mitosis field has made in understanding the regulation, mechanisms, and components of the mitotic cell cycle described above, little of this work has been applied to understand how many of these components and pathways work or are employed in developing embryos. Almost all of the characteristics that the research community has taken advantage of in cell culture to understand mitosis are not present in a developing embryo. Embryos present a significant challenge when attempting to use quantitative microscopy to understand mitosis in the context of a developing embryo. Unlike cell cultures, embryos are often not cheap or easy to maintain in the lab or in an environment amenable to imaging, making experimental perturbations challenging (Ryan et al. 2017). These include non-uniform cell architecture (variable sizes and shapes), typically short, rapid cell cycles (followed by increasingly lengthening cell cycles (Philpott & Yew 2005)), an inability to pause or
synchronize cell cycles (due to weak cell cycle checkpoints (Kipreos 2005)), and significant movement of cells/nuclei throughout development (Ishiura 2010). Embryos that must develop in utero often have difficulties with keeping fetal or maternal movement to a minimum without compromising the health or physiology of either (Ahrens et al. 2006). Embryos that develop ex utero (outside of a womb) often have an egg shell, making chemical or mechanical perturbations difficult (Johnston & Dennis 2012).
synchronous cell divisions early in development, all embryos at some point must start developing different tissues, resulting in asymmetric and asynchronous cell divisions. This results in embryonic cells having different sizes, shapes, and transcriptional activity. All of this variability results in a dramatic increase in experimental variation which makes image quantification difficult to perform and interpret.
C. elegans as a model embryonic system
First proposed by Sydney Brenner as a model system for embryonic neuronal development in 1963, the nematode species Caenorhabditis elegans (C. elegans) have become a work horse for
embryological research for the past 40 years since their first publication in 1974 (Goldstein 2016; Brenner 1974). C. elegans are a fantastic model system for understanding embryonic development because of several characteristics of the species. First, C. elegans have an incredibly stereotypical development with the entire lineage traced from the one-cell embryo all the way to the ~1000-cell adult (Sulston et al. 1983). Their minimal developmental variability makes quantifying development changes due to experimental perturbations more robust. Second, C. elegans embryos are enclosed in a transparent eggshell which confers three advantages: first, the developing embryo is contained in a mostly impenetrable shell, allowing development to occur unobstructed; second, the clear egg shell allows for easy imaging either by transmitted light (DIC) or specific excitation wavelengths for fluorescent microscopy; third, C. elegans have a short reproductive lifespan and are easily manipulated experimentally and genetically, making it relatively easily to perform knock downs, knock outs, and have tagged proteins (Riddle et al. 1997; Dickinson et al. 2013).
The incorporation of fluorescent proteins precipitated the eventual incorporation of automated tracking of these proteins throughout development (Boyle et al. 2006), as has been utilized for other cultured systems, although quantifying the fluorescent proteins they track in these systems has lagged. Prior to the work done in C. elegans, a similar technique was employed in D. melanogaster embryos (Schuh et al. 2007). This work was able to take advantage of the fact that all cell cycles in the early fly embryo are synchronized, each generation of nuclei dividing at the same time in a shared syncytium.
et al. 1999)) and is considered the epigenetic mark of centromeres in C. elegans. The second isoform of CENP-A, Cenp-A Related 1 (CPAR-1), has a minor role in meiosis and no known role in the embryo or developing/adult worm (Monen et al. 2015; Monen et al. 2005). And although many C. elegans proteins have poor sequence conservation to their human homologues, most are identified through their structural and functional conservation. Because of this, as described above, most of the pathways discussed here have known worm homologues, making C. elegans an ideal model organism. Having such a simple system with similar proteins, cellular mechanisms, and pathways is a tremendously powerful tool for this embryonic research.
However, despite the many advantages of using C. elegans embryos to understand and study cell biology in the context of development biology, there are several technical challenges to utilizing them. Because of the egg shell, there is a fixed volume of cytoplasm for the embryo to utilize as it develops, which results in each cell division producing smaller cells, with cells unable to increase in volume after cytokinesis. Because of this fixed total volume, cellular functions occur in smaller volumes, organelles shrink, and certain molecular factors are diluted. C. elegans embryos are ~20-25μm in diameter (in the shortest dimension, ~50um in the long axis), (Riddle et al. 1997) and are relatively thick compared to commonly used cell culture 5μm (budding yeast)-12μm (HeLa) (Gilbert 2009; Fujioka et al. 2006), resulting in a large enough volume for cells/nuclei to migrate, either passively through progressive cell cycles, or actively through tissue migration events like gastrulation (Byerly et al. 1976; Young et al. 1991; Schnabel et al. 2006). This results in an exponentially decreasing collection of fluorescence signal from individual cells/nuclei throughout the embryo when using the required high NA optics (NA > 1.0) (Waters 2009). Embryos also have a limited number of cell divisions before hatching, limiting the amount of analysis that can be performed with each embryo.
Developing a quantitative approach to understanding centromeres in embryos
Historically, most characterization of embryonic systems has been performed with transmitted light, usually relying on inherent contrasts within embryos in order to describe cellular processes and development. In fact, the entire C. elegans embryonic lineage was performed using solely DIC to observe the developing embryos and maturing larva (Sulston et al. 1983). With the advent of the isolation,
have a fluorescently tagged protein (Chalfie et al. 1994). Although this technology expanded our understanding of protein localization and organization within developing embryos, DIC has been mostly used for large embryos. This is because, as described above for C. elegans embryos, most embryos are large, proteins of interest are far away from the coverslip, and morphological movements within the embryo make quantification challenging. Collecting images of embryos is also incredibly time-consuming, making it difficult to acquire enough samples to be confident in any statistical analysis.
However, despite these challenges, we created an imaging and analysis pipeline to quantify fluorescently labeled proteins in a developing embryo in a similar process to what has been done in cell cultures. In recent years there has been a concerted effort to bridge the divide between biologists performing traditional wet-lab experiments, and biologists performing novel computer science related experiments, whether that is statistical analysis of large data sets or modeling of biological phenomena. Despite the overlap that exists between biologists at the bench or at the computer, it has taken a determined effort to unite the two. It is because of this unification that a tremendous amount has been done to understand biological phenomena by producing a large amount of experimental data and using a combination of statistics and automation to organize and analyze it in a meaningful way. Specifically, a lot of recent work has involved taking thousands of timelapses of a protein or process of interest in a cell and temporally organizing all the data in order to build a “model” or “average” cell (Scialdone et al. 2015; Y. Wang et al. 2014). In cells, this process is relatively straight forward because cells can be synchronized, and collecting ones, tens, or hundreds of thousands of data points is not as large of an effort. This work was the inspiration for our analysis pipeline we developed for embryos. Although the majority of embryos do not have this many synchronized nuclei, cannot be synchronized, or have a development that can be reversibly paused, we instead relied on the intrinsic stereotypical development of embryos as our method of temporal alignment and normalization. The stereotypical developmental of embryos, specifically C. elegans embryos will allow us to temporally organize our data sets in order to build a model of an “average” embryo.
Our biological questions.
ever-changing physiology. To do this we first developed an analysis pipeline involving sample preparation, imaging, and post-acquisition analysis to quantify fluorescently labeled protein quantities in early
CHAPTER 2: MATERIALS, METHODS, AND NOVEL MICROSCOPY ANALYSIS.
This section contains all of the information about the materials and methods used to complete all of the work described in this dissertation. Much of which has been adapted from (Smith & Maddox 2018). The example data shown here is in regards to mCherry:H2B signal, but the same analysis technique was applied to the GFP::CENP-A data as well.
C. elegans strains used for all experiments.
Worms were cultured and incubated at 20 °C on OP50-seeded NGM agar plates as described by (Riddle et al. 1997). All strains were transferred regularly to keep populations non-starved prior to
experimentation and imaging.
Strain Genotype Reference
CF1903 glp-1(e2141: c2785t) (Berman & Kenyon 2006)
FGP8 pie-1p:GFP::H2B (Pelisch et al. 2014)
pie-1p:mCherry::smo-1(GG)
JH2015 pie-1p::GFP::pie-1 (Merritt et al. 2008)
MDX78 MDX47 pie-1p::mCherry::HIS-58 (Maddox Lab, non-published) MG685 cyk-4p::cyk-4::GFP (Zhang & Glotzer 2015)) MDX79 MDX47 pie-1p::mCherry::HIS-58 (Maddox Lab, non-published)
SWG006 nNeonGreen::cyk-1 (Goldstein Lab, non-published
N2 Wild-Type strain (Gems & Riddle 2000)
OD421
ok1892 CeCENP-A/hcp-3 deletion allele
(Gassmann et al. 2012) OD347 hcp-3p::GFP::CeCENP-A
OD56 pie-1p::mCherry::H2B
Table 1: Worm strains used for all experiments.
Knocking down proteins via feeding RNAi
All RNAi depletions were done via feeding RNAi as described in (Ahringer 2006). All bacterial strains (except where noted) containing a vector expressing dsRNA under the IPTG promoter were obtained from the Ahringer library (from B. Goldstein, S. Ahmed, and A. Maddox Laboratories at the University of North Carolina at Chapel Hill). Bacterial cultures were spiked into LB with 1X Ampicillin and grown overnight (~16 hours) at 37 and 200 rpm. 90µl of saturated culture were seeded onto IPTG NGM plates (Ohkumo et al. 2008) and allowed to dry and grow up overnight. For all RNAi feeding experiments, worms were placed onto plates at the L4 stage and allowed to mature on plates for a designated amount of time before having embryos dissected out and imaged. All RNAi strains used were manufactured using the empty L4440 vector in HT115 cells as a template. Sequences were confirmed using the universal primer M13F(-21) 5’ TGTAAAACGGCCAGT 5’(GENEWIZ n.d.), sequencing was done by Eton Biosciences.
Bacteria
Strain Phenotype(s) 24-hours 44-hours 48-hours
*OP50 (WT
feeding strain) WT
Labeled “WT” or “Wild Type” for all experiments
†HT115 (L4440
empty vector) WT
Labeled “control” RNAi for all experiments
RNAi Plasmid
ARD-1 No embryonic phenotype - Chapter 4 -
CDC-42 No embryonic phenotype - Chapter 4 -
CYK-1 Reduction/loss of cytokinesis. Multinucleate
cells. Segregation errors. - Chapter 4 --
CYK-4 (K08E3.6)
Reduction/loss of cytokinesis. Multinucleate
cells. Segregation errors. Chapter 4 Chapter 4 - EPI-1
(K08C7.3) No embryonic phenotype - Chapter 4 -
HCP-3 Reduced GFP::CENP-A levels and
segregation errors. Chapter 3
KNL-2 (K06A5.4)
Reduced GFP::CENP-A levels and segregation errors.
Chapter 3
Chapter 4 - Chapter 4 LIN-53 Reduced GFP::CENP-A levels and
segregation errors. - Chapter 4 -
UBC-9 Confirmed with parallel depletion in FGP8
strain. Complete loss mCherry::smo-1 signal. - - Chapter 3 ZYG-12
(ZK546.1)
Severe reduction in movement of pronuclei to midbody in zygote. Only one pronucleus forms a functional metaphase plate and enters anaphase.
Table 2: RNAi feeding bacteria used in all the experiments.
(1) Bacteria strain/name of plasmid. *Bacteria strain used to culture worms and for feeding experiments. †Bacterial strain used for all RNAi experiments. Plasmids contain sequences homologous to their target gene inserted into the L4440 empty plasmid. List of sequences used in Appendix I. (2) Phenotypes observed upon depletion. (3) Chapters where RNAi depletions are utilized and how long worms were exposed to feeding RNAi. Several of the RNAi depletions were done at 40/44-hours instead of 48-hours because the 48-hour depletion caused sterility and a lack of any viable zygotes to image/analyze. 40/44-hour depletions were long enough to produce a visible phenotype without compromising the ability of the worm to produce zygotes for imaging/analysis.
Sample preparation and microscopes use.
Imaging was performed on a Nikon A1R microscope body with a 60X 1.27 NA Nikon Water Immersion Objective with a GaASP PMT detector (Nikon) using NIS-elements.
Preparing embryos and zygotes for imaging.
Our protocol is adapted from Monica Driscoll’s protocol on Wormbook. Embryos/zygotes were dissected out of non-starved, gravid adult C. elegans into M9 on No.1.5 22 mm2 coverslips and mounted onto 2% (w/v) agar pads on a standard microscopy slide, before being sealed with VALAP (1:1:1 lanolin, petroleum jelly, and parafilm wax). 2% agar pads were used to gently compress embryos without damaging them. Imaging was done using sequential (for 2min timepoints) or simultaneous (for 15-second timepoints) excitation of GFP and mCherry fluorophores using 488-nm and 561-nm lasers respectively. Z-stacks contained between 20-30 slices (depending on how embryo was oriented), and all slices were 1μm apart for the entire duration of each cell cycle for FRAP analysis.
Preparing L1 worms for imaging.
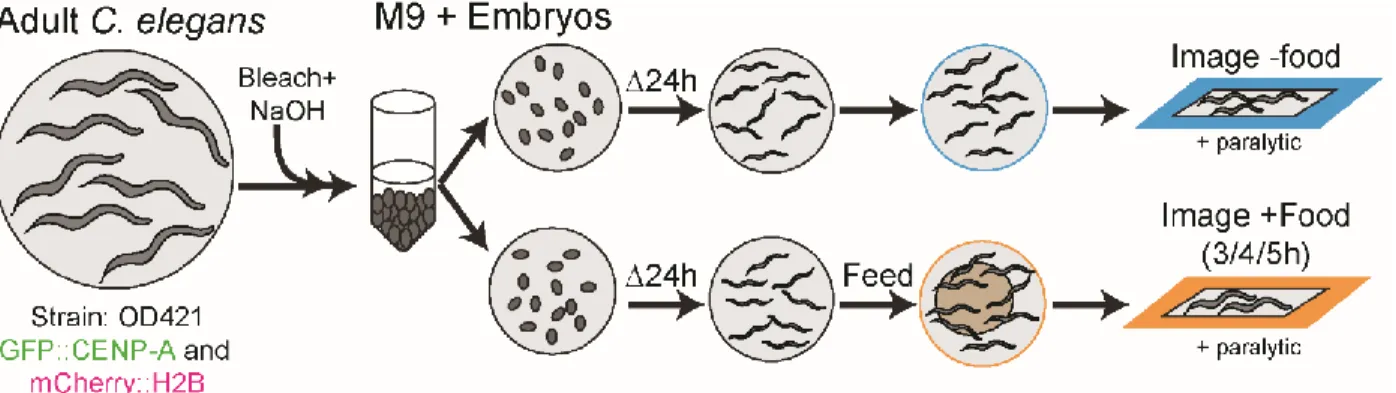
Figure 3: Protocol for isolating synchronized embryos to create starved/fed populations of L1 larva for image analysis of cells re-entering the cell cycle.
To create starved/fed populations of L1s we initially collected adults, bleached and washed them before separating them into two populations. Both populations were starved for 24 hours before half of the population is fed for several hours before both populations are imaged.
Image Analysis of nuclei in embryo timelapses, Z2/Z3 in L1 larva, and pronuclei/metaphase in zygotes.
Nuclei of interest were identified through one of four methods: (1) In early embryos, lineage tracing from either the 2- or 4- cell stage facilitated identification of nuclei based on published C. elegans lineages. (2) In embryos where lineage tracing was not possible, positive identification of the P-lineage was done utilizing the higher-than-average signal of mCherry::H2B in the P-lineage of the OD421 strain. The overexpression of mCherry in the P-lineage compared to all somatic cells facilitated identification of Z2 & Z3 in later embryos. (3) In zygotes, parental gametes were identified by their proximity to the polar-bodies and/or relative starting position to the first asymmetric division. (4) In L1 larva, Z2/Z3 were identified by their location in the middle of the worm (length-wise), the higher than average signal of the mCherry::H2B, and the distinctive rosette pattern of the chromosomes.
Images collected using NIS-Elements were imported for analysis in ImageJ/FIJI. All Z-stacks were transformed into individual Max-Projections throughout the entire embryo before drawing regions of interest (ROIs) and taking measurements. If a Max-Intensity-Projection throughout the entire embryo was not appropriate for measuring a single nucleus in a crowded embryo, individual Max-Projections were generated for each time point. For every timepoint, a ROI was drawn around the entire nucleus of interest, and two or three ROIs of equal size were collected from the cytoplasm. Collection of
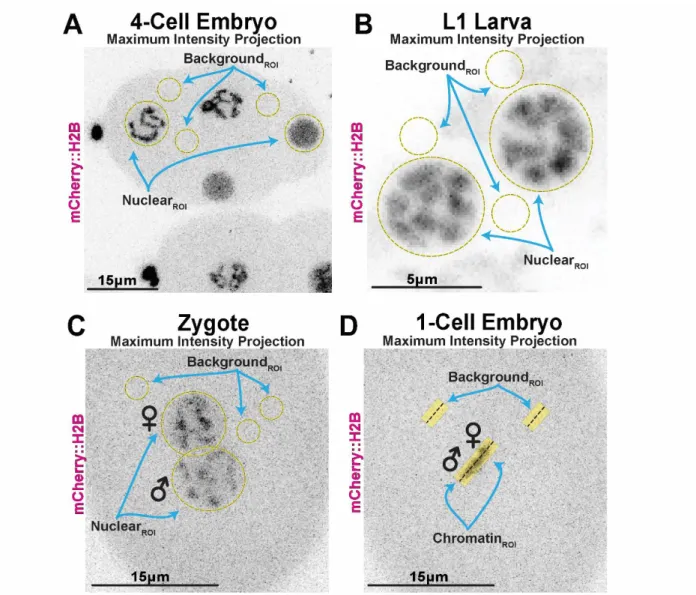
Figure 4: Representative ROIs for image analysis in FIJI/ImageJ.
Nuclear ROIs shown to completely encompass chromatin either before NEBD or post-NEBD. Background ROIs drawn in the cytoplasm making sure to avoid Nuclear chromatin, polar body chromatin, or space outside of embryo. (A) Representative embryo used for nuclei in embryo timelapses. (B) Representative L1 larva used for Z2/Z3 analysis. (C) Representative zygote used for pronuclei timelapses. These timelapses inform our labeling of chromatin in metaphase measurements. (D) Representative 1-cell embryo used for metaphase chromatin measurements.
RESULTS
Embryonic timelapse data can be compiled to visualize the “average” embryo.
strain of C. elegans that has a copy of H2B (his-58) tagged with mCherry. Each cell cycle, the amount of H2B in each nucleus and subsequently incorporated into chromatin was measured over time by
fluorescence intensity. We focused primarily on three early lineages; two somatic lineages, AB and E, as well as the germline lineage P (Figure 5A). Embryos were imaged within 3D 1-μm step Z-stacks with 2-minute acquisition intervals for 1-3 hours. Multiple non-synchronized embryos were imaged
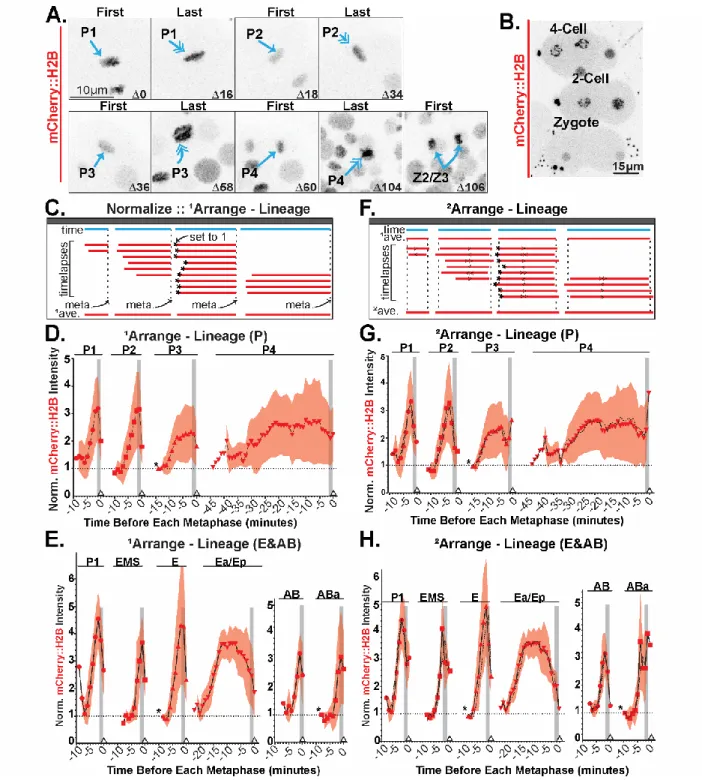
Figure 5: Embryo analysis pipeline involving normalization, organization, and secondary analysis facilitate quantification of canonical histone behavior in C. elegans embryos.
point. Experimental 1averages and standard deviations are plotted. (D) P-lineage experimental data plotted. (*) is the first timepoint of P3. (E) E-lineage (left) and AB-lineage (right) experimental data plotted. (*) is first timepoint of E and ABa respectively. (F) Using the calculated 1average and the same data sets, the data is run through our custom MATLAB macro to generate new timestamps to decrease the standard deviation around the 1average, resulting in a new 2average generated as a histogram with 1 timepoint (2-minute) bins. (G-H) Experimental 1averages (black dashed line), 2averages, and standard deviations are plotted. (G) P-lineage experimental data plotted. (H) E-lineage (left) and AB-lineage (right) experimental data plotted.
𝐵𝑙𝑒𝑎𝑐ℎ𝐶𝑜𝑟𝑟𝑒𝑐𝑡𝑒𝑑 𝑅𝐼𝐷 (𝑁𝑢𝑐𝑙𝑒𝑎𝑟𝑅𝑂𝐼(𝑡)) = 𝑅𝐼𝐷(𝑁𝑢𝑐𝑙𝑒𝑎𝑟𝑅𝑂𝐼(𝑡)) ∗ (
𝑎𝑣𝑒:𝑀𝐺𝑉(1−3)
𝑎𝑣𝑒:𝑀𝐺𝑉(𝑡) ) ( 1 )
This equation generates the bleach-corrected RawIntDen (RID) of a nucleus of interest calculated with hand-drawn ellipses Regions of Interest (ROI). To bleach correct this value over the course of a timelapse, the RID of the nucleus is multiplied by the ratio of the Mean Grey Value (MGV) of the
background ROIs by the average MGV of the first three timepoints. This was to account for any variability in the background signal of the first three timepoints. This bleach correction term becomes larger in much later timepoints as more bleaching occurs.
𝐵𝑎𝑐𝑘𝑔𝑟𝑜𝑢𝑛𝑑&𝐵𝑙𝑒𝑎𝑐ℎ𝐶𝑜𝑟𝑟𝑒𝑐𝑡𝑒𝑑 𝑅𝐼𝐷 (𝑁𝑢𝑐𝑙𝑒𝑎𝑟𝑅𝑂𝐼(𝑡)) = 𝐵𝑙𝑒𝑎𝑐ℎ𝐶𝑜𝑟𝑟𝑒𝑐𝑡𝑒𝑑 𝑅𝐼𝐷 (𝑁𝑢𝑐𝑙𝑒𝑎𝑟𝑅𝑂𝐼(𝑡)) −
(𝑎𝑣𝑒: 𝐵𝑙𝑒𝑎𝑐ℎ𝐶𝑜𝑟𝑟𝑒𝑐𝑡𝑒𝑑 𝑅𝐼𝐷 (𝐵𝑎𝑐𝑘𝑔𝑟𝑜𝑢𝑛𝑑𝑅𝑂𝐼(𝑡)) ∗ (
𝑎𝑟𝑒𝑎:𝑁𝑢𝑐𝑙𝑒𝑎𝑟𝑅𝑂𝐼
𝑎𝑟𝑒𝑎:𝐵𝑎𝑐𝑘𝑔𝑟𝑜𝑢𝑛𝑑𝑅𝑂𝐼)) ( 2 )
This equation generates the bleach and background corrected RIDs that are used in Figure 5 and Figure 6. Background ROIs are multiplied by the same MGV ratio term used in Equation 1 to correct for bleaching during the timelapse. The background RID term does have an additional modifier that accounts for the potentially smaller size of the background ROIs compared to the nuclear ROI. Because the background ROIs must sometimes be smaller than the nuclear ROI, especially in smaller cells, the background RID must be scaled up appropriately before being subtracted from the nuclear RID in Equation 2. Example image in Figure 4A.
a profile of the relative quantities of a histone throughout cell cycles and lineages. Experimental data from the germline P-lineage (Figure 5D) and the somatic E- and AB- lineages (Figure 5E) are shown.
In order to image the embryos for long periods without significantly bleaching or inducing phototoxicity, we acquired stacks of images through the embryos every two minutes. To overcome temporal under-sampling of the data, we developed a MATLAB macro that automatically explores all the possible combinations of aligning the timelapses in an attempt to decrease the overall standard deviation around the average we had previously generated. This macro allows us to interleave the timelapses by fitting similarly shaped curves closer mathematically (Berro & Pollard 2014; Boudreau et al. 2018 Preprint). All the timelapses of each cell cycle are shifted within a 4-minute (± 2 minutes) interval by the algorithm either forward (>, >>) or backwards (<, <<) in time by either a small (>, <) or large amount (>>, <<) (Figure 5F). Actual experimental data for the P-lineage are shown in Figure 5G, and somatic E- and AB-lineages in Figure 5H.
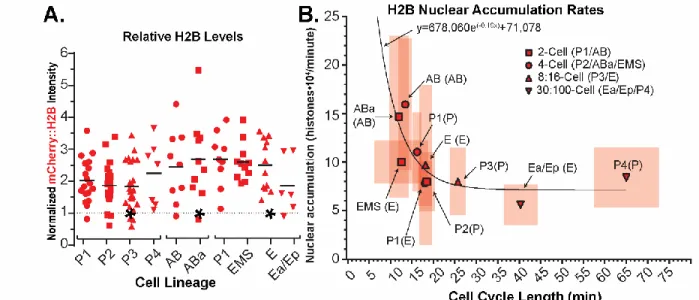
To determine the dynamics of H2B in each cell cycle, we compared the relative last timepoint values of H2B signal derived from our “average embryo” pipeline (Figure 6A). To calculate the rate of histone nuclear accumulation during all of the observed cell cycles, we quantified the duration of each cell cycle wherein the nuclear signal rose in minutes (Table 3 Columns 1-2). Import durations are manually measured for each cell cycle encompassing when the signal first begins to rise to when it stabilizes or the cell cycle ends. We then normalized all of the timelapses to the relative value at each lineage’s
Figure 6: Histone nuclear import rates scale inversely to cell cycle length.
(A) A germline-specific-promoter drives increased fluorescently labeled histone in the P-lineage, whereas the amount of fluorescently labeled histone incorporated into chromatin is stable through the 4-cell stage and decreases starting around the 8-cell stage of the somatic lineages. Identical data to Figure 5D-E each normalized internally to their own lineages (*). (B) Plotted calculations of H2B nuclear accumulation rates throughout development. Boxes represent standard deviation of the mean for both cell cycle length (horizontal) and nuclear accumulation rate (vertical). Solid line is a best fit one-phase exponential decay curve, equation shown.
1Cell 2Import Duration (min)
3Relative Metaphase Levels
4Histone Added (histones)
5Nuclear Accumulation (histones/min)
6n P1 12.3 (+/- 2.13) 2.02 1.09 1.08*106 1.05 (+/- 0.35)*105 10 P2 13.6 (+/- 1.79) 1.86 1.00 0.99*106 0.82 (+/- 0.29)*105 18 P3 12.6 (+/- 3.54) 1.83 0.98 0.97*106 0.83 (+/- 0.34)*105 20 P4 15.6 (+/- 5.17) 2.16 1.16 1.15*106 0.73 (+/- 0.17)*105 6
P1 11 (+/- 2.58) 2.68 1.03 1.02*106 0.78 (+/- 0.23)*105 4
EMS 9.8 (+/- 2.08) 2.59 1.00 0.99*106 1.00 (+/- 0.22)*105 10
E 12 (+/- 3.13) 2.5 0.96 0.95*106 0.96 (+/- 0.82)*105 9
Ea/Ep 12.3 (+/- 1.96) 1.86 0.72 0.71*106 0.56 (+/- 0.21)*105 6 AB 6.8 (+/- 1.51) 2.45 0.91 0.91*106 1.59 (+/- 0.67)*105 7 ABa 7.7 (+/- 1.56) 2.68 1.00 0.99*106 1.47 (+/- 0.83)*105 9
Table 3: List of calculated values for quantifying nuclear accumulation of H2B.
𝑁𝑢𝑐𝑙𝑒𝑎𝑟 𝐴𝑐𝑐𝑢𝑚𝑢𝑙𝑎𝑡𝑖𝑜𝑛 𝑅𝑎𝑡𝑒 = (9.9 ∙ 105∗ 𝑀𝑒𝑡𝑎𝑝ℎ𝑎𝑠𝑒 𝐿𝑒𝑣𝑒𝑙(𝑛)
𝑀𝑒𝑡𝑎𝑝ℎ𝑎𝑠𝑒 𝐿𝑒𝑣𝑒𝑙(4−𝑐𝑒𝑙𝑙 𝑠𝑡𝑎𝑔𝑒))/𝐼𝑚𝑝𝑜𝑟𝑡 𝐷𝑢𝑟𝑎𝑡𝑖𝑜𝑛(𝑛) ( 3 )
For this calculation, we made the assumption that the histones roughly double every cell cycle and that there are roughly 1 million H2B histones added each cell cycle. This is based on C. elegans’ 100 Mb diploid genome size (Hillier et al. 2005) divided by 147 bp wrapped around each histone with an average 50 bp (Szerlong & Hansen 2011) DNA linker with two H2B histones per nucleosome. Interestingly, we found an exponential decrease of nuclear accumulation rates as cell cycle length increases; a 3.6 min decrease half-life of accumulation for our H2B nuclear accumulation curve (Figure 6B).
C. elegans canonical histones are stably incorporated during each cell cycle of early embryogenesis.
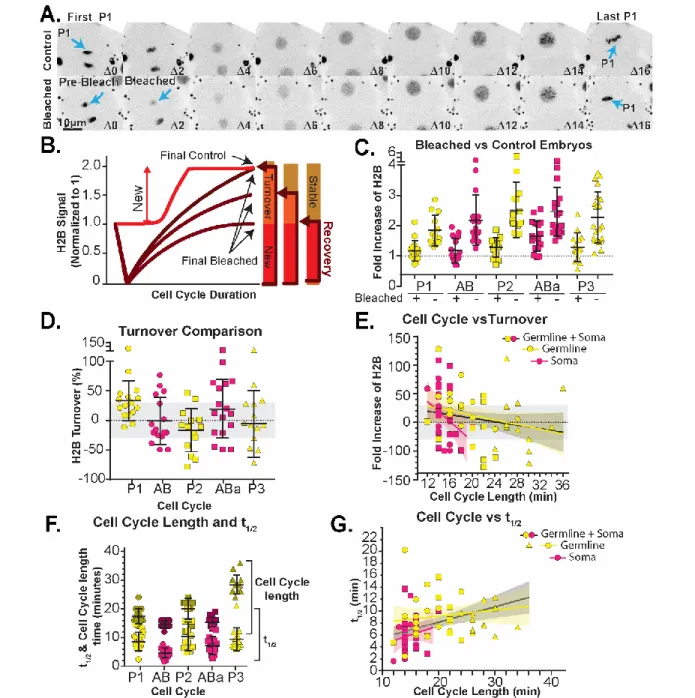
To further probe histone accumulation rate decreases through developmental time in C. elegans, we estimated histone turnover by measuring fluorescence recovery after photobleaching (FRAP)
(Walczak et al. 2010). We define histone turnover as the percent of histones inherited from the mother that are replaced during the timespan of a cell cycle. Utilizing the same strain of C. elegans described above, we focused our efforts on measuring the turnover of histones from the beginning to end of each cell cycle in early embryos. A common method of measuring protein stability and turnover rates, FRAP, involves photobleaching most or all of the fluorophores in a particular region of interest and measuring both the quantity and rate of recovered fluorescent signal in that area (Figure 7A). Typically, these types of experiments involve an internal non-bleached control. Here, we aimed to bleach the entire pool of fluorophores in the nucleus, meaning that there would be no corresponding non-bleached homologous region for comparison. Instead of traditional controls, we used the nuclear signal in non-bleached embryos as our control (Figure 8A).
𝑇𝑢𝑟𝑛𝑜𝑣𝑒𝑟(𝑛) = 𝐵𝑎𝑐𝑘𝑔𝑟𝑜𝑢𝑛𝑑𝐶𝑜𝑟𝑟𝑒𝑐𝑡𝑒𝑑 𝐹𝑖𝑛𝑎𝑙 𝐹𝑅𝐴𝑃(𝑛) − (𝑎𝑣𝑒: 𝐵𝑎𝑐𝑘𝑔𝑟𝑜𝑢𝑛𝑑𝐶𝑜𝑟𝑟𝑒𝑐𝑟𝑒𝑑 𝐹𝑖𝑛𝑎𝑙 𝐶𝑜𝑛𝑡𝑟𝑜𝑙𝑠) −
1) ( 4 )
This final value was calculated and only values with a FRAP efficiency of at least 70% were considered in the final analysis (meaning at least 70% of the measured signal disappeared post-laser ablation with at most 30% remaining). We find that all of the cells of the early embryo examined fall within the efficiency margin around 0%. We also find that this characteristic does not change when we separate the cells based on cell cycle length/developmental stage instead of cell cycle (Figure 8E). From the FRAP curves, we can also calculate the rate (k) at which the signal recovers in each cell cycle (Maddox et al. 2000) (Figure 7B-C and Equation 5) as well as the inverse (t1/2) of how long it takes each cell to recover their signal (Figure 8F-G and Equations 5-6. RID = RawIntDen).
𝑅𝑒𝑐𝑜𝑣𝑒𝑟𝑦 𝑅𝑎𝑡𝑒 (𝑘) = 𝑎𝑏𝑠 |𝑠𝑙𝑜𝑝𝑒 (
𝑡𝑖𝑚𝑒(𝑚𝑖𝑛)| 𝑡1𝑡2𝑡3…𝑡𝑛𝑠𝑖𝑔𝑛𝑎𝑙(𝐴𝑈)| 𝑙𝑛1𝑛(𝑀𝑎𝑥𝑅𝐼𝐷−𝑅𝐼𝐷(𝑡))
)|
( 5 )
𝑡
1/2=
𝑙𝑛 (2)𝑘
( 6 )
Figure 7: Protein recovery and recovery rate calculations. (A) Calculated recovery of signal in bleached embryos using only the first and final timepoints to calculate recovery of signal. (B) Calculated recovery rates using Equation 5. (C) Cell cycle length versus calculated recovery rate. Linear regression lines for somatic cells (pink), germline cells (yellow), and both (black) with 95%
Figure 8: Protein stability and turnover dynamics can be quantified using population controls to reveal stable chromatin incorporation.
DISCUSSION
Here we used a quantitative microscopy analysis pipeline to investigate histone dynamics in early embryonic development. As genome activity changes, so does histone stability; transcriptionally silent regions have more histone stability (Kireeva et al. 2002). In C. elegans embryos, transcription is activated in varying lineages at differing times (Tintori et al. 2016); thus, it could be possible to detect these
changes by probing histone population dynamics. We have found that gross histone dynamics are canonical (follow that reported in other model systems) in C. elegans with very little variation in differing lineages. This result could indicate that genome regulation in early development leads to histone stabilization, or that these changes are highly focused in time and space and thus not detected in our assays. Despite this, our work has derived a new imaging analysis pipeline, and shows that histones in rapidly dividing embryonic cells follow expected behaviors.
One persistent complication to studying protein dynamics in live embryos is the experimental variability that results from changes in cell fate, position, and cell cycle timing. In order to generate an ‘average embryo’, normalizing, time-aligning, and averaging many individual embryo timelapses allowed us to understand the dynamics of cell cycle proteins throughout early embryo cell cycles. The resulting analyses can be differentially organized to answer specific biological questions. We created models of ‘average’ C. elegans embryos and described the protein dynamics of individual cells/lineages. We focused on determining how H2B levels fluctuate throughout the cell cycles of developing lineages and if their characteristics were conserved in the early embryo. We chose H2B as our initial protein to start with given that it is well conserved protein across phylogeny (Malik & Henikoff 2003) and its cell cycle
dynamics are well characterized (Osley 1991).
lineage is normalized to itself, allowing us to correct for these differences. Overall, despite these potential limitations to our system, the dynamic characteristics of H2B appear normal.
We confirmed that throughout all of the cell cycles analyzed in early development, there was the expected rise of nuclear levels within each cycle cell from beginning to end. This rise in nuclear levels of canonical histones is associated with S-Phase, after histones are transcribed in late G1, then translated and imported into the nucleus for incorporation into newly replicated chromatin during S-phase (Marzluff et al. 2008). In C. elegans, the rise occurred early in each cell cycle, usually occurring within the first ten minutes of each cell cycle. Given that early blastomeres in the embryo lack GAP phases (Edgar & McGhee 1988), DNA replication takes the entirety of the interphase cell cycle, and this is consistent with the accumulation of nuclear signal soon after the previous mitosis terminates.
Our data alignment application resulted in smoother curves (when n was high enough) due to the resulting interpolated time series. These data are potentially more physiologically accurate than data aligned strictly by their timepoints however, the somatic cell cycles, which were composed of smaller datasets, had averages that seemed more susceptible to outliers, especially near the beginning and end of the timelapses. This is because as the program explores all the possible ways to shift the timepoints of the datasets, it might reduce the standard deviation around the mean, but may cause points at the beginning or end of the timelapses to deviate from the average (Berro & Pollard 2014; Boudreau et al. 2018 Preprint).
The stability of the histones means that the short recovery rates reflect how long the recovery takes during the cell cycle, and increases with the lengthening of the cell cycle. The t1/2 values reported here are a measure of how long it takes for the cell to reach its maximal recovered signal. Since we know that the nuclear accumulation decreases as cell cycles get longer, and the quantity of histones must return to the same quantity each cell cycle, it makes sense that the t1/2 would increase as the recovery of signal would need to take a larger interval of time.
genome size, there will not be a change in the quantity of histones that are required each cell cycle. Because the controls were all imaged identically, they were averaged together to create a Final (Control) value. Because each photobleached embryo was bleached to a different percent of its original signal (due to movement of the nucleus during the bleaching process) each time lapse was one Final (FRAP) value. From these calculations, and the consistency of average bleach efficiency of ~70%, turnover consistently fell within that error margin. So, although there may be some turnover, the incomplete recovery of signal indicates that turnover is not 100%. With the exception of a few outliers, there is not a strong correlation in any of the plots, suggesting that turnover is quite stable during the first few cell divisions and between lineages. We suspect that the histones are relatively stable in these early cell divisions, at least within an individual cell cycle. There could potentially be a very rapid turnover of histones between when the cell cycle ends at metaphase and when the next cell cycle starts in anaphase/telophase.
CHAPTER 3: CENTROMERIC EPIGENETIC DYNAMICS AND REGULATION IN EARLY CAENORHABDITIS ELEGANS DEVELOPMENT.
INTRODUCTION
Centromeres are chromosomal loci that direct assembly of mitotic kinetochores to ensure genome maintenance during cell division. Given their central role in proliferation, centromeres are well-studied in the context of stereotypical and repetitive cell divisions. Disruption of centromeric function leads to aneuploidy and cell death (Lawrence et al. 2015; Boyarchuk et al. 2014). It is well-accepted in the field that the centromeres of most known eukaryotes are defined by the epigenetic composition of their nucleosomes (Stellfox et al. 2013; Padeganeh et al. 2012); eukaryotic cells do not rely on chromatin modifications, sequence (the budding yeast S. cerevisiae is the only known eukaryotic exception (Gonzalez et al. 2014)), or non-nucleosome, chromosome-bound proteins to establish centromeric chromatin (Oegema et al. 2001; Padeganeh et al. 2012; Allshire & Karpen 2008).
For the majority of mitotic eukaryotic cells/organisms studied, the epigenetic mark necessary for establishing the location of a centromere is the histone-H3 variant CENtromere Protein A (CENP-A) (Earnshaw et al. 2013). This histone variant is not only necessary for establishing centromeres, but is sufficient for establishing a neo-centromere in a canonically non-centromeric region of the genome (Scott & Sullivan 2014; Foltz et al. 2009). CENP-A is thought to maintain centromere identity by being equally distributed to daughter strands in S-phase (Ross et al. 2016) and then directing assembly of new CENP-A-containing nucleosomes to replenish the centromere loci in preparation for the next cell cycle (Hori et al. 2017b; French et al. 2017). Variations on these dynamics have been found in various organisms, however, in every case, S-phase leads to halving at individual centromeres and subsequent doubling prepares centromeres for S-phase of the next cell cycle.
Many of the fundamental aspects of CENP-A dynamics during the cell cycle have been
CENP-A-containing nucleosomes, across eukaryotes, have been reported as incredibly stable, usually stably incorporated far longer than canonical nucleosomes. There have been reports of CENP-A-containing nucleosomes remaining stably incorporated from days (Jansen et al. 2007) to even months (Smoak et al. 2016), whether through many rounds of cell divisions or through long periods of cellular quiescence. This long-term stability has been considered one of the defining characteristics of CENP-A-containing
nucleosomes, and is possibly what facilitates the maintenance of epigenetic centromeric inheritance over many cell cycles, or for long periods of quiescence (Bodor et al. 2013).
Currently, very few studies have explored CENP-A dynamics in live developmental systems (García del Arco et al. 2018). Here we use C. elegans early development to determine CENP-A dynamics in a living developing organism going through differentiation. C. elegans, as well as other known
nematodes, several orders of insects, arachnids, and plants have holocentric centromeres (Drinnenberg et al. 2014; Monen et al. 2005; Melters et al. 2012). Instead of the more commonly-researched
monocentric architecture (one discrete region of CENP-A containing chromatin forming the foundation for one kinetochore per chromosome), holocentric organisms have CENP-A distributed along almost the entire length of the chromosome (Maddox et al. 2004; Steiner & Henikoff 2014). Nonetheless, centromere structure in mitosis, as well as the proteins involved in centromere/kinetochore regulation, are largely conserved, making this an excellent model to study centromere dynamics.
the beginning, middle, and end of a specific mitotic lineage (the germline descendants do not begin to enter meiosis until the L3 larval stage (Hansen et al. 2004)).
Our findings show that many of the canonical traits about CENP-A during cell cycles are
conserved in embryos; CENP-A levels halve during mitosis and are reconstituted during the following cell cycle, loading into chromatin is divorced from canonical histone loading, CENP-A is not rapidly turned-over throughout the cell cycle, and disruption of the chromatin licenser, KNL-2, significantly reduces CENP-A loading. We also find important exceptions to the current dogma; CENP-A levels decrease every subsequent cell cycle instead of returning to the level at the previous cell cycle, nuclear accumulation and signal recovery rates decrease throughout development, and levels (and stability) significantly drop upon mitotic exit. Overall, we show that centromere regulation in early C. elegans development is a refined version of that observed in tissue culture and that study in other developmental, differentiating systems is critical in the future.
RESULTS
Absolute nuclear CENP-A levels and nuclear accumulation rates decrease throughout early development.
In order to measure CENP-A (and therefore centromere) inheritance in the context of a
developing embryo, we adapted a technique used in previous lineage analysis (Smith & Maddox 2018). Briefly, we used high resolution, multidimensional confocal imaging of a strain that expressed
GFP::CENP-A from an endogenous promoter and covering a homozygous deletion of the HCP-3 gene, while co-expressing mCherry::H2B (from a germline promoter (pie-1) (Gassmann et al. 2012)).
centromeric loci must occur either late in S-phase or G2 of the cell cycle unlike that reported for human tissue culture cells (see below).
Figure 9: Controls of CENP-A.
Similar channels scaled identically. Depletion of HCP-3 via feeding RNAi (top) causes significant loss of GFP::CENP-A in early OD421 embryos (not shown) and the germline compared to controls (bottom).
embryos as our baseline histone number (Gassmann et al. 2012). These values were calculated using the values in Table 4.
Figure 10: CENP-A nuclear dynamics have both conserved and novel characteristics.
(A-B) Experimental values of GFP::CENP-A (green circles) and mCherry::H2B (magenta line). All data normalized at *. Experimental data of the primary arrangement of P-lineage. Timepoints are 2-minutes apart. Grey column represents approximate time of NEBD. Small triangle indicates alignment point. Experimental 1averages and standard deviations are plotted. (A) P-lineage experimental data plotted. (*) is the first timepoint of P3. (B) E-lineage (left) and AB-lineage (right) experimental data plotted. (*) is first timepoint of E and ABa respectively. (C) Last timepoint of each cell cycle from Figure 1A-B each