THE INFLUENCE OF TRAINING LOAD ON MUSCULOSKELETAL INJURY RISK VARIABLES, OBJECTIVE FATIGUE, SUBJECTIVE WELL-BEING, AND
PERFORMANCE IN BASEBALL ATHLETES
Brett Steven Pexa
A dissertation submitted to the faculty of The University of North Carolina at Chapel Hill in partial fulfillment of the requirements for the degree of Doctor of Philosophy in the
Curriculum of Human Movement Science in the School of Medicine.
Chapel Hill 2019
iii ABSTRACT
Brett Steven Pexa: The Influence of Training Load on Musculoskeletal Injury Risk Variables, Objective Fatigue, Subjective Well-Being, and Performance in Baseball
Athletes
(Under the direction of Eric D. Ryan and Joseph B. Myers)
Baseball’s unique sport demands lead to a high prevalence of time-loss injuries. Previously identified injury risk factors in baseball include decreased shoulder strength, decreased shoulder range of motion, increased self-reported fatigue, excessive
participation and limited rest and recovery. Sport participation may be monitored via training loads, which longitudinally track the physical work performed and the perception of difficulty of activity to identify when excessive participation occurs. Excessively high training loads and large changes to training loads influence injury risk in field sports, but there is no evidence in baseball players to indicate if training loads influence changes to musculoskeletal variables linked to injury. The purpose of this research study was to determine the influence of training load on musculoskeletal injury risk variables,
iv
specific training load has significant effects on subjective well-being measures, including weekly average readiness, weekly average stress, and weekly average soreness.
v
TABLE OF CONTENTS
LIST OF FIGURES... xii
LIST OF TABLES ... xv
LIST OF ABBREVIATIONS ... xvii
CHAPTER 1: INTRODUCTION ... 1
Baseball Specific Injury Risk Factors ... 1
Training Load Assessments ... 4
Statement of Purpose ... 7
Operational Definitions ... 7
Specific Aims and Hypotheses... 8
Specific Aim 1 ... 8
Specific Aim 2 ... 9
Specific Aim 3 ... 9
Specific Aim 4 ... 10
Independent Variables ... 10
Specific Aim 1 and 2 ... 10
Specific Aim 3 and 4 ... 11
Dependent Variables ... 11
Specific Aim 1 ... 11
Specific Aim 2 ... 11
vi
Specific Aim 4 ... 12
Delimitations ... 12
Assumptions ... 12
CHAPTER 2: LITERATURE REVIEW ... 14
Baseball Epidemiology ... 15
Common Injuries and Etiology ... 16
Injuries to the Elbow ... 17
Injuries to the Shoulder ... 18
Injuries to the Lower Extremity ... 19
Sport Demands of Baseball ... 21
Intrinsic Injury Risk Factors and Risk Factor Development ... 24
Altered Range of Motion ... 24
Strength Deficits ... 27
Extrinsic Risk Factors ... 30
Excessive Participation ... 30
Insufficient Rest and Recovery... 31
Self-Reported Fatigue ... 32
Training Load ... 33
External Load ... 34
Internal Load and Total Load ... 36
Acute to Chronic Workload Ratio ... 38
Subjective Athlete Reported Well-Being ... 39
vii
Range of Motion ... 41
Shoulder Strength ... 42
Countermovement Jump Test ... 42
Single Leg Bridge Test ... 43
Trackman Assessment ... 43
Training Load ... 44
Clinical Significance ... 44
CHAPTER 3: METHODS ... 46
Overview ... 46
Population and Recruitment ... 47
Research Design... 48
Procedures ... 48
Demographics and Injury History ... 49
Musculoskeletal Injury Risk Variables Assessment ... 49
Objective Fatigue Assessments ... 56
Subjective Well-being Assessment ... 59
Training Load Assessment ... 59
Baseball Performance Assessments ... 61
Data Reduction ... 62
Glenohumeral and Grip Strength ... 62
Countermovement Jump Test ... 62
Training Load ... 63
viii
Missing Data ... 64
Statistical Analyses ... 65
CHAPTER 4: RESULTS ... 69
Demographics ... 69
Data Characteristics ... 69
Specific Aim 1: Musculoskeletal Injury Risk Variables ... 70
Percent Change in TROM ... 70
Percent Change in External Rotation Strength ... 72
Percent Change in Internal Rotation Strength ... 74
Overhead Reach Tests ... 76
Behind the Back Reach Test ... 78
Single Leg Bridge Test ... 80
Specific Aim 1 Summary ... 82
Specific Aim 2: Musculoskeletal Fatigue Outcomes ... 84
Grip Strength ... 84
Countermovement Jump Height... 85
Countermovement Jump Power ... 86
Specific Aim 2 Summary: ... 89
Specific Aim 3: Subjective Well-Being ... 89
Average Weekly Readiness ... 90
Average Weekly Fatigue ... 91
Average Weekly Stress ... 92
ix
Specific Aim 3 Summary: ... 96
Specific Aim 4: Baseball Performance ... 97
Fastball velocity ... 97
Fastball Spin Rate ... 98
Exit Velocity ... 99
Specific Aim 4 Summary ... 101
Future Research ... 101
Limitations ... 102
Clinical Application ... 104
Conclusions ... 106
CHAPTER 5: MANUSCRIPT 1 ... 108
Overview ... 108
Introduction ... 110
Methods and Materials ... 112
Results ... 120
Discussion ... 124
CHAPTER 6: MANUSCRIPT 2 ... 130
Overview ... 130
Introduction ... 132
Methods ... 135
Results ... 143
Discussion ... 147
x
CHAPTER 7: MANUSCRIPT 3 ... 153
Overview ... 153
Introduction ... 155
Methods ... 157
Results ... 163
Discussion ... 172
Conclusions ... 177
APPENDICES ... 178
Appendix 1. Demographics and Injury History ... 179
Appendix 2. Daily Baseball Readiness Survey ... 186
Appendix 3. Daily Training Load Assessment Survey ... 193
Appendix 4: Physical Variables over Time ... 197
xi
LIST OF FIGURES
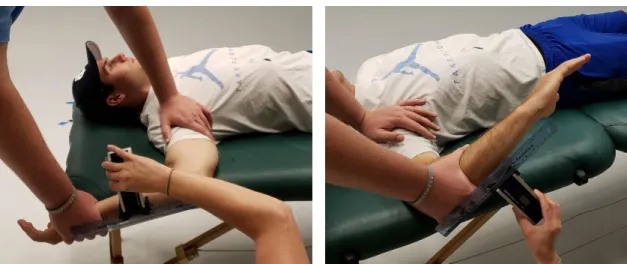
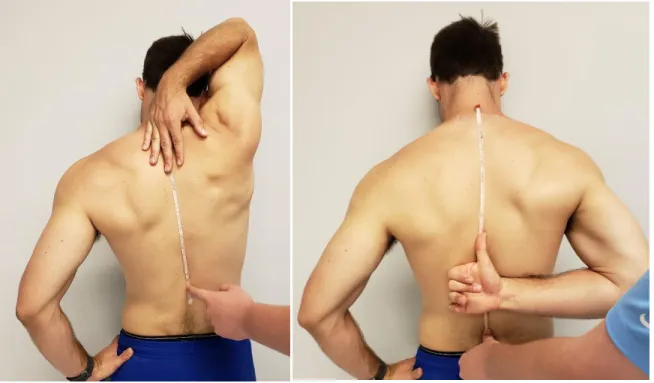
Figure 1. Research Schedule ... 47 Figure 2. Glenohumeral rotational range of motion assessment method. ... 50 Figure 3. Functional reach test assessment method. Left: Overhead
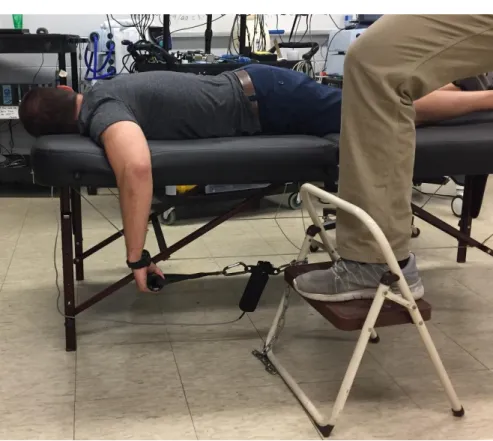
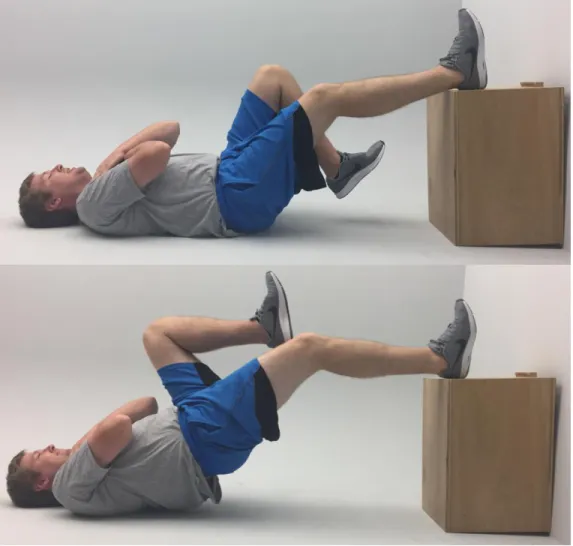
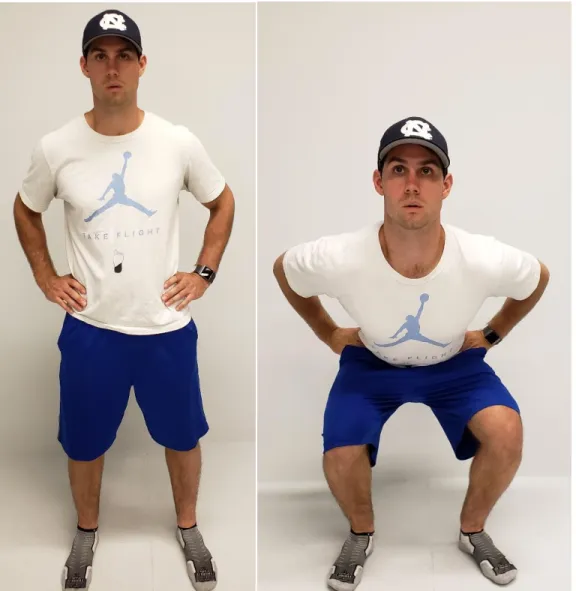
Reach Test. Right: Behind the Back Reach Test ... 52 Figure 4. Glenohumeral rotation strength assessment method ... 54 Figure 5. Single Leg Bridge Test rest position (top) and ending position
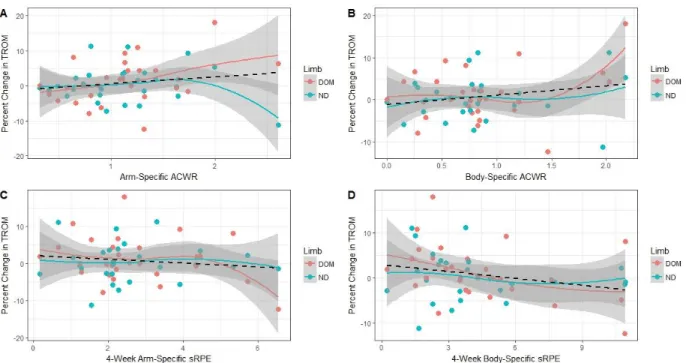
(bottom). ... 55 Figure 6. Grip strength assessment postures ... 57 Figure 7. Starting and loading position of the CMJ test. ... 58 Figure 8. Training Load and percent change in TROM by limb. Linear line
of best fit is represented as the dotted black line. (A) Arm-specific ACWR, (B) specific ACWR, (C) Arm-specific cumulative sRPE, (D)
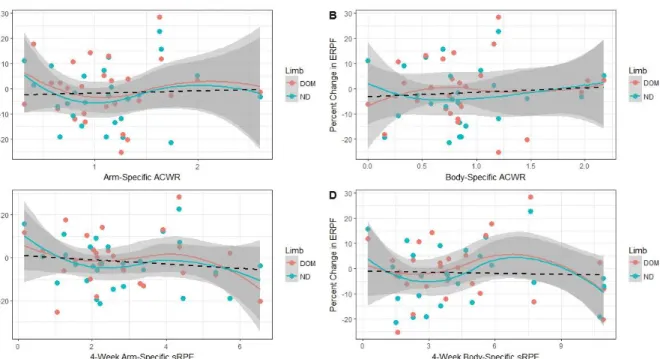
Body-specific cumulative sRPE. ... 70 Figure 9. Training load and percent change in ERPF across limbs. Linear
line of best fit is represented as the dotted black line. (A) Arm-specific ACWR, (B) Body-specific ACWR, (C) Arm-specific cumulative sRPE, (D)
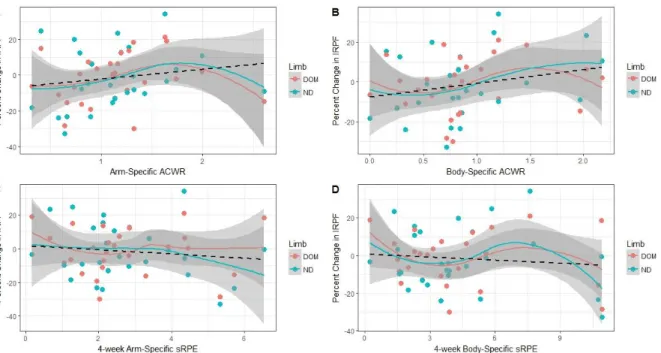
Body-specific cumulative sRPE. ... 72 Figure 10. Training load and percent change in IRPF across limbs. Linear
line of best fit is represented as the dotted black line. (A) Arm-specific ACWR, (B) Body-specific ACWR, (C) Arm-specific cumulative sRPE, (D)
Body-specific cumulative sRPE. ... 74 Figure 11. Training load and percent change in OHRT across limbs.
Linear line of best fit is represented by the dotted black line. (A) Arm-specific ACWR, (B) Body-Arm-specific ACWR, (C) Arm-Arm-specific cumulative
sRPE, (D) Body-specific cumulative sRPE. ... 76 Figure 12. Training load and percent change in BBRT across limbs.
Linear line of best fit is represented by the dotted black line. A) Arm-specific ACWR, B) Body-Arm-specific ACWR, C) Arm-Arm-specific cumulative
sRPE, D) Body-specific cumulative sRPE. ... 78 Figure 13. Training load and percent change in SLBT across limbs. Linear
line of best fit is represented by the dotted black line. A) Arm-specific ACWR, B) Body-specific ACWR, C) Arm-specific cumulative sRPE, D)
xii
Figure 14. Training load and percent change in grip force across limbs. Linear line of best fit is represented by the dotted black line. A) Arm-specific ACWR, B) Body-Arm-specific ACWR, C) Arm-Arm-specific cumulative
sRPE, D) Body-specific cumulative sRPE. ... 84 Figure 15. Training load and percent change in jump height. Linear line of
best fit is represented by the dotted black line. A) Arm-specific ACWR, B) Body-specific ACWR, C) Arm-specific cumulative sRPE, D) Body-specific
cumulative sRPE ... 85 Figure 16. Training load and percent change in jump power. Linear line of
best fit is represented by the dotted black line. A) Arm-specific ACWR, B) Body-specific ACWR, C) Arm-specific cumulative sRPE, D) Body-specific
cumulative sRPE ... 86 Figure 17. Training load and average weekly readiness. Linear line of
best fit is represented by the dotted black line. A) Arm-specific ACWR, B) Body-specific ACWR, C) Arm-specific cumulative sRPE, D) Body-specific
cumulative sRPE ... 90 Figure 18. Training load and average weekly fatigue. Linear line of best fit
is represented as the dotted black line. A) Arm-specific ACWR, B) Body-specific ACWR, C) Arm-Body-specific cumulative sRPE, D) Body-Body-specific
cumulative sRPE ... 91 Figure 19. Training load and average weekly stress. Linear line of best fit
is represented by the dotted black line. A) Arm-specific ACWR, B) Body-specific ACWR, C) Arm-Body-specific cumulative sRPE, D) Body-Body-specific
cumulative sRPE ... 92 Figure 20. Training load and average weekly soreness intensity. Linear
line of best fit is represented by the dotted black line. A) Arm-specific ACWR, B) Body-specific ACWR, C) Arm-specific cumulative sRPE, D)
Body-specific cumulative sRPE. ... 93 Figure 21. Training load and percent change in fastball velocity. Linear
line of best fit is represented by the dotted black line. A) Arm-specific ACWR, B) Body-specific ACWR, C) Arm-specific cumulative sRPE, D)
Body-specific cumulative sRPE ... 97 Figure 22. Training load and percent change in fastball spin rate. Linear
line of best fit is represented by the dotted black line. A) Arm-specific ACWR, B) Body-specific ACWR, C) Arm-specific cumulative sRPE, D)
Body-specific cumulative sRPE ... 98 Figure 23. Training load and percent change in exit velocity. Linear line of
xiii
Body-specific ACWR, C) Arm-specific cumulative sRPE, D) Body-specific
cumulative sRPE ... 99 Figure 24. Glenohumeral rotational range of motion assessment method. ... 114 Figure 25. Glenohumeral rotation strength assessment method ... 116 Figure 26. Percent change in TROM by limb and loading group. A)
Arm-specific ACWR, B) Arm-specific ACWR, C) Arm-Arm-specific sRPE, D)
Body-specific sRPE ... 121 Figure 27. Percent change in ERPF by limb and loading group: A)
Arm-specific ACWR, B) Arm-specific ACWR, C) Arm-Arm-specific sRPE, D)
Body-specific sRPE. ... 123 Figure 28. Percent change in IRPF by limb and loading group: A)
Arm-specific ACWR, B) Body-Arm-specific ACWR, C) Arm-Arm-specific cumulative
sRPE, D) Body-specific cumulative sRPE. ... 124 Figure 29. Functional reach test assessment method. Left: Overhead
Reach Test. Right: Behind the Back Reach Test ... 137 Figure 30. Grip Strength assessment postures. ... 139 Figure 31. Percent change in Overhead Reach Test by loading group and
by limb. (A) specific ACWR, (B) Body-specific ACWR, (C)
Arm-specific cumulative sRPE, (D) Body-Arm-specific cumulative sRPE.\ ... 144 Figure 32. Percent change in BBRT by loading group and limb. (A)
Arm-specific ACWR, (B) Body-Arm-specific ACWR, (C) Arm-Arm-specific cumulative
sRPE, (D) Body-specific cumulative sRPE. ... 146 Figure 33. Percent change in grip strength by loading group and limb. (A)
Arm-specific ACWR, (B) Body-specific ACWR, (C) Arm-specific
xiv
LIST OF TABLES
Table 1. Model parameters from statistical analyses between percent change in TROM and training load. Upper bound and lower bound
represent the 95% confidence interval of the parameter estimate. ... 71 Table 2. Model parameters from statistical analyses between percent
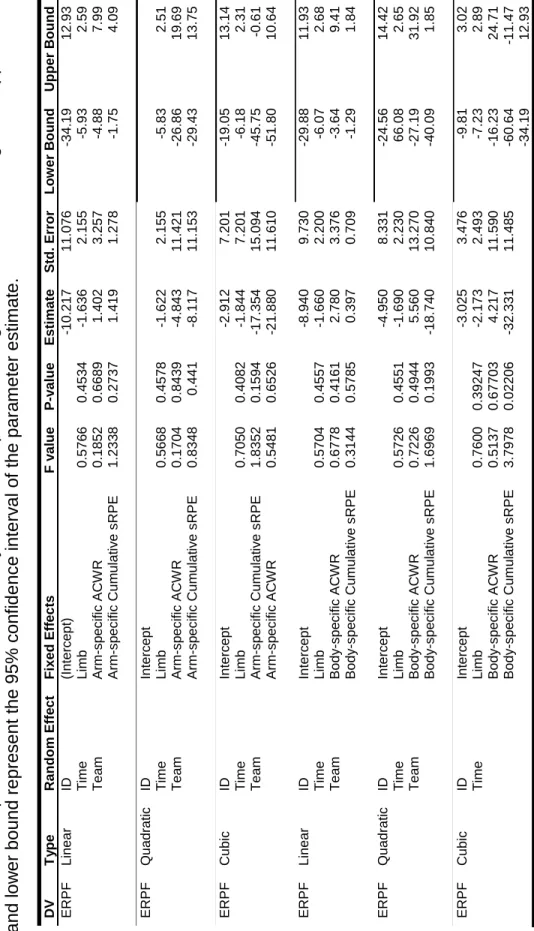
change in ERPF and training load. Upper bound and lower bound
represent the 95% confidence interval of the parameter estimate. ... 73 Table 3. Model parameters from statistical analyses between percent
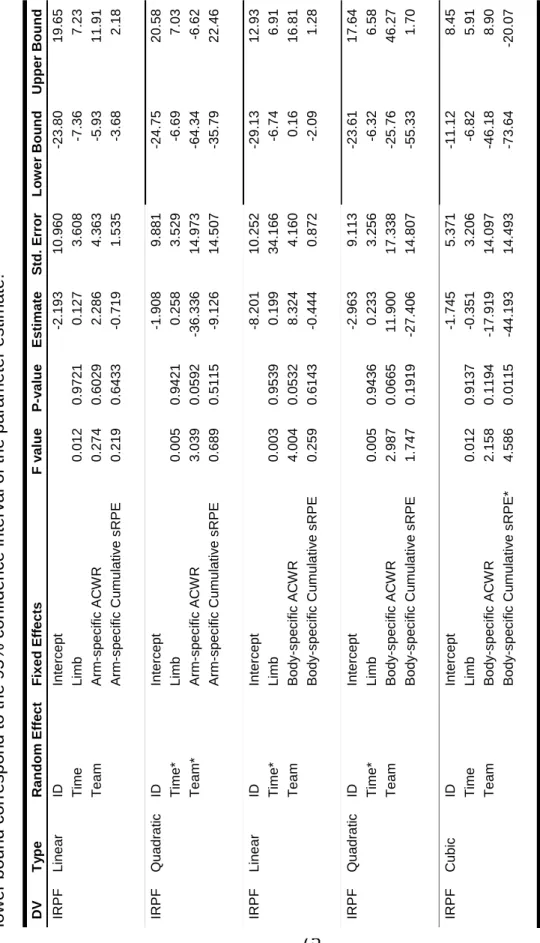
change in IRPF and training load. Upper bound and lower bound
correspond to the 95% confidence interval of the parameter estimate. ... 75 Table 4. Model parameters from statistical analyses between percent
change in OHRT and training load. Upper bound and lower bound
correspond to the 95% CI for the parameter estimate. ... 77 Table 5. Model parameters from the statistical analyses between percent
change in BBRT and training load. Upper and lower boundaries
correspond to the 95% confidence interval for the parameter estimate ... 79 Table 6. Model parameters from the statistical analyses between percent
change in SLBT and training load. Upper and lower boundaries
correspond to the 95% confidence interval for the parameter estimate... 81 Table 7. Model parameters from the statistical analyses between percent
change in grip strength and training load. Upper and lower boundaries
correspond to the 95% confidence interval for the parameter estimate... 87 Table 8. Model parameters from the statistical analyses between percent
change in the countermovement jump variables and training load. Upper and lower boundaries correspond to the 95% confidence interval for the
parameter estimate. ... 88 Table 9. Model parameters from the statistical analyses between average
weekly readiness and training load. Upper and lower boundaries
correspond to the 95% confidence interval for the parameter estimate... 94 Table 10. Model parameters from the statistical analyses between
average weekly fatigue and training load. Upper and lower boundaries
correspond to the 95% confidence interval for the parameter estimate... 94 Table 11. Model parameters from the statistical analyses between
average weekly stress and training load. Upper and lower boundaries
xv
Table 12. Model parameters from the statistical analyses between
average soreness intensity and training load. Upper and lower boundaries
correspond to the 95% confidence interval for the parameter estimate ... 95 Table 13. Model parameters from the statistical analyses between percent
change in baseball performance variables and training load. Upper and lower boundaries correspond to the 95% confidence interval for the
parameter estimate ... 100 Table 14. Descriptive group training load statistics. Data is presented as
mean ± SD. All data present in arbitrary units (AUs) ... 121 Table 15. Descriptive group training load statistics. Data is presented as
mean ± SD. All data present in arbitrary units (AUs) ... 143 Table 16. Descriptive Statistics for baseball specific training load and
subjective well-being. Data is presented as mean ± standard deviation. ... 163 Table 17. Model parameters from the statistical analyses between
average weekly readiness and training load. ... 165 Table 18. Model parameters from the statistical analyses between
average weekly fatigue and training load. ... 167 Table 19. Model parameters from the statistical analyses between
average weekly stress and training load. ... 169 Table 20. Model parameters from the statistical analyses between
xvi
LIST OF ABBREVIATIONS ACWR—Acute-to-Chronic Workload Ratio
BBRT—Behind the Back Reach Test CMJ—Countermovement Jump
ERPF—Glenohumeral External Rotation Peak Force ERG—External Rotation Gain
FB—Fastball
GIRD—Glenohumeral Internal Rotation Deficit HHD—Handheld Dynamometer
ID—Subject Identification
IRPF—Glenohumeral Internal Rotation Peak Force LOWESS—Locally Weighted Scatterplot Smoothing OHRT—Overhead Reach Test
RPE—Rating of Perceived Exertion
SLAP—Superior Labrum, Anterior to Posterior SLBT—Single Leg Bridge Test
sRPE—Session Rating of Perceived Exertion
sRPEArm—Daily Arm-Specific Session Rating of Perceived Exertion sRPEBody—Daily Body-Specific Session Rating of Perceived Exertion TROM—Total Rotational Range of Motion
1
CHAPTER 1: INTRODUCTION
Baseball participation has increased at the amateur level over the last 6 years.1–3 The rise in participation is accompanied by an increase of injury, with more injuries being recorded over this time in amateur and professional baseball players.4,5 Pitchers specifically are at a high risk of injury, with up to 27% of pitchers reporting an injury during their career.6,7 Many of these injuries require significant time lost from
participation,5,8–10 and the average amount of time lost is between 21-53 days.9,11,12 Recent evidence suggests that ulnar collateral ligament (UCL) injury rates have grown at a yearly rate of 9% in youth and adolescent athletes.13 In addition to the high rate of upper extremity injuries in pitchers,5,12 all baseball players regardless of position, may be at risk for time-loss injuries to the lower extremity and trunk.5,10 Approximately 25% of injuries in pitchers and 60% of injuries in fielders affect the lower extremity and trunk regions.9 In fielders, there is a high prevalence of hamstring injuries and hip/groin pathology that develops from non-contact mechanisms.10,11 Baseball sport demands include running, fielding, hitting and throwing, but due to the frequency and time loss concerns of upper extremity injuries, research focuses on the throwing motion as a primary mechanism of injury in the upper and lower extremities.
Baseball Specific Injury Risk Factors
2
movements and high joint loads.14–16 During the throwing motion, baseball players create angular velocities exceeding 3600 degrees per second at the elbow and 7000 degrees per second at the shoulder,17–20 which are considered to be some of the fastest movements in sport. These high angular velocities lead to very high joint loads, which reach elbow varus torques of over 90 Nm19–21 and shoulder proximal forces up to 1.5 times body weight.15,16,20,22 To assist with joint stabilization, considerable activation of contractile tissue is required at the shoulder23 and elbow24–27 during the throwing motion, leading to changes in range of motion, 28–30 strength,31 muscle morphology,28,32 and self-reported pain and fatigue following activity.32,33 These changes are consistent with results from laboratory-based muscle fatigue and damage studies.34–36 Decreased strength, range of motion, and self-reported pain and fatigue demonstrate a return to a baseline state within 3 days of baseball participation.28,30,32 Participation prior to full musculoskeletal recovery may lead to an accumulation of negative changes. This is problematic, as these changes have been identified as baseball specific injury risk factors.37–44
3
motion, as it accounts for humeral torsion48,49 and is linked to throwing injury.37–40 Glenohumeral total range of motion deficits of over 5 degrees between the dominant and non-dominant arm have been linked to injury in prospective and case-control studies.37–40 Dominant arm strength deficits may also increase injury risk, as evidence suggests rotator cuff strength at the preseason is related to throwing injuries during the subsequent year.41–44 It is hypothesized that range of motion and strength deficits develop from repetitive microtrauma to the musculoskeletal system during the throwing motion.29,50 The repeated nature of baseball throwing causes this microtrauma to accumulate, leading to changes within the glenohumeral soft tissue that manifest as changes to strength and range of motion.32,51 Participation habits are very important to monitor, as excessive throwing or improper recovery may lead to the accumulation of this repetitive microtrauma.
Excessive participation, inadequate rest and recovery between participation, and participation despite feeling fatigued are considered extrinsic injury risk factors in
baseball players.52,53 Previous research demonstrates injured baseball players throw more pitches per game, innings per game, pitches per year, innings per year, and
4
participation and limited recovery time could compound the effects of intrinsic risk factors, leading to further negative changes in previously compromised range of motion and strength.28 By monitoring the amount of participation and changes to intrinsic risk factors simultaneously, research may identify how extrinsic risk factors affect changes to musculoskeletal injury risk factors and objective measures of fatigue.
Training Load Assessments
Training load assessments aim to quantify sport participation by utilizing measures of internal and external load. Internal load is the physiologic reaction or
perception of training and is quantified via rating of perceived exertion (RPE), heart rate, volume of maximal oxygen uptake, and/or visual analog scale.61,62 External load is the physical work that is performed during exercise and can be measured in time, steps, mileage, speed of running, and/or total throws.63 Extrinsic risk factors in baseball can be considered external load measures, such as amount of throws per year, throws per game, or amount of competitions per year.54–56 The product of internal and external load is the total training load, which quantifies the overall load experienced by an athlete during the single bout of training,64 and is often expressed as session rating of
5
corresponds to higher tissue resiliency and higher aerobic capacity.62,66 Consecutive high external and/or internal loads will cause large increases in total training load, potentially increasing fatigue. High fatigue will lead to negative training effects, lower tissue resiliency, and decreased sport performance.62,66 High ACWR has identified those at risk for injury in cricket,65,68,70–72 Australian football,67,69 rugby,73 and soccer.74
6
fielders, monitoring external loads via throw counts and internal loads via sRPE may provide information regarding fatigue state.
Baseball participation causes a high burden of time-loss injury, so there exists a need to find innovative ways to limit injury risk. Repeated measures of intrinsic risk factors (glenohumeral range of motion and strength) may provide information regarding potential injury risk but requires significant time commitment and equipment that may not be present in amateur baseball settings. Objective fatigue measures, such as
countermovement jump and grip strength assessment, incorporate powerful movements to assess the force producing capability of contractile tissue and may provide
information about fatigue state.78–80 Training load assessments that incorporate external and internal load measures of baseball participation may provide significant utility, because of their cost-effectiveness and accessibility. Due to the unique sport demand, baseball specific training load assessments must be able to capture loads associated with throwing, hitting, running, and fielding. The development of a baseball specific training load model may lead to early identification of athletes at risk for injury, thereby allowing for early intervention to reduce the incidence of major time-loss injury.
7
Statement of Purpose
The purpose of this project is to determine how baseball-specific training load influences musculoskeletal injury risk variables, objective fatigue measures, subjective well-being measures, and performance variables in baseball players. The baseball specific training load assessment captures all aspects of baseball participation including throwing, hitting, fielding, running, weight training, and conditioning via a smartphone and/or computer-based survey that is easily accessible to baseball players. The baseball specific training load assessment provides information to coaches, players, parents, and clinicians regarding appropriate amount of training and participation. Additionally, the baseball specific training load assessment can be used to monitor baseball players return to throwing or hitting from long offseason breaks or return from injury.
Operational Definitions
Musculoskeletal Injury Risk Variables: Physical characteristics that are theorized to contribute to injury in baseball players. Variables included in this definition are glenohumeral total range of motion, glenohumeral overhead and behind the back functional reach tests, glenohumeral internal and external rotation peak force, and single leg bridge test.
Objective Fatigue Measures: Clinical tests used to determine the presence of neuromuscular fatigue as a result of physical activity. Variables included in this
8
Subjective Well-Being Measures: Self-reported reports of readiness, fatigue, stress, and soreness that result from physical activity.
Baseball Performance Variables: Baseball specific variables that contribute to the success of the individual at their respective position. For pitchers, these variables include weekly average fastball speed and weekly average fastball spin. For position players, this definition includes weekly average exit velocity on balls hit in the field of play.
Baseball-specific training load: Baseball-specific training variables that quantify baseball participation from both an arm-specific and total body perspective. This includes throw count, duration of all baseball activity, arm-specific RPE, and total body RPE.
Specific Aims and Hypotheses
Specific Aim 1
To determine the association between baseball specific training load (arm-specific and body-(arm-specific 4-week cumulative sRPE and ACWR) and percent change from baseline of musculoskeletal injury risk variables (glenohumeral total range of motion, glenohumeral rotational strength, functional reach tests, single leg bridge test) in collegiate baseball players.
9
decreased glenohumeral range of motion, glenohumeral strength, functional reach test, and single leg bridge repetitions from baseline.
Specific Aim 2
To determine the association between baseball specific training load (arm-specific and body-(arm-specific 4-week cumulative sRPE and ACWR) and percent change from baseline of objective fatigue measures (countermovement jump height and power and grip strength) in collegiate baseball players.
Hypothesis 2: There will be a negative relationship between baseball specific training load and objective fatigue measures percent change from baseline. This indicates that athletes with high cumulative total loads and high ACWR will demonstrate decreased performance in the countermovement jump (decreased jump height and power) and the grip strength assessment (decreased peak grip strength).
Specific Aim 3
To determine the association between baseball specific training load (arm-specific and body-(arm-specific 4-week cumulative sRPE and ACWR) and subjective well-being measures (1-week averages of reported readiness, reported fatigue, self-reported soreness, self-self-reported stress) in collegiate baseball players.
Hypothesis 3: There will be a negative relationship between baseball specific training load and subjective well-being measures. This indicates that athletes with high
10 Specific Aim 4
To determine the association between baseball specific training load (arm-specific and body-(arm-specific 4-week cumulative sRPE and ACWR) and percent change from baseline in baseball performance measures (weekly average fastball speed, weekly average fastball spin, and weekly average exit velocity on balls hit in the field of play) in collegiate baseball participants.
Hypothesis 4: There will be a negative relationship between baseball specific training load and baseball performance measures. This indicates that athletes with high cumulative loads and high ACWR, will demonstrate outcomes associated with poor performance (negative change in fastball speed, negative change in fastball spin, and negative change in exit velocity on balls hit in the field of play).
Independent Variables
Specific Aim 1 and 2
• Arm-specific ACWR
• Body-specific ACWR
• Arm-specific cumulative sRPE
• Body-specific cumulative sRPE
• Limb
• Subject ID (random intercept)
• Team (random intercept)
11 Specific Aim 3 and 4
• Arm-specific ACWR
• Body-specific ACWR
• Arm-specific cumulative sRPE
• Body-specific cumulative sRPE
• Time
• Subject ID (random intercept)
• Team (random intercept)
Dependent Variables
Specific Aim 1
• Total rotation range of motion percent change
• Overhead reach test percent change
• Behind the back reach test percent change
• Internal rotation peak force percent change
• External rotation peak force percent change
• Single leg bridge repetitions percent change
Specific Aim 2
• Countermovement jump height percent change
• Countermovement jump power percent change
12 Specific Aim 3
• 1-week average self-reported readiness
• 1-week average self-reported fatigue
• 1-week average self-reported soreness
• 1-week average self-reported stress
Specific Aim 4
• Weekly average fastball speed percent change
• Weekly average fastball spin percent change
• Weekly average exit velocity on balls hit in the field of play percent change
Delimitations
Only highly competitive collegiate baseball players were included.
Assumptions
• Participants answered truthfully and honestly to the training load and readiness questionnaire, which will record the daily training load measures and self-reported well-being measures.
13
14
CHAPTER 2: LITERATURE REVIEW
Baseball popularity continues to increase, as sport participation has risen in amateur athletes over the past 6 years.2 With over 15.64 million participants age 6 and up,83 484,000 participants in the National Federation of State High School
Associations,2 and 36,000 participants in the National Collegiate Athletic Association,1 baseball is one of the top 3 most popular male sports at the youth, high school, and collegiate populations. Despite a growing body of evidence identifying baseball specific injury risk factors, a significant amount of time-loss injuries are still present in these athletes.5,9,10,84 Additionally, position statements and participation guidelines specifically recommend participation parameters in baseball to reduce the incidence of injury.85–88 The recommendations led to the development of USA Baseball’s PitchSmart
Guidelines, which aims to limit injury risk through age prescribed guidelines to
participation and rest. It is important to identify the relationship between participation habits and potential injury risk mechanisms in baseball players to understand how injuries develop as a result of excessive play or limited recovery. This literature review will discuss current baseball epidemiology, common injuries that affect baseball players, and the sport demands of baseball. Injury risk factors of throwing injuries will be
15
Baseball Epidemiology
Baseball is a non-contact sport leading to low frequency of injuries, but a high prevalence of time-loss injuries. Injury rates in baseball range from 0.7 – 3.61 injuries per 1000 athlete exposures9,89–91 or 1.79 injuries per 10 games.8 Baseball’s unique sport demands create a higher frequency of injuries in the upper extremity,8–11 with pitchers at a higher risk of upper extremity injury than their position-playing
counterparts.6,7,10,11,90,92 Despite the low frequency of overall injury compared to other sports, many of these injuries are considered severe and require extended time lost from sport.7,9,10 Injuries such as ulnar collateral ligament tears at the elbow and labral tears at the shoulder require surgical intervention, requiring between 13 and 20 months removed from sport.93,94 Non-surgical injuries still create significant time loss in sport, as recent evidence suggests that an average injury in baseball causes between 16-24 days missed per injured player.10,11 Baseball schedules are often created with limited days between games, resulting in significant amount of missed playing time due to injury. In Major League Baseball, the average season long cost of replacing injured players was over 420 million dollars.5 Although evidence suggests a higher amount of upper extremity injuries, the burden of core and lower extremity injuries should not be ignored. Up to 25% of pitcher injuries and 60% of position player injuries affect the core or lower extremity.9 Hamstring strains are currently the most common injury in baseball players.11 Other common baseball injuries to the lower extremity are abdominal strains, oblique injuries, and hip/groin pathology.9,11
16
shoulder or the elbow during throwing.55,56,59,60,95,96 In addition, 80% of all pitchers indicate that they experience feeling pain in their throwing arm on the day after
throwing,6 which is likely a severe sensation of muscular soreness. Significant soreness could be present in muscles for up to 3 days following activity.34,58 Soreness could be linked to changes of intramuscular composition, as increased muscle volume could compress nociceptors and cause increased sensations of pain and pressure.97 Soreness is a key symptom of muscle damage and should be considered a main outcome when assessing muscle fatigue and damage.34,58,98 Erickson et al.33 demonstrates that symptoms of pain and soreness also increase as pitch count increases, indicating a link between the two that may provide information about the presence of muscle damage and fatigue in baseball players. Evidence suggests that significant microtrauma may result from cumulative throwing, causing high reports of pain and soreness consistent with muscle damage studies.6,33 The mismanagement of the repetitive microtrauma, either from high frequency of participation or lack of recovery following participation, is likely to contribute to upper extremity injury.86,87,99
Common Injuries and Etiology
Baseball injuries often affect the upper extremity due the high joint loads at the shoulder and elbow during the throwing motion. The upper extremity is placed under tremendous forces during throwing that often exceed physiologic limits of
non-17
contractile tissue, creating changes to the structure or function of the tissue, and likely leading to injury.27,102,103 It is important to consider common injuries at during baseball to assist in identifying how to prevent injury in this population.
Injuries to the Elbow
The elbow is a primary location of pain and injury in baseball players, with up to 47% of athletes reporting pain in their elbow during a competitive season.55,95,96 Elbow injury requires significant time lost, as ulnar collateral ligament tears can require beyond 9 months for recovery.104 The ulnar collateral ligament is the primary non-contractile structure that resists valgus stress.27 The valgus stress on the elbow during pitching is very high, spiking between 60-95Nm during the late-cocking phase of throwing.19,20,105 This is problematic for ulnar collateral ligament (UCL), as the maximal valgus stress that it can withhold is approximately 36Nm.106 The difference between these two forces is hypothesized to develop from the wrist and finger flexor muscle group, as they provide a dynamic internal varus torque to counteract the external valgus torque during
pitching.101–103,107 The repetitive nature of throwing may fatigue this muscle group, leading to decreased force producing capability and leading to higher stress on the
UCL.27,108 The forearm flexor group is also at risk for muscle tightness and strains,109,110
18
are likely to affect the growth plates of the arm,109 likely resulting in a change in humeral torsion over the career of the young athlete.111,112 Excessive throwing can irritate the medial physis; high amounts of tension at the medial elbow during pitching in addition to the forearm muscle activity can lead to significant irritation at the medial epicondylar growth plate, leading to a diagnosis of little league elbow.113
Injuries to the Shoulder
Labral tears are not uncommon in baseball players, as the glenohumeral joint moves through extreme ranges of motion during throwing. One of the more common shoulder labral injuries is a superior labral tear, anterior to posterior, commonly called a SLAP tear.95 These injuries occur at the insertion point of the biceps tendon via the superior glenoid labrum onto the superior glenoid tubercle.50 The biceps tendon is maximally wound during the late cocking and acceleration phase due to the external rotation occurring at the glenohumeral joint. Twisting of the biceps tendon causes
significant shearing forces to occur at the bone-labrum interface.50,114 The twisting of the biceps and associated shear stresses at the bone is termed the peel-back
19
during throwing may be a protective mechanism of the biceps-labral complex, as increased amounts of external rotation may lead to increased winding and shear stresses about the biceps-labral complex.50,114
Subacromial and internal impingement can occur in overhead throwers due to the soft tissue changes that result from throwing.47,115–117 Subacromial impingement is the pinching of structures beneath the acromial arch and the coracoacromial
ligament.118 Repeated throwing causes thickening of the posterior joint capsule, causing the humeral head to rise in the glenoid cavity.50,114 This repositioning reduces the
distance of the subacromial space, possibly compressing the structures below the
acromial arch.118 The compression of the contents in the subacromial space may lead to increased inflammation and swelling, further decreasing the amount of space within this already small area.119 Altered scapular kinematics are also implicated in subacromial impingement, as evidence suggests that scapular kinematics during functional
movements are altered in those with subacromial impingement.120,121 Posterior joint capsule contracture can also lead to internal impingement. Baseball players diagnosed with internal impingement present with posterior shoulder tightness, as indicated by decreased horizontal adduction and internal rotation range of motion.47 Internal impingement presents with pain in the posterior shoulder, especially during terminal external rotation of the shoulder, as this is the when the posterior joint capsule is pinched between the posterior glenoid rim and greater tubercle of the humerus.50,118 Injuries to the Lower Extremity
20
the most common in professional baseball being hamstring strains.11 Pitchers are more likely to sustain shoulder and elbow injuries due to the amount of throwing,5,123 but position players are more likely to sustain injuries to the lower extremity and core.9 Hamstring strains often develop from running mechanisms,124 an action that is inherent to baseball position players due to the demands of fielding and hitting. Previous
evidence suggests that hamstring strength is related to hamstring strain incidence.124– 126 Specifically, low eccentric hamstring strength is indicative of higher risk of hamstring injury.127 Previous evidence indicates that clinical measures of strength, such as the single leg bridge test, may identify those at risk for injury.125 Monitoring hamstring strength longitudinally may provide information regarding injury risk development in baseball position players, but may also provide an indication of lower extremity strength in baseball pitchers. The lower extremity is vital to the throwing motion, so monitoring lower extremity strength, either via specific strength testing or clinically feasible test such as the single leg bridge test and countermovement jump (CMJ), could provide information about fatigue state in the hamstring group.
The abdominal muscle group is also an area of injury for baseball players.122 Abdominal oblique injuries are still a significant source of time-loss injuries in both pitchers and hitters, with the average injury requiring over 22 days removed from sport.128 Abdominal muscle injuries demonstrated a significant upward trend from the 1990s to 2010,122 but recent evidence suggests that abdominal injuries have leveled out in recent years.128 The vast majority of these injuries occur to the contralateral side of the dominant arm and their dominant hitting side.122 Hitting and pitching were
21
explosive movement occurs in a rotational manner.129 Abdominal injuries are also most likely to occur within the first month of the season.122 Nealon et al.129 suggests that the overall deconditioning from the off-season and subsequent increase in activity intensity could be a contributing factor to abdominal oblique muscle injuries. Training load monitoring could provide a means to appropriately prescribe exercise to ensure that large increases in load do not occur, and therefore do not increase the injury risk of abdominal muscle injuries.
Sport Demands of Baseball
The baseball throwing motion is one of the fastest human movements ever recorded.130 Although often thought of as upper extremity oriented, the throwing motion is a total body movement131,132 that utilizes the summation of speed principle to
22
two commonly injured soft tissue structures at the shoulder and elbow. It is important to highlight the throwing motion as a potential mechanism of injury in baseball players.
The throwing motion can be broken down into 6 phases: wind-up, stride, cocking, acceleration, deceleration and follow-through.21,135 The wind-up and stride phases utilize very strong lower extremity muscles to create force at the lower extremity that will be transferred through the core and into the upper extremity.16,131 As the foot strides forward, the hip abductors push the body forward and move the body linearly towards the throwing target.130,140 As the front foot hits the ground, the ground reaction force moves up the lower extremity to begin hip rotation during the cocking phase.141 This ground reaction force under the stride leg better predicts throwing velocity,131 indicating the lower extremity’s contribution to throwing is more than just creating a linear
momentum towards home plate. After hip rotation, the upper torso begins to rotate,16 following by external rotation of the glenohumeral joint. During baseball pitching, the upper arm can externally rotate up to 180 degrees.15,16,142 At the late-cocking and early acceleration phase, the elbow valgus torque peaks up to 99 Nm.19,138,142 This torque is counteracted by the ulnar collateral ligament (UCL) and the bony congruency of the elbow, but a significant amount of internal varus torque is provided by the medial forearm muscles, primarily the wrist and finger flexors.102,103,108 Fatigue of these muscles could potentially place higher amount of stress on the UCL,27,102 leading to failure. The acceleration phase requires significant muscle activity of the rotator cuff to stabilize the humeral head during the high speed movement at the shoulder and
23
internally rotating at speeds up to 7500 degrees per second at the shoulder19,20 and 3200 degrees per second at the elbow.19
Ball release marks the end of the acceleration phase and the body moves into the deceleration phase. This is a critical part of the throwing motion,140 where the body must move from a concentric force producing action to an eccentric force dissipating action. The shoulder proximal load peaks during this phase, with joints loads up to 1.2 times body weight,16 or 1080 N.140 The rotator cuff, especially the infraspinatus, is highly eccentrically active to counteract the high shoulder proximal force.23 The repeated eccentric nature of baseball pitching causes significant trauma to the glenohumeral joint, leading to changes in glenohumeral internal rotation,28–30,143 shoulder strength,144 and rotator cuff muscle size.28,32,51 These changes are similar to those seen in muscle damage and fatigue studies, where evidence demonstrates significant changes to the musculoskeletal system, including decreased force production,34–36,58,98,145–147 change in range of motion,34,58,148–150 and change in muscle size36,145,146,150–152 and quality.34,36,58 The high velocity eccentric contraction paired with the repetitiveness of baseball
throwing is theorized to cause significant muscle disruption and fatigue to the posterior shoulder. Consistent baseball throwing leads to changes in the posterior shoulder and the upper extremity, as indicated by a change in posterior capsule thickness153 and increased humeral torsion about the arm.154
24
fast ball pitch.19 Instead, joint loads are more related to the effort of throwing, as higher effort throws lead to higher humeral internal rotation torque and normalized elbow valgus torque.138 The number of throws and the exertion of those throws are very important to monitor, as they may contribute to upper extremity joint loads and changes that occur due to those loads.
Intrinsic Injury Risk Factors and Risk Factor Development
Baseball specific injury risk factors have previously been identified in cross sectional, longitudinal, and prospective studies. Intrinsic injury risk factors, physical characteristics of the individual, likely develop as a product of the sport demands and the extrinsic risk factors, variables external to the individual. When a baseball player participates in sport, muscular trauma and stress occurs as a result of standard
participation and requires recovery before a subsequent bout. It is important to discuss intrinsic risk factors and how they develop to demonstrate the need for longitudinal assessments and activity tracking. The primary intrinsic injury risk factors are altered range of motion and decreased glenohumeral strength.
Altered Range of Motion
25
significant muscular demand,23,158 significant changes to the glenohumeral range of motion can occur following a single bout of activity28,29,143 as well as longitudinally over the course of a season.159,160 Excessive external rotation during the late cocking and acceleration phase leads to anterior joint capsule laxity,50 and the deceleration phase’s high eccentric activity causes thickening to the posterior capsule.50,161 Thickened posterior capsule corresponds with decreased internal rotation and decreased horizontal adduction.161
26
is most interesting about these studies is that TROM deficits have been linked to injury at the shoulder39 and at the elbow,38,45 indicating that significant changes in
glenohumeral TROM could have injurious effects at joints further down the chain. Assessing TROM also accounts for potential changes in bony adaptation that resulted from throwing. Humeral retrotorsion is significantly higher in the dominant limb of throwing athletes, and can influence the interpretation of range of motion measures.48 When using TROM, humeral torsion is accounted for in both the internal and external rotation range of motion, and therefore does not need to be measured to ascertain an accurate rotational range of motion measurement. 48 Finally, previous evidence suggests that humeral torsion does not change over the course of the year in high school baseball players,112 but range of motion does change over the course of a season.112,159,165 Since humeral torsion is unlikely to change over the course of the season or in skeletally mature individuals, changes due to excessive throwing are likely due to soft tissue changes and not bony adaptations.
27
Outside of the laboratory, there is significant evidence to suggest that there is a change in range of motion following sport participation. With regards to glenohumeral internal rotation range of motion, multiple studies have found a significant decrease in internal rotation range of motion immediately following and on the days following pitching.29,30,159,165,166 Kibler et al.143 and Reuther et al.30 demonstrated that internal rotation both decreased for up to 3 days following baseball pitching. The deceleration phase of throwing, where the posterior rotator cuff is highly eccentrically active to provide joint compression of the upper extremity, places high joint forces on the
posterior soft tissue of the shoulder.28,150 This stress may cause muscle tightness of the infraspinatus and teres minor, which will limit the amount of internal rotation in the following days. Additional baseball participation prior to full recovery may exacerbate the changes leading to an internal rotation range of motion decrease that could increase the risk of injury.28 In glenohumeral external rotation and total rotation range of motion, evidence suggests that there is a significant increase immediately following baseball pitching.28,33,165,166 These changes likely stem from the repeated stress of the layback position. The late cocking and early acceleration phases of pitching test the joint
capsule to its end ranges of motion. The stress of maximum external rotation winds the joint capsule as the humeral head creates a cam effect and stresses the anterior portion of the joint capsule.50,114 The repeated motions of baseball pitching may continually stress the anterior joint capsule, leading to more external rotation.
Strength Deficits
28
level results in significant muscle stress and fatigue. Muscles lose the ability to produce force and produce force quickly during times when muscle fatigue is present. This is the hallmark sign of fatigue. Strength decrements following muscle fatigue protocols can be up to 30% of peak force and last for up to 10 days.34,58 These decrements likely develop from the muscle disruption of eccentric muscle action,34,167 similar to the posterior
shoulder’s action during deceleration. Previous evidence suggests that higher rates of eccentric muscle activity lead to higher changes in strength and creatine kinase levels following eccentric activity.35 The high velocity of baseball throwing’s eccentric
contraction paired with the repetitiveness of the throwing motion is theorized to cause significant muscle disruption and fatigue to the posterior shoulder during baseball throwing.
29
Changes that occur as a result of activity could affect injury risk, as improper recovery could lead to continual strength changes. Overall, baseball players
demonstrate significant differences in muscle strength side-to-side at the glenohumeral and scapulothoracic joints.169–171 Baseball players demonstrate significantly higher peak torque and total work of the dominant arm internal rotators when compared to the non-dominant internal rotators.43,155,156,172 When comparing scapular stabilizing muscles, the dominant middle trapezius and lower trapezius demonstrate significantly higher peak torque on the dominant arm.43,156 There is conflicting evidence regarding strength in the external rotator group, with some evidence to suggest that external rotation
demonstrates lower peak torque in the dominant limb156,173 and other research suggesting higher peak torque in the dominant limb.43 These muscles are primarily responsible for the deceleration of the arm following ball release23,28,174 and significantly contribute to glenohumeral stability.139 A lack of control during the deceleration phase may lead to stress being placed on non-contractile tissue not used to high joint loading, as previous evidence indicates that a decrease in infraspinatus activity could lead to a loss in rotator cuff compression force.139 Lack of strength and/or low rate of force development could be detrimental for shoulder and elbow health. Evidence suggests that throwing arm internal and external rotation strength is significantly lower in the dominant arm of injured pitchers when compared to healthy controls.164 Preseason external rotation strength weakness could be predictive of injury, as pitchers with preseason external rotation weakness demonstrate higher rates of injury.41,44
30
supraspinatus strength was affected by total pitch volume during the season, with high volume pitchers demonstrating larger losses in peak force. External rotation and internal rotation decreased over the course of the season as well but was not affected by
volume. This study demonstrates the importance of quantifying load throughout an athletic calendar year to assist in identifying potentially pathologic changes. This study failed to account for non-competitive throws and a measure of perceived exertion, which could provide more evidence to indicate how strength responds to the physical work and physiological response of baseball participation.
Extrinsic Risk Factors
Extrinsic risk factors are non-physical external factors that may contribute to injury in baseball players. The upper extremity may be at higher risk of fatigue and physical changes as a result of sport participation, due to its lack of use during
ambulation.34 The primary extrinsic risk factors are excessive participation, lack of rest and recovery, and self-reported fatigue. These are all intertwined, as excessive
participation will lead to limited recovery time between practices and competitions. Decreased rest and recovery will lead to higher self-reported fatigue, as the body will not have enough time to repair damaged tissues which will lead to physical changes similar to intrinsic injury risk factors.
Excessive Participation
31
uninjured.54,56,175 Injured pitchers also demonstrate more throws per day than uninjured pitchers.24 With the increasing prominence of showcase baseball played outside of a high school season, research suggests that those who participate in showcase baseball are at higher risk of injury.54,59,95 Participating on multiple teams also increases the risk of injury, which is consistent with the prevalence of showcase baseball.6,59,95
While excessive pitching has previously demonstrated to be related to injury, some evidence also suggests that too little pitching is related to injury as well. Lyman et al.55 demonstrated that baseball pitchers who throw over 600 pitches in one year are at a higher risk of injury, and pitchers that threw under 300 pitches per year were at higher risk of injury. Pitchers who throw over 600 pitches in a year may be overplaying, as cumulative loads could overload the tissue to the point of injury. Pitchers who throw under 300 pitches per year may not have enough arm fitness to deal with standard pitching loads. This study highlights that excessive baseball participation is related to injury risk, but a lack of preparation and training may also be related to injury. It is important to track the amount of play that is taking place, but also the amount of training. Insufficient training may lead to a lack of conditioning, potentially increasing fatigue with just standard baseball participation.63
Insufficient Rest and Recovery
Limited recovery is problematic for baseball pitchers, as there is evidence to suggest that range of motion, 28–30,51,143 strength,31 and self-reported pain and fatigue33 demonstrate negative responses associated with injury following baseball pitching. Baseball participation prior to full recovery of these variables could lead to further
32
frequent of baseball participation. Baseball players who play on multiple teams are at higher risk of injury than those who do not play on multiple teams.6,59,95 Participating on multiple teams increases the overall load that a baseball athlete experiences, but also interferes with recovery, as the seasons often overlap. In addition, there is literature to suggest that fewer days of rest between pitching bouts may lead to higher rates of injury.175 With the addition of pitch count rules, required rest rules have been
implemented to ensure proper amount of rest between pitching bouts.3 While these rules were made with good meaning, many baseball pitchers play on multiple teams,6 making these rules difficult to enforce for a single individual. The addition of a training load tool would assist in tracking proper pitching guidelines as well as when rest should occur.
Self-Reported Fatigue
Self-reported fatigue is a primary risk factor of injury in baseball.54,56,59,60 Baseball pitchers who throw regularly with fatigue were 36 times more likely than those who did not pitch with arm fatigue.54 Previous evidence also suggests that those who pitch with arm tiredness are at 7.78 times higher risk of pain and 3.71 times higher risk of injury than those who pitched with no arm tiredness.60 Pitching with arm tiredness is
associated with shoulder injury in high school and adolescent baseball players.59 The presence of muscle fatigue in the shoulder may limit the ability to provide joint
33
these were measured with self-reported fatigue or arm tiredness. This variable should be collected in studies that aim to quantify fatigue, as it is considered a primary risk factor in baseball players.
Training Load
Athletes participate in training programs that alter frequency, duration, and intensity of exercise to enhance performance.177 These variables could have
considerable effects on injury risk in athletes.67,178 Large changes to the duration and intensity of training may lead to negative effects and overtraining,66,179 especially in the athlete that does not have adequate fitness developed, such as the preseason.68,92,180 Additionally, increasing the frequency of training could lead to insufficient rest and recovery times, dampening the positive effects of training and lead to overreaching.177 However, insufficient training reduces the opportunity for positive effects, limiting increases in performance and decreasing tissue resiliency.66,177 Thus it is important to appropriately prescribe frequency, duration, and intensity to enhance performance while still protecting against injury.66,177 Recent position statements indicate the importance of properly prescribing exercise training to ensure that overtraining does not occur.85,181
34
load, the subsequent total load measure better reflects the true load that the body is experiencing.183–187 Daily total loads can then be summed to assess the cumulative load that an individual is experiencing over a given period of time.67,188,189 While cumulative loads are associated with injury and performance, evidence indicates that large
changes to training load, including increases and decreases, are also related to injury risk.62,65 Training load variables have been linked to both injury and performance variables in sport, so there exists a need to quantify training loads in baseball players. Baseball’s unique sport demands may require alternative methods to properly assess the training load in the upper and lower extremity. Evidence suggests that load
monitoring is not well-developed in the upper extremity,61 so there exists a need to find innovative and feasible tools to monitor baseball specific training load.
External Load
35
Additionally, Colby demonstrated that a low 3-weekly sprint distance was associated with injury, suggesting that it may be a balance of overtraining and undertraining that contributes to injury.67 Specifically in overhead athletes, evidence suggests that external training loads have a relationship with upper extremity injury. Cricket bowlers with a high weekly training loads were at increased risk of injury when they performed over 203 deliveries per week.194 Hulin et al.65 examined cricket athletes, and demonstrated that those with high external training loads, measured in overs (throwing term in cricket), are associated with lower injury rates. Conflicting evidence suggests that when fast bowlers bowled more than 50 match overs in a 5 day period, there were at a 1.5 times higher risk of injury over the following month.72 These authors suggest that there is significant extended delay between high training loads and increased risk of injury in overhead athletes, suggesting that external training loads should be summed over the course of 4 weeks to understand the influence of high external loads on injury risk.71,72 It is
interesting to note that both high and low external training loads are associated with injury in athletic populations.
36
injury. The authors go on to state that those who throw under 300 pitches are likely undertrained and have not developed the fitness to deal with a subsequent throwing bout. These conclusions fit with previous evidence that suggests both insufficient and excessive training could lead to injury.62,66 Physical characteristics may also be related to excessive training load. McHugh et al.155 indicates that shoulder strength
demonstrates significant decreases when baseball pitchers throw over 400 pitches in a single season. External training loads demonstrate a consistent effect on injury risk and previously identified upper extremity injury risk factors. Unfortunately, recent evidence suggests that the reported external loads may not be the true load that baseball player’s experience. Zaremski et al.195 demonstrated that live game pitches only account for 57% of all throws made in any one game during a high school season. Warm-up throws, bullpen throws, and throws made between innings can all contribute to the overall throw count experienced by a pitcher. The total amount of throws may be even higher, as this study did not account for any throws before bullpen pitches. Warm-up throws, such as long toss or flat ground throwing, may be equally as taxing on the arm as throwing off a mound,19,20,196 so it is important to quantify non-game throws along with in-game
pitches. Additionally, this study failed to recognize throws from position players. While they experience injury at a lower rate than their pitching counterparts, upper extremity injuries are still present in position players.
Internal Load and Total Load
37
creatine kinase, and rating of perceived exertion (RPE).197 Although there is a
subjective nature to the measure, RPE was found to be a valid assessment of internal load when compared to blood lactate and heart rate.183,198,199 Foster et al. 64 further established the utility of RPE when recorded with duration of activity to create a measure termed session RPE (sRPE). This measure demonstrated significant association with Edwards and Bannister’s training impulse and average heart rate to measure training load during activity.64,186
38 Acute to Chronic Workload Ratio
Acute to Chronic Workload Ratio (ACWR) is a representative score of the most recent training against the amount of training that the participant has been performing over an extended period of time.63,204 A major benefit of the ACWR is that it can be modeled using measures of both internal and external loads. Acute loads are the short term quantification of training, and are designed to reflect the short term fatigue that an athlete may be experiencing.63 Chronic loads are derived over weeks or months, and reflect the fitness that the athlete has developed.63 Athletes develop fitness over time to increase tissue resiliency and provide a protective mechanism for the upcoming training bouts.66 A high chronic workload indicates that the athlete has created sufficient fitness to better handle subsequent high training bouts. Acute to chronic workload ratios are often expressed in arbitrary units, so an ACWR equal to 1.5 indicates that the athlete is currently experiencing an acute load that 50% higher than the chronic load, or fitness, that the athlete has developed. 63 High ACWR indicates that negative changes may occur as a result of the training bout, including compromised neuromuscular control or reduced tissue resilience.66
Previous evidence suggests that the ACWR is associated with injury.65,73,74,204–207 Hulin et al.65 demonstrated that a high ACWR value was associated with increased risk of injury when using external workloads in cricket athletes. When the ACWR value was between 1.23 and 1.61 arbitrary units (AUs), injury risk increased by 2.88 times.
39
injury risk, as those with ACWRs less than 0.85 are at higher risk than when compared to those that have 1.00 – 1.25.
Subjective Athlete Reported Well-Being
Physical training can have considerable effects on subjective well-being, including mood,208,209 psychological and emotional stress, 177,210–212 and feelings of fatigue and tiredness.177,210 Subjective surveys, such as the Profile of Mood States208,209 and the Recovery-Stress Questionnaire for Athletes211–213 have been used to quantify changes from activity in these multidimensional constructs. These constructs are difficult to quantify and can be derived from many different areas. For instance, stress can refer to physiologic, psychologic, mental, and emotional stress that causes
significant burden to athletes. Collectively, the symptoms can be referred to as
subjective well-being, as they provide significant information regarding the mental state of an athlete.
40
to injury, as they were elevated prior to injury.192 Similarly, decreased perceptions of recovery were related to the occurrence of illness.192 Finally, performance variables are also related to well-being, as self-reported fatigue, stress, and muscle soreness
accounted for 72% of the variance when predicting the change in competitive swimmer’s time-trial performance.216 Measures of stress ranked on a VAS from 1-5 were also significantly associated with higher game statistics in Australian football, indicating those with lower subjective stress demonstrated higher objective performance statistics.217 A recent systematic review suggests that subjective self-reported measures may be better indicators of fatigue and recovery than objective measures.210 It is
important to consider subjective well-being alongside objective measures, because current research indicates that subjective and objective fatigue measures are not as correlated as originally thinks.210 If subjective well-being assessments are able to provide additional information regarding general stress and fatigue, these assessments should be included as part of standard daily athlete monitoring.