Studying the role of Arp2/3 complex in cell migration
Congying Wu
A dissertation submitted to the faculty of the University of North Carolina at Chapel Hill in partial fulfillment of the requirements for the degree of Doctor in Philosophy in the Department of Cell Biology and Physiology.
Chapel Hill 2013
Approved by:
James E. Bear, PhD
Keith Burridge, PhD
Richard Cheney, PhD
Kenneth Jacobson, PhD
ii Abstract
CONGYING WU: Studying the role of Arp2/3 complex in cell migration (Under the direction of Dr. James E. Bear)
The actin cytoskeleton plays important roles in maintaining cell shape and mediating cell motility. Deregulation of actin dynamics occurs during pathological processes such as cancer metastasis, regeneration defects and developmental diseases. One specific form of actin cytoskeleton, the highly dynamic branched actin network, is critical for the formation and regulation of cell cortex and protrusions during cell migration and matrix degradation. The key nucleator for this branched actin network is the seven-protein Arp2/3 complex.
iii
fail to globally align focal adhesions suggesting that one principle function of lamellipodia is to organize cell-matrix adhesions in a spatially coherent manner.
Arp2/3-branched actin is critical for cell morphology and migration. However, perturbations and diseases affecting this network have phenotypes that cannot be fully explained by cell-autonomous effects. Using this stable Arp2/3 knockdown cell line, we also report the non-autonomous effects upon Arp2/3 depletion. We show that the main class of genes with altered expression levels was genes encoding secreted factors including chemokines, growth factors and matrix metaloproteases resembling the senescence associated secretory phenotype (SASP). These factors affect EGF chemotaxis in a non-autonomous way, resolving the recent contradictions about the role of Arp2/3 in chemotaxis. We indicate that these genes are targeted by NF-κB, via a CCM2-MEKK3 pathway that has been implicated in osmotic stress signaling. Thus, perturbations of Arp2/3 have potential non-autonomous effects which should be considered when evaluating diseases affecting the Arp2/3-actin cytoskeleton.
iv
Acknowledgements
I would like to first thank my advisor Dr. James Bear for the opportunity to work in his
lab. He has been a wonderful mentor ever since my rotation days in graduate school. He has
not only taught me how to do research, but also inspired me to embrace science.
I am also grateful to have amazing committee members Drs. Keith Burridge, Richard
Cheney, Steve Rogers, and Ken Jacobson. Their guidance and advice have helped in my
success as a graduate student. I would also like to thank all my collaborators especially Dr.
Jack Griffith for their support and help along the way.
I am thankful to be part of the Bear lab, having lots of fun with my dear labmates. I
v
Table of Contents
LIST OF FIGURES ... vi
LIST OF ABBREVIATIONS ... viii
CHAPTER 1. Introduction ... 1
2. Arp2/3 is critical for lamellipodia and response to extracellular matrix cues but is dispensable for chemotaxis ... 7
2.1 Summary ... 7
2.2 Introduction ... 8
2.3 Results... 11
2.4 Discussion ... 60
2.5 Materials and methods ... 69
3. Loss of Arp2/3 complex induces an NF-κB-dependent secretory response that leads to non-autonomous effects on chemotactic signaling ... 80
3.1 Summary ... 80
3.2 Introduction ... 82
3.3 Results... 85
3.4 Discussion ... 109
3.5 Materials and methods ... 113
vi
LIST OF FIGURES
Figure 1 Models showing chemotaxis vs haptotaxis ... 5
Figure 2 Characterization of p34-KDR cells ... 12
Figure 3 Generation of 2xKD cells ... 14
Figure 4 Characterization of 2xKD cells ... 16
Figure 5 Cell morphology is changed upon Arp2/3-depletion and can be rescued by microinjection of Arp2/3 complex ... 18
Figure 6 Electron-microscopy revealed altered leading edge actin structure in the absence of Arp2/3 complex ... 20
Figure 7 Loss of Arp2/3 activity leads to decreased cell migration speed ... 22
Figure 8 The residual motility in 2xKD cells relies on actin polymerization but not myosin contractility ... 24
Figure 9 Arp2/3-depleted cells show filopodia-driven cell motility ... 27
Figure 10 The set-up of chemotaxis devices ... 29
Figure 11 Arp2/3 complex depletion does not affect chemotaxis ... 31
Figure 12 Signaling is intact but morphology response is changes in 2xKD cells upon PDGF stimulation ... 34
Figure 13 Arp2/3depletion inhibits cell spreading... 37
Figure 14 Arp2/3 complex depleted cells do not show biphasic response to changing ECM ... 40
Figure 15 Arp2/3-depleted cells cannot respond to gradient changes in extracellular matrix ... 42
vii
adhesion properties ... 47 Figure 18 Difference in focal adhesion properties between control
and Arp2/3-depleted/inhibited cells ... 50 Figure 19 Determination of focal adhesion alignment index (FAAI ... 52 Figure 20 Focal adhesion orientation with time and segmentation
method for FAAI detection ... 55 Figure 21 Arp2/3 depletion leads to poor global alignment of focal adhesions ... 58 Figure 22 Conceptual model of cell motility events across length scales ... 68 Figure 23 Loss of Arp2/3-complex induced upregulation of secretory factors ... 86 Figure 24 Loss of Arp2/3-complex affects chemotaxis in a cell
non-autonomous way ... 90 Figure 25 Up-regutation of secretory pathways by Arp2/3-depletion
is regulated through NF-κB ... 93 Figure 26 Cmpd A reversed the effect of Arp2/3 loss on secretory factor
upregulation without affecting cell motility or morphology ... 95 Figure 27 NF-κB activation by loss of Arp2/3 activity is confirmed in
a zebrafish reporter line ... 97 Figure 28 p38MAPK is indirectly involved in regulating NF-κB upon loss
of Arp2/3 activity ... 89 Figure 29 MEKK3/CCM2 is regulating NF-κB activation upon loss of
Arp2/3 activity ... 102 Figure 30 CCM2 shows nuclear translocation upon Arp2/3 inhibition ... 104 Figure 31 Loss of Arp2/3 complex changes osmotic signaling ... 107 Figure 32 Graph illustrating the effects of Arp2/3-depletion on cell
viii
LIST OF ABBREVIATIONS
CP Compass Parameter
ECM Extracellular Matrix
EGF Epidermal growth factor
ELISA Enzyme-linked immunosorbent assay
FAAI Focal Adhesion Alignment Index
FAK Focal Adhesion Kinase
FMI Forward Migration Index
HGF Hepatocyte growth factor
KD Knock Down
KDR Knock Down-Rescue
PDGF Platelet-Derived Growth Factor
SASP Senescence Associated Secretory Phenotype
Chapter 1
Introduction
1.1 Mesenchymal cell migration
Cell migration is important throughout development and under normal physiological conditions. Deregulation of cell migration is associated with disease states such as cancer metastasis, developmental defects, abnormal wound healing and chronic immune diseases [1, 2].
2
1.2 Actin at the leading edge of migrating cells
When cells migrate on 2D surfaces, they send out protrusions in the forms of filopodia or lamellipodia, both of which are actin-rich structures. Filopodia mainly contain bundled actin filaments, nucleated by formins and crosslinked by actin bundling proteins such as villin, fascin and espin [6]. Lamellipodia on the other hand contain actin networks of a dendritic geometry. These branched actin filaments are primarily nucleated by the Arp2/3 complex and modified by other branch associated proteins such as type one coronins [7, 8]. The polymerization of leading edge actin is tightly regulated by multiple signaling pathways involving kinases, proteases and small GTPases. Crosstalks at different levels exist in this signaling network and the roles of the two major actin protrusions have not been thoroughly clarified before our study [9-11].
1.3 Arp2/3 complex overview
3
The Arp2/3 complex is highly conserved in virtually all eukaryotes [14]. Biochemical and structural studies show that the Arp2/3 complex binds existing actin mother filaments, and initiates daughter filaments as branches off of the mother filaments at a characteristic angle of 70° [15]. Ar p2/3 by itself is not a potent actin nucleator. The activity of Arp2/3 depends largely on its nucleotide status, its interaction with the nucleation promoting factors (NPFs) and its binding to actin mother filament [16, 17]. ATP binding to Arp3 has been shown to induce a global conformational change on the complex, and increase its affinity for NPFs [18]. NPFs interact with Arp2/3 and prime the complex for activation by inducing additional conformational change. The Arp2/3 complex is further activated upon binding to the actin mother filament. NPFs also deliver ATP-bound G-actin to Arp2 and Arp3 subunits for the initiation and polymerization of the daughter filaments. In addition, several classes of negative regulators of the Arp2/3 complex have been identified in the past few years, including GMF[19], Coronins 1B [8], Gadkin[20] and PICK1[21]. Arp2/3 complex activity may also be regulated via functional interactions with actin binding proteins such as capping protein, which promotes Arp2/3-mediated filament nucleation [22].
4 1.4 Directional cell migration
Random motility has important roles and is thought to allow cells to effectively sample their environment such as in the case of affinity maturation of B cells in the germinal center [27]. However, in vivo, cell migration is largely directional, as in the context of embryogenesis and wound healing. Cells can sense an extracellular cue, usually in a gradient, and signal to the cytoskeleton machinery, reorients the polarity and move towards (or against) the more concentrated cue. This directional migration involves not only complex cell motility machineries, but also intricate feedback loops in order to maintain directionality while being able to fine tune the signaling pathways under changing environment [28].
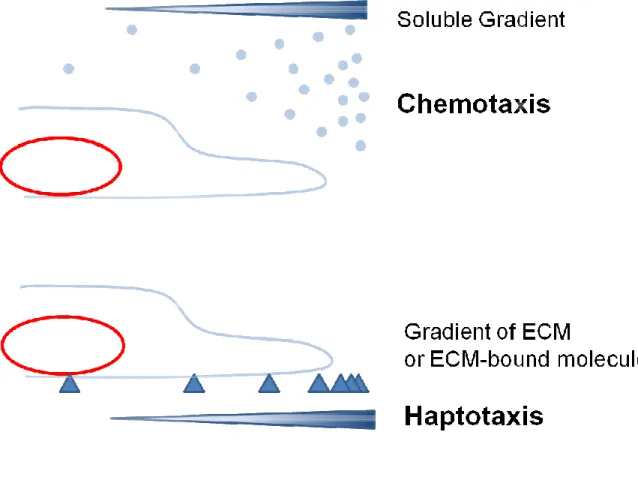
Figure 1 Models showing chemotaxis vs haptotaxis
Chemotaxis describes cell migration towards a gradient of soluble factors, such as growth factors. Haptotaxis describes cell migrat
gradient, such as a gradient of extracellular matrix, or a gradient of to the matrix.
5
Models showing chemotaxis vs haptotaxis
cell migration towards a gradient of soluble factors, such as growth factors. Haptotaxis describes cell migration up an insoluble and bound gradient, such as a gradient of extracellular matrix, or a gradient of molecules
6
1.5 Non-cell-autonomous effects of secretory factors
Perturbation of the cytoskeleton is tightly linked to abnormal cell migration [8, 32]. The direct or indirect autonomous effects of actin perturbation on cell motility have been reported in drug perturbation, genetic depletion or overexpression systems [29, 32, 33]. However, under these conditions and in cases of human diseases involving altered actin cytoskeleton, signaling changes caused by actin perturbation may also induce non-cell-autonomous effects which have largely been understudied.
It has long been noticed that the perturbation of cytoskeleton machinery affects signaling pathways [34-36]. Depolymerization of microtubules release the guanine exchange nucleotide factor GEF-H1, increasing Rho activity and resulting in increased actomyosin contraction [37]. It has also been reported that certain actin drugs lead to incresed NF-κB activity [38, 39]; however, its mechanism or effects on cell physiology have not yet been addressed. Emerging data has revealed that NF-κB signaling is the major signaling pathway which stimulates the appearance of
Chapter 2
Arp2/3 is critical for lamellipodia and response to extracellular matrix cues but is dispensable for chemotaxis
2.1 Summary
Lamellipodia are sheet-like protrusions at the cell leading edge. They are composed of dendritic actin networks initiated by the seven-subunit protein complex Arp2/3. It is widely recognized that lamellipodia are critical for cell motility, however, whether Arp2/3 complex is required for directional migration has not been vigorously tested. We generated a stable cell line depleted of the Arp2/3 complex using fibroblasts derived from Ink4a/Arf-deficient mice. These Arp2/3-depleted cells lack lamellipodia, show defective random cell motility and rely on a filopodia-based protrusion system.
8
suggests that one important role of Arp2/3-branched actin and lamellipodia is to organize cell-matrix adhesions in a spatially coherent manner.
Introduction
Cell motility is an essential feature in a number of biological processes such as embryonic development, immune responses, and would heading. Deregulation of this process is leads to a variety of diseases including cancer metastasis, autoimmune disorders and developmental defects [2, 42]. Random cell migration allows cells to effectively sample their environment such as in the case of affinity maturation of B cells in the germinal center [27]. However, under most conditions, cell migration is a directional process and is frequently governed by various directional cues such as soluble factors (chemotaxis), substrate-bound factors (haptotaxis) or mechanical cues (durotaxis). Thus, it is an important topic in modern biology to understand how cells sense and respond to these directional cues.
Among these three types of directional migration, chemotaxis is perhaps the most well understood form. It involves a variety of signaling pathways connecting cell surface receptors to the motility machinery inside of cells [43]. These signaling cascades are thought to trigger directional protrusions at the leading edge through controlling actin polymerization pathways [44]. However, these results are based mainly on studies of rapidly migrating amoeboid cells such as neutrophils and Dictyostelium cells; little is known about directional migration in mesenchymal cells.
9
Fibroblasts are mesenchymal cells that perform a variety of tissue repair functions and respond to directional cues such as gradients of PDGF [46]. In addition, the in vitro motility of these cells has been extensively studied. The sheet-like, protruding
leading edge of fibroblasts known as the lamellipodium contains a dense array of actin filaments arranged in a dendritic meshwork [47]. Extensive experimental evidence and theoretical models of lamellipodial protrusion indicate that the polymerization of actin filaments within this meshwork drives protrusion [22]. In addition to its function in protrusion, the lamellipodium is the site of formation for most cell-matrix adhesions [48]. Integrin binding to extracellular matrix (ECM) proteins and subsequent clustering lead to the formation of nascent focal complexes appearing continuously at the distal margin of the lamellipodium. A subset of the focal complexes mature into focal adhesions that are connected to bundled actin stress fibers.
10
11 Results
Development of a stable Arp2/3-depleted cell line
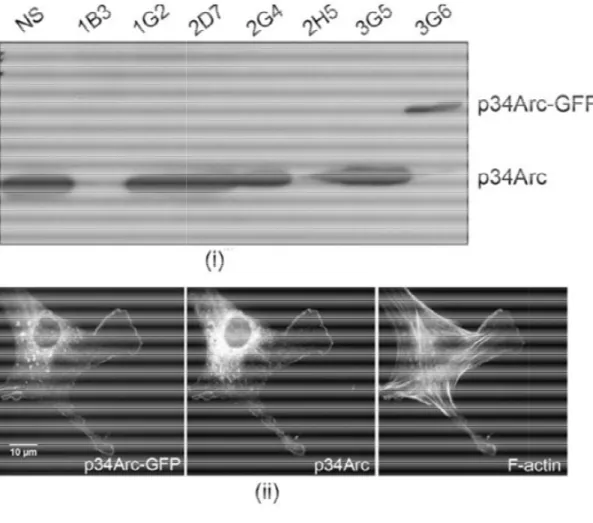
Figure 2 Characterization of p34
Panel (i) shows representative blot of clones from p34
clones showing knockdown rescue (3G6) and others showing only knockdown (1B3). Panel (ii) shows a representative
12 2 Characterization of p34-KDR cells
Panel (i) shows representative blot of clones from p34-KDR experiment with some clones showing knockdown rescue (3G6) and others showing only knockdown (1B3).
representative p34-KDR cells stained for p34Arc and F
KDR experiment with some clones showing knockdown rescue (3G6) and others showing only knockdown (1B3).
13
It has been reported that Arf is playing an important role in cell growth [56], so we repeated the Arp2/3-depletion experiments in early passage wild-type (WT) and Arf-/- MEFs (lacking Arf only, but retaining p16INK4a). Growth rate was monitored and plotted (Figure 3A). Our result showed that the expression of a non-targeting shRNA (NS) in either background had no effect on cell growth, while depletion of p34Arc (not shown) or the Arp2 subunit strongly reduced the proliferation of WT MEFs, but not Arf-/- MEFs These results indicate that in the context of Ink4a/Arf-/- or Arf-/- MEFs, the Arp2/3 complex is not strictly required for cell viability and that its loss may activate specific growth arrest pathways requiring the Arf tumor suppressor.
15 Figure 3: Characterization of 2xKD cells
A) Growth curve of wild-type (WT) and Arf -/- early passage MEFs infected with lentivirus expressing a non-specific sequence (NS) shRNA or Arp2 shRNA (Arp2-KD). Error bars: SEM
B) IA32 cells were infected with lentivirus that expressed shRNAs against NS, p34Arc and Arp2 (2xKD), or shArp2 that also co-expressed human Arp2-GFP (Arp2-KDR). Lysates were blotted for p34Arc, Arp3, p21Arc, Arp2 and for GAPDH as a loading control
C) Mixed NS (expressing GFP) and 2xKD cells (marked by red asterisks) were immunostained for p34Arc to verify knockdown of the endogenous gene and phalloidin to visualize F-actin.
Figure 4 Generation of 2xKD cells
A) Diagram of the lentiviral vector combining EGFP or mCherry (mChry)
B) Flow chart of stable Arp2/3
16 Figure 4 Generation of 2xKD cells
the lentiviral vector combining p34Arc or Arp2 shRNA expression or mCherry (mChry) expression flanked by LoxP sites.
stable Arp2/3-depleted cell line (2xKD) generation.
17
Depletion of Arp2/3 complex leads to the disappearance of lamellipodia and
alters actin architecture
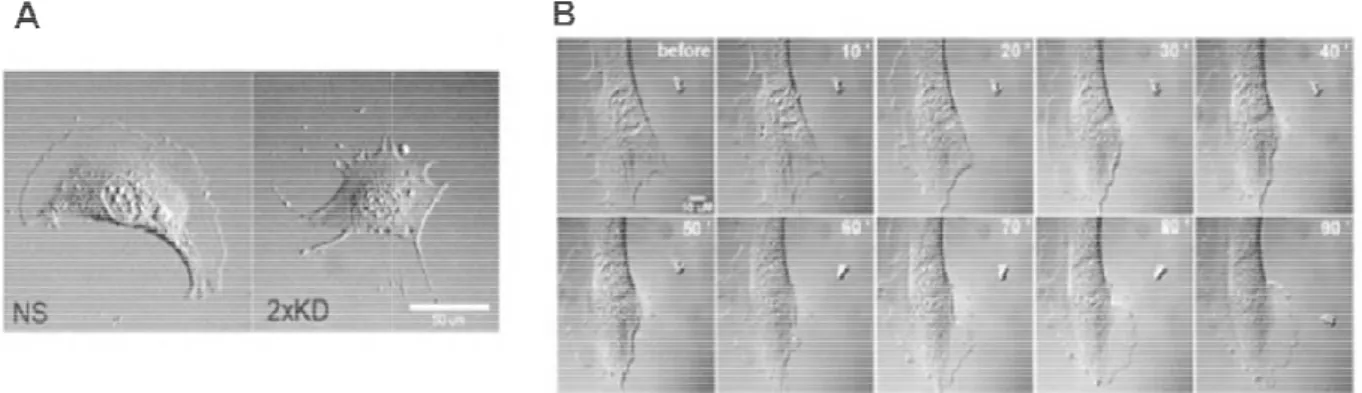
Figure 5 Cell morphology is changed upon Arp2/3
rescued by microinjection of Arp2/3 complex
A) DIC images of NS and 2xKD cells
B) 2xKD cells were microinjected with 5
time-lapse sequence before and after injection show the reappearance of lamellipodia.
18
Cell morphology is changed upon Arp2/3-depletion and can be
rescued by microinjection of Arp2/3 complex
) DIC images of NS and 2xKD cells (Scale bar: 50 µm)
2xKD cells were microinjected with 5 mg/mL Arp2/3 complex.
before and after injection show the reappearance of depletion and can be
19
20
Figure 6 Electron-microscopy revealed altered leading edge actin structure in
the absence of Arp2/3 complex
21
Arp2/3-depleted cells show inefficient, filopodia-driven cell motility
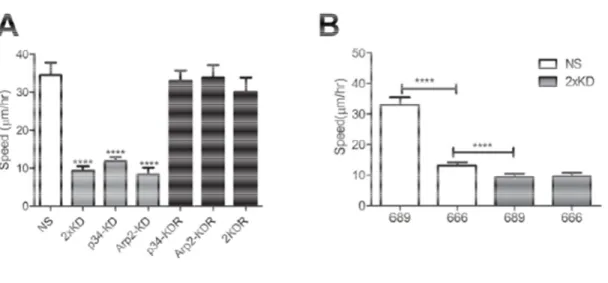
Since lamellipodia are thought to play important roles in cell migration, we examined the effect of Arp2/3 depletion and loss of lamellipodia on cell motility. Using single cell tracking, we found that the 2xKD cells and cells singly depleted of either p34Arc or Arp2 showed a marked reduction in migration speed compared to NS cells. The reduced speed was fully rescued in both p34-KDR and Arp2-KDR cells re-expressing RNAi resistant p34Arc or Arp2 subunits respectively, as well as doubly depleted and doubly rescued (2KDR) cells (Figure 7A). This result confirmed that neither of the effects of the respective shRNAs was due to off-target effects.
Figure 7 Loss of Arp2/3 activity leads to decreased cell
A) Time-lapse microscopy of
and 2KDR cell lines was used to determine single Error bars represent 95% confidence intervals.
B) Single-cell speed of NS and 2xKD cells treated with 100 666 or the inactive control
intervals. ****P<0.0001 by Student's
22
Loss of Arp2/3 activity leads to decreased cell migration speed
lapse microscopy of NS, 2xKD, p34-KD Arp2-KD, p34-KDR
cell lines was used to determine single-cell speed, depicted in graph. Error bars represent 95% confidence intervals. ****P<0.0001 by Student's
of NS and 2xKD cells treated with 100 µM Arp2/3 inhibitor CK 666 or the inactive control compound CK-689. Error bars represent 95% confidence
<0.0001 by Student's t-test
migration speed
KDR and Arp2-KDR cell speed, depicted in graph. <0.0001 by Student's t-test
23
Figure 8 The residual motility in 2xKD cells relies on actin polymerization but
not myosin contractility
A) Single-cell speed of NS and 2xKD cells treated with 1
DMSO as a control. Error bars represent 95% confidence intervals. **P<0.01 by Student's t-test
24
Figure 8 The residual motility in 2xKD cells relies on actin polymerization but
of NS and 2xKD cells treated with 1µM Latrunculin B (LatB) or . Error bars represent 95% confidence intervals.
test
Figure 8 The residual motility in 2xKD cells relies on actin polymerization but
25
B) Single-cell speed of NS and 2xKD cells treated with 15 µM blebbistatin (BLB) or DMSO as a control. Error bars represent 95% confidence intervals. ****P<0.0001 by Student's t-test
C) NS and 2xKD cells treated with vehicle (DMSO) or BLB (15 µM) were immunostained for endogenous vinculin (Vin) and F-actin (Scale bar: 10 µm). Note the disappearance of focal adhesions and the reorganization of actin stress fibers in both cell types.
D) (upper panel) Cell lysates from NS, 2xKD and Arp2-KDR cells treated with DMSO or BLB were blotted for phospho-myosin light chain (Ser19), total myosin light chain (MLC-20) and GAPDH; (lower panel) bar graph showing pMLC(Ser19) quantification from three independent experiments (normalized to GAPDH). Error bar: 95% confidence interval. No statistically significant differences were observed between the cell lines with either treatment, although BLB caused a significant increase in pMLC (Ser19) levels in all three lines.
26
We observed from time-lapse DIC images and F-actin staining that BLB treatment increased filopodia number in 2xKD cells. We quantified filopodia number in NS and 2xKD cells treated with BLB or DMSO control using scanning electron microscopy (SEM) (Figure 9A). Without treatment, 2xKD cells have approximately three-fold more filopodia than NS cells. Under BLB-treatment, filopodia number 2xKD cells increased significantly while the number of filopodia remained unchanged in NS cells (Figure 9B).
Figure 9: Arp2/3-depleted cells show filopodia
A) SEM images of NS and 2xKD cells treated with DMSO or
B) Number of filopodia/cell with DMSO or cells in each cell line from SEM images
C) Time-lapse images of 2xKD
27
depleted cells show filopodia-driven cell motility
) SEM images of NS and 2xKD cells treated with DMSO or BLB
cell with DMSO or BLB treatment was calculated from SEM images. ****P<0.0001 by Student's
t-2xKD cells treated with DMSO or BLB. Scale bar: 5 driven cell motility
calculated from >30 -test
28 Chemotaxis in the absence of Arp2/3 complex
Figure 10 The set-up of chemotaxis
A) Schematic of the microfluidic chamber for chemotaxis and haptotaxis experiments
B) Left: fluorescent image of
indication of gradient formation and gradient along the yellow line depicted i indicated under the curve
29 up of chemotaxis devices
A) Schematic of the microfluidic chamber for chemotaxis and haptotaxis experiments
luorescent image of Cy5-dextran gradient formed inside the chamber
indication of gradient formation and maintenance. Right: line-scan plot of the along the yellow line depicted in the left panel, slope of the gradient is A) Schematic of the microfluidic chamber for chemotaxis and haptotaxis experiments
30
We used single cell tracking to follow individual cells over time and calculate the velocity and directionality of migration. Two methods were used to calculate the directionality of chemotactic cells. First, we transposed the tracks so that each had its start point at the origin and then computed the forward migration index (FMI) using the final position of the cell at the end of the track (Figure 11A). Second, we calculated the angle of each turn in the track relative to the gradient and plotted these as a histogram (Figure 11B). Using this distribution of turn angles, we used a non-linear curve fit to compute the compass parameter (CP) as described previously [61].
32
Figure 11 Arp2/3 complex depletion does not affect chemotaxis
A) Diagram showing FMI calculation method and representative end point scatter plots of NS and 2xKD cells in chemotaxis assays (Data from 120 ng/mL source PDGF concentration)
B) Diagram showing Compass Parameter (CP) calculation and representative histograms showing angular turn per step of NS and 2xKD cells in the same PDGF
chemotaxis assays. P(α) is the probably distribution of angles measured relative to
gradient, γ is a constant, g is the gradient steepness and δ is the angular step size [61]
C) Table showing compass parameter (CP), forward migration index (FMI), velocity (V) and number of cells analyzed (N) in chemotaxis assays with indicated PDGF source concentrations. Numbers in parentheses for each entry are 95% confidence intervals
33
35
Figure 12 Signaling is intact but morphology response is changes in 2xKD
cells upon PDGF stimulation
A) Western blotting showing the change of phospho-Akt (pAkt) level upon PDGF stimulation. Cells were serum-starved overnight before stimulation with 40 ng/mL PDGF
B) 2xKD cells before and after PDGF stimulation (images) and the number of filopodia before and after PDGF treatment of 2xKD cells was calculated from >30 2xKD cells. *P<0.05 by Student's t-test
36
Depletion of Arp2/3 leads to defects in cell spreading
Cells initiate a spreading process involving the dynamic reorganization of the actin cytoskeleton when they encounter surfaces coated with extracellular matrix proteins. To examine whether Arp2/3-branched actin plays a role in the spreading process during the early cell-matrix interaction, we plated NS and 2xKD cells expressing GFP-Paxillin (GFP-Pax) on fibronectin (FN)-coated surfaces and stained cells at different time-points for F-actin and phospho-tyrosine (pTyr). The 2xKD cells showed a marked delay in spreading kinetics and the expected absence of peripheral lamellipodia (Figure 13A, B). Both pTyr and GFP-Pax showed focal adhesions had formed in the 2xKD cells by 90 min, but most of these adhesions remained associated with the periphery compared with the NS controls.
38
Figure 13 Arp2/3 depletion inhibits cell spreading
A) NS and 2xKD cells expressing GFP-Pax were immunostained for phospho-tyrosin (pTyr) and F-actin at different time points during cell spreading
B) Time-lapse images showing the spreading of NS and 2xKD cells
C) Cell adhesion and spreading kinetics of NS and 2xKD cells were analyzed using an impedance based system and reported as arbitrary units (Cell Index). Error bars: SEM
39
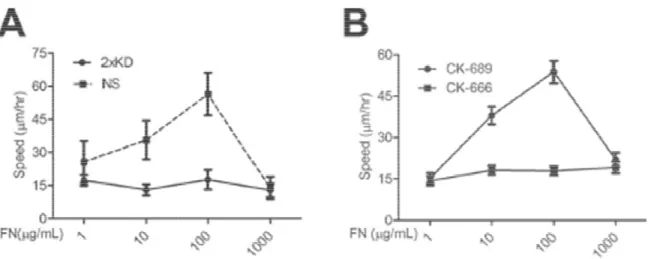
Arp2/3 and lamellipodia are essential for responding to absolute or gradient
changes in ECM concentration
Figure 14 Arp2/3 complex depleted cells
changing ECM
A) Single-cell speed of NS and 2xKD cells plated on different concentrations of fibronectin was plotted (N>30).
B) Speeds of Rat2 cells treated with CK concentrations of FN were plotted
intervals
40
Arp2/3 complex depleted cells do not show biphasic response to
of NS and 2xKD cells plated on different concentrations of (N>30). Error bars represent 95% confidence intervals
s treated with CK-666 or CK-689 and plated on different concentrations of FN were plotted (N>30). Error bars represent 95% confidence
do not show biphasic response to
of NS and 2xKD cells plated on different concentrations of intervals
41
43
Figure 15 Arp2/3-depleted cells cannot respond to gradient changes in
extracellular matrix
A) Left: fluorescent image of Cy5-fibronectin gradient formed on the glass surface inside the cell culture chamber. Right: line-scan plot of the gradient along the yellow line depicted in the left panel
B) Representative end point scatter plots of NS and 2xKD cells in haptotaxis assays (250 µg/mL source fibronectin concentration)
C) Representative histogram showing angular turn per step of NS and 2xKD cells in the same haptotaxis assays
D) Table showing compass parameter (CP), forward migration index (FMI), velocity (V) and number of cells analyzed (N) in haptotaxis assays with indicated FN source concentrations. Numbers in parentheses for each entry are 95% confidence intervals
E) Table showing compass parameter (CP), forward migration index (FMI), velocity (V) and number of cells analyzed (N) in Rat2 cell haptotaxis assays with 250 µg/mL source fibronectin concentration and treated with CK-666 or CK-689
44
Depletion of Arp2/3 complex leads to altered focal adhesion morphology and
dynamics
Figure 16 Depletion of Arp2/3 complex leads to defective focal adhesion
morphology and dynamics
A) Mixed NS (expressing GFP) an immunostained for endogenous paxillin (Vin) and F-actin (Scale bar: 10
B) Representative time-lapse TIRF images of LifeAct-tagRFP
C) Representative time-lapse TIRF LifeAct-tagRFP
45
6 Depletion of Arp2/3 complex leads to defective focal adhesion
morphology and dynamics
A) Mixed NS (expressing GFP) and 2xKD cells (marked by red asterisks)
immunostained for endogenous paxillin (Pax), focal adhesion kinase (FAK), vinculin (Scale bar: 10 µm).
lapse TIRF images of an NS cell expressing GFP
lapse TIRF images of a 2xKD cell expressing GFP
6 Depletion of Arp2/3 complex leads to defective focal adhesion
(marked by red asterisks) were ocal adhesion kinase (FAK), vinculin
expressing GFP-Pax and
46
48
Figure 17 An automated method to detect and analyze focal adhesion
properties
A) TIRF image of an NS cell expressing GFP-Paxillin on a 100 µg/mL FN coated surface (bar = 10µm).
B) High-pass filter applied to the image in A.
C) Distribution of high-pass pixel intensities from the entire time-lapse image series in A. The red dotted line indicates the focal adhesionpixel rejection threshold of the mean plus two standard deviations.
49
We compared the focal adhesion properties of NS and 2xKD cells across three concentrations of fibronectin (Figure 18) and found some interesting trends. With increasing fibronectin concentration, mean focal adhesion area and mean longevity were increased in the NS cells. Interestingly, neither of these properties varies significantly in the 2xKD cells with changes in fibronectin concentration. Mean long axis length and mean axial ratio are the same in both cell types and do not vary with fibronectin concentration. The number of adhesions per cell (per 10 min) decreases in NS while increases in 2xKD cells as a function of fibronectin concentration.
Figure 18 Difference in focal adhesion properties between control and Arp2/3
depleted/inhibited cells
Table of focal adhesion parameters: NS vs 2xKD plated on Rat2 fibroblasts treated with CK
+/- indicate 95% confidence intervals as determined by a t
50
Difference in focal adhesion properties between control and Arp2/3
adhesion parameters: NS vs 2xKD plated on 1, 10 and 100
Rat2 fibroblasts treated with CK-666 or CK-689 on 100 µg/mL FN. Numbers after the indicate 95% confidence intervals as determined by a t-distribution fit
Difference in focal adhesion properties between control and
51
Lamellipodia promote global focal adhesion alignment
53
Figure 19 Determination of focal adhesion alignment index (FAAI)
A) Focal adhesions were segmented via the method described previously and filtered to exclude adhesions with a major to minor axis ratio of less than three as indicated by color coding. The angle of the major axis with the positive x-axis was measured and the adhesions angles throughout the time-lapse image set pooled.
54
One possible way adhesions could become aligned to each other is through rotation of their long axis. Although our visual impression from TIRF movies of cells expressing GFP-Pax strongly argued against this possibility, we tested this by plotting the average deviation in long-axis angle during the time that an individual adhesion was observed. Consistent with our visual impression, focal adhesions show very little variation in their long-axis angle over time in either cell type (Figure 20A). Thus, any change in global alignment must arise from spatially coherent formation, rather than post-formation realignment. In order to reliably determine the angle of the individual adhesions, we limited our measurements to those adhesions with a length/width ratio of at least 3 (Figure 20B).
56
Figure 20: Focal adhesion orientation with time and segmentation method for
FAAI detection
A) Distribution of single focal adhesion mean deviations from their first orientation measurement starting point. The adhesions analyzed were from NS (17 cells and 3184 adhesions) or 2xKD (22 cells and 1132 adhesions) cells plated on 100 µg/mL fibronectin. Insets show single adhesions outlined in green through time, 6 min between images
B) Diagram showing adhesion filtering through a minimum axial ratio of 3 and two sample adhesion orientations
C) Diagram showing the determination of dominant angle and focal adhesion alignment index (FAAI)
57
59
Figure 21 Arp2/3 depletion leads to poor global alignment of focal adhesions
A) FAAI of NS and 2xKD cells expressing GFP-Paxillin plated on different concentrations of fibronectin (number of cells same as in Fig. 6D, p-values for the difference between the means were calculated by bootstrapping with 10000 replicates)
B) FAAI of NS and 2xKD cells with the adhesions grouped by size (p-values for each size range <0.0005)
C) FAAI of NS and 2xKD cells expressing indicated focal adhesion markers. (n = number of cells analyzed)
60 Discussion
In this work, we have established a stable Arp2/3-depleted cell line that allowed us to study random and directional cell motility in the absence of lamellipodia. The depletion of Arp2/3 complex causes striking changes in cell morphology, motility and global focal adhesion geometry. Furthermore our study also reveals the essential role of lamellipodia in fibroblast haptotaxis, but not chemotaxis.
Establishment of a stable Arp2/3 depleted cell line
viability-61
associated processes such as nutrient uptake, while mammalian cells have a multitude of partially redundant pathways. Finally, we performed these experiments in the Ink4a/Arf-deficient background. These genes are well known as tumor suppressors that arrest cell growth upon oncogenic insult [65]. Our results indicate that cells harboring an intact Arf gene are much more sensitive to the loss of Arp2/3 complex, suggesting that the deranged actin cytoskeleton resulting from the loss of Arp2/3 activity may trigger an Arf-dependent growth arrest pathway.
The relationship between Arp2/3 complex and lamellipodia
62
Previous studies have shown that the actin networks within lamellipodia contain short, branched filaments nucleated by Arp2/3 complex [47], consistent with observations of networks generated with purified Arp2/3 complex and actin [66]. Recently, this model has been called into question based on an alternate electron microscopy protocol [54]. Using this technique, mostly long actin filaments were observed in the lamellipodia. Our results with the cryo-shadowing technique are entirely consistent with the notion of highly branched networks of short actin filaments in lamellipodia as originally observed by platinum replica EM [47]. Further evidence for the role of Arp2/3 complex in branch generation comes from the apparent lack of these structures in cells with near total depletion of Arp2/3 complex.
63 The role of lamellipodia in chemotaxis
Chemotaxis is required for numerous physiological processes and has been the subject of intense study for well over a century. The most successful model systems have been the social amoeba Dictyostelium and amoeboid cells of the haematopoietic system such as neutrophils [44].
Studies of chemotaxis in amoeboid cells and other cell types have largely focused on the signal transduction cascades that connect cell surface receptors to the polymerization of actin at the protrusive leading edge. As lamellipodia are the actin-rich, protrusive organelle in fibroblasts, we fully anticipated that depletion of Arp2/3 complex and the resulting loss of lamellipodia would have a profound impact on fibroblast chemotaxis. To our surprise, depletion of Arp2/3 complex has no effect whatsoever on fibroblast chemotaxis up shallow gradients of PDGF, other than affecting the speed at which the cells crawl. Although stimulated actin assembly may still be important for chemotactic response, this assembly clearly does not involve the Arp2/3 complex in this cell type. However, other forms of actin assembly such as those that lead to the increased filopodia on the 2xKD cells may be important for chemotaxis. It is also worth noting that our results may not translate to amoeboid cell chemotaxis, which may require Arp2/3 activity. Future studies will focus on testing the role of alternate actin assembly pathways in fibroblast chemotaxis and testing the generality of our findings for other cell types.
64
appreciated. Transient depletion of either the Cdc42 or Rac1 small GTPase or both does not affect the ability of fibroblasts to respond to gradients of PDGF [67]. Similar to our cells, these depletions affect the morphology of the leading edge without affecting chemotaxis, although some non-GTPase dependent activation of Arp2/3 cannot be excluded. Another enzyme that was initially thought to be crucial for chemotaxis, PI-3 Kinase, is also not strictly required for chemotaxis of Dictyostelium amoebae based on genetic studies [68] or fibroblast chemotaxis towards PDGF based on pharmacological inhibition of this enzyme [69]. Together with our results, these studies highlight the complexity of chemotactic mechanisms and the insufficiency of current models in explaining this process.
The role of lamellipodia in sensing/responding to changes in ECM
Our results with the Arp2/3 depleted cells reveal the importance of Arp2/3 complex and lamellipodia in sensing and responding to the changes in the ECM. Several groups have reported that cells exhibit a biphasic motility response to variable extracellular matrix concentration with fast migration occurring at intermediate ECM concentration and slower migration occurring at low and high ECM concentrations [62, 63]. The molecular basis of this biphasic response is thought to involve spatiotemporal feedback between actomyosin and focal adhesion systems [63]; however, the relationship between this response and specific cellular architecture is unclear.
65
filopodial protrusions on the 2xKD cells are insufficient to allow cells to sense or respond to these differences in ECM concentration. This suggests that the adhesions formed within lamellipodia have qualitatively different properties that allow the whole cell to coordinate global motility.
Cells not only can regulate velocity when migrating on different concentrations of ECM, but also can sense and respond to ECM gradients and migrate in a directional way. This process, termed haptotaxis, requires cells to 1) sense differences of ECM concentration/engagment across a single cell, 2) polarize cytoskeletal and motility machinery, and 3) migrate up the gradient. Our data show that Arp2/3 depletion and subsequent loss of lamellipodia completely ablates haptotaxis. Importantly, this was true not only on gradients of fibronectin, but also on gradients of laminin or vitronectin, ECMs that require different integrin heterodimers.
One outstanding question about the role of lamellipodia in haptotaxis is whether this structure is involved in sensing the gradient or responding to the gradient or both. Considering the intact PDGF chemotactic response without Arp2/3 complex, the loss of haptotaxis appears to be a specific effect rather than a general defect in direction sensing. This remarkable difference in the need for lamellipodia between chemotaxis and haptotaxis suggests that cells use very different mechanisms to sense and respond to these different directional cues.
Spatial organization of cell-matrix adhesions and global cell motility
66
the whole cell are poorly understood. Our results indicate that lamellipodia play a major role in bringing spatial coherence to focal adhesion formation. Without lamellipodia, focal adhesions are poorly aligned to each other, which may explain why these cells migrate slowly.
An open question is how lamellipodia promote the alignment of focal adhesions. One possibility is that the retrograde flow of actin networks in lamellipodia, which is itself spatially coherent over 0.5-5 µm length scales, could promote the alignment of the adhesions that form and mature within this flow field. However, how the alignment of focal adhesions within lamellipodia contribute to global alignment is less clear. Since the rear of the cell was once the front the cell, this alignment may reflect the history of these adhesions as born within previous lamellipodia. How cells manage to define a new axis of focal adhesion alignment upon turning will be the subject of future studies.
Our observations also provide a conceptual framework for linking events occurring at small length scales such as the formation of branches by the Arp2/3 complex (~10 nm) to whole cell motility at much longer length scales (~100 µm) (Figure 22). Branched actin networks generated by the Arp2/3 complex are the main component of the lamellipodial cytoskeleton.
67
Figure 22 Conceptual model of cell motility events across length scales
68
69 Materials and methods
Reagents and Materials: Commercial antibodies were obtained from Cell Signaling
Technologies (Akt (pan), Phosphor-Akt(Ser473), ECM Bioscience (Arp2(C-terminal region)), Sigma-Aldrich (Monoclonal vinculin Clone hVIN-1, Monoclonal anti-ARP3, CloneFMS338), Upstate Biotechnology (Anti-FAK clone 4.47, Rabbit (Polyclonal) Anti-FAK[pY397]), BD Biosciences (Mouse anti-Paxillin), Millipore(Anti-p34-Arc/ARPC2), and Ambion Applied Biosystems (Anti-GAPDH). AlexaFluor647 dye conjugated phalloidin was from Invitrogen. Arp2/3 complex inhibitor CK-666 and the inactive control CK-689 are from EMD4Biosciences. Latrunculin B, (-)-Blebbistatin, Laminin were from Sigma-Aldrich, human plasma Fibronectin from BD Biosciences, Human Vitronectin from R & D Systems, Cy5 labeling kit from Amersham, Rhodamine Red-X and HRP conjugated secondary antibodies were from Jackson ImmunoResearch Laboratories. Bovine Arp2/3 complex was from Cytoskeleton Inc. PLL(20)-g[3.5]-PEG(2) was from SuSoS (Dübendorf, Switzerland). Western blotting was done by standard techniques. For quantitative western analysis, the blot was probed using primary antibodies followed by incubation with infrared-conjugated secondary antibodies. The membrane was scanned in an Odyssey SA scanner (LI-COR Biosciences, Lincoln, NE), and band intensities were quantified using the Odyssey software. Molecular cloning was conducted using standard procedures and details including primer sequences are available upon request.
Cell culture, viral transduction and generation of 2xKD cells: Cells were
70
µg/mL streptomycin and 292 µg/mL L-glutamine. DMEM supplemented with 0.1%
fatty-acid free BSA (Equitech-Bio), 100 U/mL penicillin, 100 µg/mL streptomycin and 292 µg/mL L-glutamine was used to culture cells during serum starvation. Transient transfections were performed using FuGene 6 (Roche) for HEK293 FT cells. Retroviral packaging, infections, and fluorescence-activated cell sorting were as described[32]. Lentivirus production and infection were as described [7].
IA32 cells infected with shArp2-mChry (target sequence: TGACCATGGCTTTAAACA AGTT) and shp34-EGFP (from [8]) viruses were cloned by fluorescence-activated cell-sorting (FACS) and screened for p34 and Arp2 expressions by Western blot. Infection with adenoviruses expressing Cre-recombinase (U of Iowa Gene Transfer Core) was used to deplete fluorescent protein expression before a second round of FAC sorting to yield 2xKD cells.
Growth Curves: MEFs were plated at 1×10⁴ cells/well as triplicates in 24 well plates. Cell number was counted every 24 hr for indicated days, and normalized to the number on the first day. Growth curve was measured the same way for IA32 NS and 2xKD cells, but with different initial cell number (3000 cells/well). Cell viability was determined by trypan blue exclusion.
Microinjection Rescue of 2xKD cells: Bovine Arp2/3 protein complex was
71
semiautomatic Eppendorf InjectMan NI 2/Femtojet system. Injected volume was estimated to be less than 10% total cell volume.
Spreading assay: Cell spreading assays were performed as described previously
[70] with minor modifications. Briefly, NS and 2xKD cells were serum starved for 1 hr. Cells were then detached with trypsin containing 1 mM EDTA, washed with regular cell culture medium, and then suspended at 1 × 10⁴ cells/mL. Cells were seeded at 1000 cells/well in the electrode sensors (16X E-plate 16, Roche) coated with 25 µg/mL FN. Cell adhesion during the subsequent 5 hr period was continually
monitored by taking a measurement with the RTCA apparatus (Roche Applied Science) operated with RTCA Software every 30 sec.
Phase contrast microscopy of cell spreading: Cells were trypsinized,
resuspended in complete culture medium. Phase contrast time-lapse sequential cell images were captured with Nikon BioStation IM.
Light Microscopy and image analysis
Immunofluorescence: For immunofluorescent staining, the cells were fixed, stained
72
AlexaFluor-647 phalloidin for F-actin (1:200 dilution), p34Arc (1:250 dilution), Pax (1:500 dilution), Vin (1:400 dilution) or FAK (1:400 dilution) antibodies. After washing the cells three times in PBS, fluorescent dye conjugated secondary antibodies were diluted to 1:250 in 1% BSA in PBS and applied to the coverslips for 1 hr. After three washes in PBS, the coverslips were mounted onto slides with Fluoromount G (Electron Microscopy Sciences).
Images were captured using a FluoView FV1000 scanning confocal inverted microscope (FV1000, Olympus) equipped with a 1.42 N.A. 60× objective, a Hamamatsu PMT and controlled by Fluoview software. Maximum intensity projection was generated with ImageJ (ZProject-Maximum intensity function) from a z-stack (4 slices, 100 nm interval). Images were combined and annotated in Photoshop for presentation. Images were initially saved as 16-bit tiff files and converted to 8-bit tiff files in ImageJ during the analysis.
Single cell tracking: Cells were plated on 10 µg/mL FN-coated glass bottom culture
dishes (MatTek Corporation) for 8-12 hr before imaging. Time-lapse microscopy was performed on an Olympus VivaView FL incubator fluorescent microscope (20x objective) with a Hamamatsu camera (OrcaERAG - c4742-80-12AG), or with Nikon BioStation IM (20x objective). Cell speed was measured with ImageJ using the Manual Tracking plug-in (http://rsbweb.nih.gov/ij/plugins/track/track.html).
73
blocked with 1 mg/mL PLL(20)-g[3.5]-PEG(2) at 37 °C for 1 hr to prevent non-specific cell adhesion.
Focal adhesion imaging: IA32 cells infected with shNS-GFP-PAX, shNS-Vin-GFP,
FAK, 2xKD cells infected with shArp2-GFP-PAX, shArp2-Vin-GFP, mChry-FAK, and Rat2 cells treated with CK-666 or CK-689 were plated on FN coated Delta T dishes (Bioptechs). Total internal reflectance microscopy was performed using Olympus cell^TIRF illuminator motorized multicolor TIRF microscope (60x objective). Images were captured using an ImagEM camera (c9100-14). Images were taken every 15 sec for 1 hr to monitor focal adhesion dynamics and 150 sec for 3 hr to analyze focal adhesion alignment.
Electron Microscopy
Scanning EM: Cells were plated onto 10 µg/mL FN coated coverslips overnight,
74
Supra 25 FESEM operating at 5 kV, working distance of 5mm, and 10µm aperture (Carl Zeiss SMT Inc., Peabody, MA).
Cryo-shadowing EM: Nickel grids (150-mesh) covered with a carbon film were
treated with a glow discharge at 200 torr for 2 min. FN (10 µg/mL) was used to coat the glow-treated surface for 1 hr at 37 °C. Cells w ere plated on grids for 2.5 hr in regular cell culture medium before extraction with extraction buffer (1% Triton X-100 and 2 µM phalloidin in PEM buffer containing 100 mM PIPES, 1 mM EGTA, 1mM MgCl2, pH 6.9) for 4 min at room temperature [72]. After extraction, cells were rinsed with PEM buffer (pH 6.9) for 1 min and fixed with 1% glutaraldehyde in PBS for 5 min at room temperature. After fixation, grids were briefly rinsed with distilled water and transferred to the chamber of an FEI Vitrobot freezing robot held at 37 °C and 100% humidity [57]. The water remaining on the grid was gently blotted with filter paper before plunging the grid into liquid ethane for rapid freezing. The grids in an enclosed box under liquid nitrogen were transferred to the stage of a modified Balzers freeze etch machine held at -120 °C. The c hamber was evacuated and the sample slowly freeze dried at 1x10⁻⁵ to 5x10⁻⁷ torr for 4 hr while the temperature was ramped from -120 to -85 °C. The samples were then r otary shadowcast with tungsten prior to breaking the vacuum.
75 Directional migration assays
Microfludic device preparation: Transparency masks were printed using a
76
Chemotactic gradients: The exit ports of the sink and source channels were
connected to waste using tubing of ID 0.015”. Gas tight 100 µL Hamilton glass syringes (81020,1710TLL 100 µL SYR) were connected to 27 1/2 gauge needles connected to tubing. The source syringe and tubing were filled serum free DMEM containing indicated chemoattractant and 10 µg/mL of TRITC-dextran to visualize the gradient. The sink syringe and tubing were filled with serum free DMEM. The tubing was then inserted into the source and sink channels respectively, and the syringe pump was operated at a flow rate of 20 nL/min. A stable gradient was then established in the cell culture chamber within 30 min, and typically remained stable for 18 hr as monitored by TRITC-dextran fluorescent intensity.
Haptotaxis gradients: Identical chambers as in the chemotaxis experiments were
prepared. After bonding device to dish, the cell culture was coated with a minimal concentration of 2.5 µg/mL FN (or 5 µg/mL LN) to promote cell attachment throughout the chamber. The source and sink syringes were filled with the indicated concentration FN (or LN or VTN) in PBS or PBS alone respectively. The syringe pump was maintained at a flow rate of 20 nL/min. The chambers were allowed to equilibrate for 1 hr. Once the ECM gradient was established, 1 mg/mL PLL(20)-g[3.5]-PEG(2) was flowed into all channels of the device to block non-specific adhesion. Thorough wash of the chambers with distilled water was performed before plating the cells.
Directional migration image acquisition and analysis: Chemotaxis assays were
77
assays were performed on the Nikon Biostation IM using a 20x objective and at the same time interval. Individual cells were manually tracked using ImageJ software Manual Tracking plug-in. The tracks obtained were further analyzed using the
chemotaxis tool developed by IBIDI
(http://www.ibidi.de/applications/ap_chemotaxis.html#imageanalysis). This analysis tool was used to extract the FMI and histogram of angular direction of tracks from the manual tracking results. To obtain the Compass Parameter (CP), the histograms obtained were further analyzed in GraphPad Prism software by performing a non linear curve fit to the chemotaxis equation.
Focal Adhesion Segmentation and Measurements: To identify focal adhesions in
78
In order to measure the global alignment of focal adhesions across the entire cell, we developed the focal adhesion alignment index (FAAI). The index is determined by a two-step process. The first step involved collecting and filtering the adhesion angles in each image of the time-lapse, while the second step involved searching for a reference angle that minimizes the deviation between all of the adhesion angle measurements. We began the first step by segmenting the adhesions from each frame of a time-lapse movie. From this set of identified adhesions in each frame, we calculated the best-fit ellipse to each adhesion. From this ellipse, we found the length of the major axis, the length of the minor axis and the angle the major axis of the adhesion made with the positive xaxis. Angle measurement was on a scale of -90°-90° to avoid the ambiguity of the 360° measurem ent scale. We set the minimum ratio of the lengths of the major over minor axes to three as a filter to select adhesions whose orientation could be determined. After collecting the adhesion angles with the positive x-axis as the reference, the second step of calculating the index began with a search through a range of potential reference angles. The search began at with the x-axis as the 0° position and the calculation of the standard deviation of the adhesion angles. Then the reference angle is increased by 0.1°, the adhesion angles with the new reference axis are recalculated and the standard deviation measured. This search process continued until the full range (0°-179.9°) of potential reference angles had been sampled. The FAAI is calculated for all reference angles as:
79
We choose this formulation as it provides an intuitive interpretation of the index; high values of the FAAI indicate that the adhesions in a cell are well aligned (low standard deviation) and low values of the FAAI indicate that the adhesions are not well aligned (high standard deviation). The dominant adhesion angle is defined as the reference angle that maximizes the FAAI. In cases where there are multiple angles that maximize the FAAI, the reference angle that minimizes the absolute value of the mean adhesion angle is selected from the list of angles that maximize the FAAI as the dominant angle. The final number reported is the value of the FAAI at the dominant angle.
Chapter 3
Loss of Arp2/3 complex induces an NF-κB-dependent secretory response that leads to non-autonomous effects on chemotactic signaling
3.1 Summary
81
82 3.2 Introduction
Cytoskeletal integrity is important for cell morphology and motility, and is thought to be critical for some signal transduction pathways [34-36]. Defects in actin cytoskeletal integrity are seen in a variety of human diseases and cytoskeletal dynamics become deregulated in cancer metastasis and autoimmune disorders [1, 2]. Perturbation of cytoskeleton is tightly linked to abnormal cell migration [8, 32]. The direct or indirect autonomous effects of actin perturbation on cell motility have been reported in drug perturbation, genetic depletion or overexpression systems [29, 32, 33]. However, under these conditions and in cases of human diseases involving altered actin cytoskeleton, signaling changes caused by actin perturbation may also induced non-cell-autonomous effects which have largely been understudied.
83
chemokines, highly resembling what has been reported in SASP (senescence associated secretory phenotype). SASP factors are known to cause non-cell-autonomous effects on cell migration, and are under regulation of NF-κB and p38MAPK pathways [40, 74-76]. Thus, the intriguing potential crosstalk among actin cytoskeleton perturbation, increased NF-κB activity, secretory factor release and non-autonomous effects on cell migration becomes extremely exciting and interesting to test.
84
suppressors[29]. These results suggest that the loss of Arp2/3 may induce senescence in an Ink4a/Arf-dependent manner.
85 3.3 Results
Depletion of Arp2/3 complex induce expression of secretory factors
87
Figure 23: Loss of Arp2/3-complex induced upregulation of secretory factors
A) The transcriptomes of IA32 fibroblasts and their Arp2/3-depleted derivatives (2xKD) [29] were analyzed by RNASeq. DAVID analysis of top 500 genes (>10 fold up-regulated) with highest fold increase in 2xKD cells, ranked by Benjamini score.
B) qRT-PCR showing fold changes of a subset of growth factors, MMPs and cytokines up-regulated in 2xKD cells in the RNA-Seq experiments. Error bar: 95% confidence interval. 2 biological replications (each has 3 technical replications) for each sample.
88
Secretory factors released by Arp2/3-depleted cells affect chemotaxis in a
non-cell-autonomous way
89
Figure 24: Loss of Arp2/3 autonomous way
A) Wind rose plots showing NS and 2xKD cells in NS conditioned media (NS CM) or 2xKD CM in EGF chemotaxis. 100 ng/mL EGF was used as chemoattractant. Compass parameter (CP) and forward
graph, numbers in parentheses show 95% confidence intervals
in 2xKD CM, N=73 for 2xKD cells in NS media, N=79 for NS cell in 2xKD CM and N=60 for NS cells in NS CM.
90
Loss of Arp2/3-complex affects chemotaxis in a cell non
ose plots showing NS and 2xKD cells in NS conditioned media (NS CM) or 2xKD CM in EGF chemotaxis. 100 ng/mL EGF was used as chemoattractant. Compass parameter (CP) and forward migration index (FMI) are indicated on the , numbers in parentheses show 95% confidence intervals. N=72 for 2xKD cells in 2xKD CM, N=73 for 2xKD cells in NS media, N=79 for NS cell in 2xKD CM and N=60 for NS cells in NS CM.
complex affects chemotaxis in a cell
91
B) Western blots showing phospho-AKT (p-AKT), total AKT and GAPDH levels in NS and 2xKD cells upon EGF stimulation at indicated timepoints. Representative blot from three experiments is shown.
C) Wind rose plots showing NS and 2xKD cells in NS CM or 2xKD CM during PDGF chemotaxis. 100 ng/mL PDGF was used as chemoattractant. Compass parameter (CP) and forward migration index (FMI) are indicated on the graph, numbers in parentheses show 95% confidence intervals. N=76 for 2xKD cells in 2xKD CM and N=72 for NS in 2xKD CM.
D) Western blot showing p-AKT, total AKT and GAPDH levels in NS and 2xKD cells upon EGF stimulation at indicated timepoints.
92
Secretory pathway activated by loss-of-Arp2/3 is regulated by NF-κB
Figure 25 Up-regulation of secretory pathways by Arp2/3
regulated through NF-κB
A) Western blot showing
levels in NS and 2xKD cells (left) and NS cells treated with 100 CK-666 or its inactive control compound CK
B) Inhibition of Arp2/3 complex caused increased NF
lines. HS68 (human foreskin fibroblasts), WM2664 (human melanoma cells) and MDCK (epithelial cells) were treated with 100
lysed. Western blot showed p under indicated treatment.
93
ation of secretory pathways by Arp2/3
B
) Western blot showing phospho-p65 (Ser536) (p-p65), total p65 and GAPDH levels in NS and 2xKD cells (left) and NS cells treated with 100 µM Arp2/3 inhibitor
666 or its inactive control compound CK-689 for 6 hrs (right).
Inhibition of Arp2/3 complex caused increased NF-κB activation in multiple cell . HS68 (human foreskin fibroblasts), WM2664 (human melanoma cells) and MDCK (epithelial cells) were treated with 100 µM CK-666 for 0 or 6 hrs before being blot showed p-p65, p65 and GAPDH levels in these three cell lines
.
ation of secretory pathways by Arp2/3-depletion is
p65), total p65 and GAPDH M Arp2/3 inhibitor
94
96
Figure 26 Cmpd A reversed the effect of Arp2/3 loss on secretory factor
upregulation without affecting cell motility or morphology
A) Western blot showing levels of p-p65, p65 and GAPDH in 2xKD cells treated with IKK inhibitor cmpdA (5µM) for indicated time.
B) ELISAs showing secreted IL-6, HGF and MMP3 levels in 2xKD cells with and without cmpdA treatment compared to NS cells. Conditioned media (CM) from 2xKD cells with or without 5 µM cmpdA treatment were collected after culturing cells in serum-free DMEM for 12 hrs. ELISAs were then performed according to the manufacture’s protocols.
C) qRT-PCR showing the expression fold changes of indicated genes compared to Wild Type IA32 cells. 2xKD cells were treated with or without 5 µM cmpdA for 12 hrs before being harvested for qRT-PCR. Fold changes were analyzed using pfaffl method.
98
Figure 27 NF-κB activation by loss of Arp2/3 activity is confirmed in a
zebrafish reporter line
A) Multiple examples showing day 2 post fertilization pNF-κB:GFP zebrafish embryos [83] treated with 100 µM CK-666 and its control compound CK-689 for 12 hrs.
99
Activation of NF-κB by Arp2/3-depletion is regulated through MEKK3/CCM2
pathways