R E S E A R C H
Open Access
Fasting substrate oxidation in relation to habitual
dietary fat intake and insulin resistance in
non-diabetic women: a case for metabolic flexibility?
Madelaine T Carstens
1, Julia H Goedecke
1,4, Lara Dugas
2, Juliet Evans
1, Jacolene Kroff
1, Naomi S Levitt
3and Estelle V Lambert
1*Abstract
Background:Metabolic flexibility described as“the capacity of the body to match fuel oxidation to fuel availability” has been implicated in insulin resistance. We examined fasting substrate oxidation in relation to dietary
macronutrient intake, and markers of insulin resistance in otherwise healthy women, with and without a family history of diabetes mellitus (FH DM).
Methods:We measured body composition (dual x-ray absorptiometry), visceral and subcutaneous adipose tissue area (VAT, SAT, using Computerised Tomography), fasting [glucose], [insulin], [free fatty acids], [blood lipids], insulin resistance (HOMA-IR), resting energy expenditure (REE), respiratory exchange ratio(RER) and self-reported physical activity in a convenience sample of 180 women (18-45 yrs). A food frequency questionnaire was used to assess energy intake (EI) and calculate the RER: Food Quotient (FQ) ratio. Only those with EI:REE (1.05 -2.28) were included (N=140). Insulin resistance was defined HOMA-IR (>1.95).
Results:The Insulin Resistant (IR) group had higher energy, carbohydrate and protein intakes (p < 0.05) and lower PA levels than Insulin Sensitive (IS) group (P < 0.001), but there were no differences in RER or RER:FQ between groups. However, nearly 50% of the variance in HOMA-IR was explained by age, body fat %, VAT, RER:FQ and FH DM (adjusted R2= 0.50, p < 0.0001). Insulin-resistant women, and those with FH DM had a higher RER:FQ than their counterparts (p < 0.01), independent of body fat % or distribution.
Conclusion:In these apparently healthy, weight-stable women, insulin resistance and FH DM were associated with lower fat oxidation in relation to dietary fat intake, suggesting lower metabolic flexibility.
Keywords:HOMA-IR, Insulin-sensitivity, Dietary fat intake
Background
The World Health Organization estimates that nearly 60% of adult cases of diabetes, 1 in 5 cases of ischemic heart diseases, and between 8-42% of certain cancers may be attributable to adult obesity [1]. Obesity and dia-betes have become major public health problems in both developed and developing countries [2-4]. This trend in obesity may be linked to changes in population levels of physical activity [5], along with a changing food
environment, in which low cost, high energy density, high-fat foods are more freely available [6-8].
Consumption of energy dense/high fat diets is strongly and positively associated with overweight and insulin re-sistance, particularly when the excess body fat is located in abdominal region [9,10]. Nevertheless, the link be-tween fat intake and overweight is not limited to the high-energy content of fatty foods, but has also been shown to be associated with a reduced capacity to oxidize dietary fat [11-14].
Metabolic flexibility has been defined as “a clear cap-acity to utilize lipid and carbohydrate fuels and to
transi-tion between them” in response to changes in dietary
energy intake or circulating substrate concentrations * Correspondence:[email protected]
1MRC/UCT Research Unit for Exercise Science and Sports Medicine,
Department of Human Biology, Faculty of Health Sciences, University of Cape Town, PO BOX 115, Newlands, Cape Town 7725, South Africa Full list of author information is available at the end of the article
[15]. A failure in metabolic flexibility may lead to not only the obese state, but to the metabolic sequelae of in-sulin resistance [16]. Metabolic flexibility as an ‘intrinsic property of skeletal muscle’ has been further supported by in vitro studies in which the capacity of glucose to suppress fat oxidation in cultured myotubes from muscle biopsy samples was inversely correlated with in vivo in-sulin sensitivity and positively correlated to % body fat and serum free fatty acid levels [17].
Metabolic flexibility in vivo is typically measured by quantifying the oxidative response to some metabolic challenge, such as insulin-stimulation [18] or short-term, high-fat feeding. For example, in a study [19], young, otherwise healthy men, with a family history of diabetes, had a lower fat oxidation in response to a 3-day, high-fat diet, when compared to the fat oxidation those without a family history of diabetes.
Evidence from epidemiological [20,21] and interven-tion studies, implicates total dietary fat, and in particular, dietary saturated fat in insulin resistance. The potential mechanisms underpinning the effect of dietary fatty acids on insulin resistance may include altered substrate oxidation and metabolic flexibility [22], modifications in the composition of cell membranes, and stimulation of pro-inflammatory pathways in the body, promoting chronic inflammation, and may be associated with increased risk for cancer, heart disease, stroke, diabetes, arthritis and auto-immunity [10].
In this study, we propose a pragmatic measure of metabolic flexibility by comparing fasting substrate oxi-dation, with habitual dietary macronutrient intake, for the purposes of screening. This measure may provide some potential targets for intervention, for the purposes of preventing Type 2 diabetes mellitus [23].
Therefore, we firstly hypothesized that the measure of fasting fat oxidation in relation to habitual dietary fat and fatty acid intake, as a proxy for metabolic flexibility, would be associated with obesity and insulin resistance in a group of apparently healthy women. We further hypothesized, that this relationship may be modulated by a family history of diabetes. Thus, the findings of the present study support the notion that interventions to improve metabolic flexibility, and thereby insulin sensi-tivity, should ideally target physical activity levels, and/or dietary fat content or quality.
Methods
Subjects
A convenience sample of 180 healthy premenopausal urban-dwelling white South African women between the ages of 18 to 45 years was recruited through the local media, as part of a larger study [24]. The protocol was approved by the Research Ethics Committee of the Fac-ulty of Health Sciences, University of Cape Town. The
study was explained to each participant prior to the start of the trial and informed, written consent was obtained from all subjects.
Body composition
Body weight was measured, using a combination scale and stadiometer (Universal weight enterprise Detecto model BW-150, Taipei, Taiwan). Waist girth (at the level of the umbilicus) and hip girth (over the area of largest circumference) were measured in participants with a steel anthropometric tape (Rosscraft Innovations Incor-porated, Canada) wearing light clothing and were also used to calculate the waist-to-hip ratio (WHR). Whole body composition was measured using dual-energy
X-ray absorptiometer (DXA) (Hologic QDR 4500
Discovery-W with software version 4.40, Hologic Inc., Bedford, MA, USA) according to standard procedures. The co-efficient of variation (%) for fat-free mass, using this technique, is as low as 0.7%, and 1.67% for fat mass. Body fat distribution was measured using computerized tomography (CT) scans at the level of the L4-L5 lumbar vertebrae. Visceral and subcutaneous tissue areas (VAT and SAT, respectively) were quantified as described pre-viously [25]. Due to logistical constraints DXA scans were only completed on 66 insulin sensitive and 70 insu-lin resistant subjects and CT scans on 55 insuinsu-lin sensi-tive and 58 insulin resistant subjects.
Blood pressure, glucose tolerance and lipoprotein profiles Blood pressure (BP, mmHg) was taken as the average of three readings from the left arm, after subjects rested quietly for 5 min, using an automated BP device (OMRON, Kyoto, Japan). Following an over-night fast (12-h), venous blood samples were collected for the measurement of plasma concentrations of free fatty acids (FFA, mmol/l), total-cholesterol (TC, mmol/l), HDL-cholesterol, mmol/l, LDL-cholesterol, mmol/l, tri-glycerides, mmol/l, glucose, mmol/l, and insulin, mU/l. Fasting plasma glucose concentration were analysed using the glucose oxidase method (YSI 2300 STAT PLUS; YSI Life Sciences, Yellow Springs, OH, USA), and blood lipids were measured using the Roche modular autoanalyzer and enzymatic colorimetric assays were used to analyze total cholesterol, triglycer-ides, and HDL-C concentrations. The LDL-C
concen-trations were determined using the Friedewald
formula [26]. Insulin levels were determined by a Micro particle Enzyme Immunoassay (MEIA) (AxSym Insulin Kit, Abbott, IL, USA).
Insulin sensitivity
used to group subjects according to risk (≤1.95 for insu-lin sensitive (IS), > 1.95 for insuinsu-lin resistant (IR) groups [28].
Habitual energy and nutrient intake
All participants completed a previously validated, struc-tured food frequency [29] questionnaire (Dietary Assess-ment and Education Kit, Medical Research Council of South Africa, South Africa) administered by a registered dietician. Energy intake (EI) was analysed using the
com-puter package FoodFinder™3 software application
(Ver-sion 1, Medical Research Council of South Africa). Total energy intake (TEI) (kJ), total carbohydrate (CHO), pro-tein, fat and alcohol (g and % of energy) were calculated. The food quotient (FQ) was calculated from the food records, with the macronutrient composition expressed in percentage, using the following equations:
FQ¼ 0:207carbohydrateð Þ þ% 0:159fatð Þ% þ0:193proteinð Þ%
þ0:137alcoholð ÞÞ% = 0:207 carbohydrateð Þ%
þ0:226fatð Þ þ% 0:243proteinð Þ% þ0:206alcoholð ÞÞ%
[30].
Excluding under/over reporters, only subjects with an EI: REE ≥1.05 and < 2.28, ie. adequate reporters, were included in this analysis [31]. Of the 140 included in the final sample, 69 were insulin sensitive, and 71 insulin re-sistant. The following reported dietary variables were also documented: carbohydrates, fats (poly & mono-unsaturated and saturated fats) and protein (animal and plant).
Short fat questionnaire (SFQ)
The short fat questionnaire [32] is a brief, 17-item self-administered questionnaire which provides a measure of habitual dietary fat consumption. Fifteen of the ques-tions are worth 0 to 4 points, whereas the remaining two can yield a maximum of 2 points each. Finally, the scores of all items are summed to generate a total out of 64 which is interpreted as follows: 0–17 = low fat intake; 18–39 = moderate fat intake;≥40 = high fat intake.
Resting energy expenditure (REE), respiratory exchange ratio (RER) and metabolic flexibility measured by RER:FQ ratio
Resting energy expenditure (REE) was measured using indirect calorimetry (Sensor Medics VMAX ventilated hood indirect calorimeter, Yorba Linda, CA) following a 12-h overnight fast. Subjects were instructed to report to the laboratory very early in the morning and rested in the supine position for 20-min. Subjects were tested in a
darkened, thermo-neutral room and instructed to refrain from any movement for the duration of the assessment. The measurement period was 30 min, to allow time to reach and maintain a metabolic steady state.
Respiratory exchange rate (RER) and energy expend-iture (EE) were averaged from the last 10 min of each
as-sessment. Energy expenditure was converted into
kilojoules using the Weir equation [33], and expressed on a per minute basis. The estimated fat and carbohy-drate oxidation rates were calculated using the average respiratory exchange ratio (RER). The proxy measure for metabolic flexibility in the present study was the fasting RER:FQ ratio. A value of greater than 1, suggested that fat oxidation was lower relative to the fat intake in the diet.
Demographic, medical history, socio-cultural and behavioural factors
Subjects completed a demographic questionnaire, deter-mining socio-economic status on the basis of factors such as: education, housing and housing density and oc-cupation. Physical activity was self-reported and assessed using the previously validated Global Physical Activity Questionnaire (GPAQ) [34].
In addition, subjects reported personal and family medical history and were subsequently grouped accord-ing to family history of obesity (FH OB) and family his-tory of diabetes mellitus (FH DM), on the basis of one or more of their immediate family members having the condition.
Statistics
The data were analyzed using Statistica Version 9 (Stats-Soft Inc. Version 8, Tulsa, OK, USA) and expressed as means and standard deviations. Data that were not nor-mally distributed were log-transformed where necessary. The insulin sensitive women were significantly older than the insulin resistant women. Therefore, all analyses were subsequently age-adjusted. Insulin sensitive and in-sulin resistant groups were compared, with respect to anthropometry, dietary intake and reported energy ex-penditure and metabolic outcomes, using analyses of co-variance. Combining the two groups (Insulin sensitive and Insulin resistant), pearson-product moment correla-tions were used to identify variables that were associated with RER and HOMA-IR. Multiple regression analysis was used to determine factors that were independently associated with insulin resistance in our study sample in-cluding age, metabolic flexibility, body composition, diet and physical activity. HOMA-IR was log-transformed for the analysis.
as well as comparing those persons with and without family history diabetes mellitus (FH DM), adjusting for age and body composition. An alpha level of less than or equal to 0.05 was accepted as statistically significant.
Results
Subject characteristics
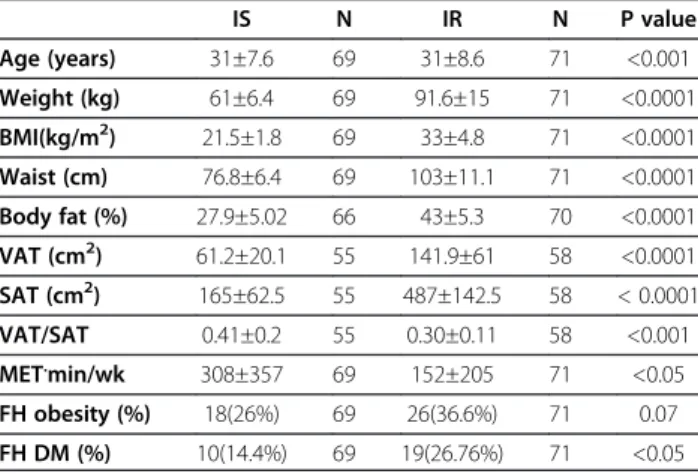
The subject characteristics of the study population are presented in Table 1. The insulin sensitive group was younger and more physically active than the insulin re-sistant group (p < 0.001). The insulin rere-sistant group had a higher body fat %, waist circumference (cm), VAT
(cm2) and SAT (cm2). However, the insulin sensitive
group had a higher VAT/SAT ratio (p < 0.001).
Metabolic risk parameters
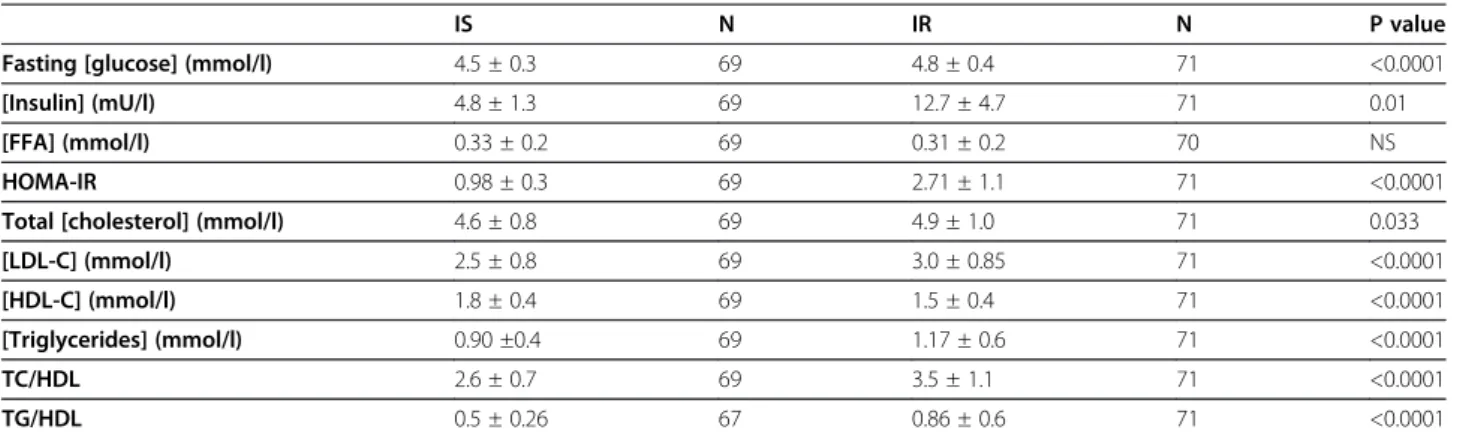
Fasting plasma [glucose], and serum [insulin], and HOMA-IR, presented in Table 2, were significantly higher in the IR group, by design. [Total cholesterol], [LDL-chol], [triglycerides], and TC/HDL ratio were also significantly higher in the IR group compared to the IS group (even after adjusting for age).
Habitual dietary intake
The habitual reported dietary intake of both groups is presented in Table 3. Total reported energy intake (MJ/ day) (p < 0.05), and dietary fat (g) intake were signifi-cantly higher in the insulin resistant group, compared to the insulin sensitive group. Further, saturated fat (% of total energy), mono-and poly-unsaturated fat % (% of total energy) and ω-6 fatty acids (g) were also signifi-cantly higher in the insulin resistant group (p < 0.05, data not shown). In contrast, there was no significant differ-ence in the food quotient between groups.
Resting energy expenditure and substrate oxidation Unadjusted resting energy expenditure values were sig-nificantly lower in the insulin resistant group (p < 0.001, Table 3). However following adjustment for free fat mass, resting energy expenditure between groups was not different. Similarly we found no differences in the RER and RER: FQ ratio between groups.
Factors associated with substrate oxidation (RER), insulin resistance (HOMA-IR) and metabolic flexibility (RER:FQ) When combining the groups (Table 4), we showed that certain lifestyle variables (lower fat oxidation higher re-spiratory exchange ratio, lower RER:FQ ratio) and body composition (higher body fat %, and subcutaneous adi-pose tissue, higher visceral adiadi-pose tissue and waist cir-cumference) were associated with HOMA-IR. We also found significant inverse associations between specificω-3 dietary fatty acids, eicosapentaenoic acid (C20:5; EPA, r=−0.22, P < 0.009), docosapentaenoic acid (C22:5, DPA, r=−0.27, P < 0.001), docosahexaenoic acid (C22:6; DHA, r=−0.29, P < 0.0001), and resting energy expenditure. A higher habitual intake of these dietary fatty acids was associated with an overall higher rate of fasting fat oxidation. In addition, RER:FQ ratio was significantly correlated to other markers of metabolic risk
includ-ing [HDL-C] (r = − 0.19, P = 0.03), and [TG/HDL]
ratio, (r = 0.19, P = 0.03).
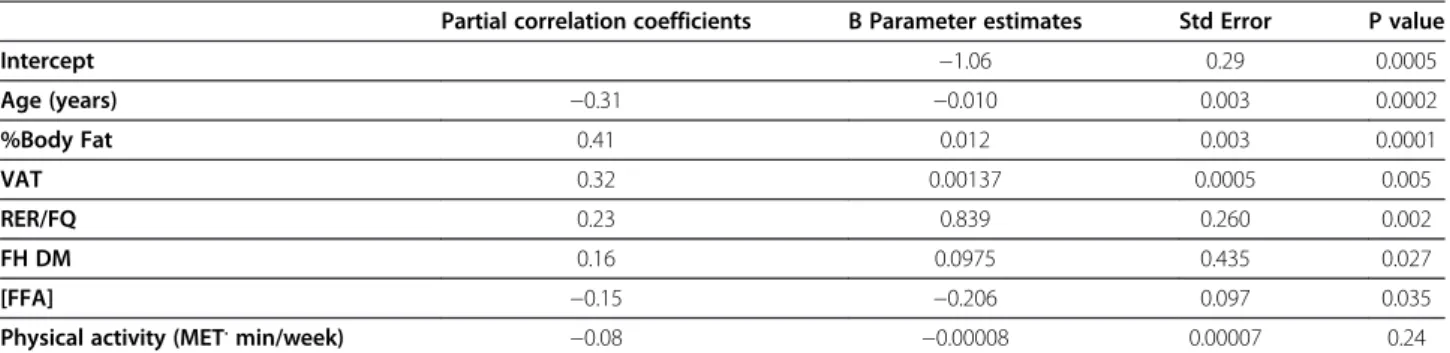
We subsequently performed a multiple regression ana-lysis to determine factors that were independently asso-ciated with insulin resistance (Table 5). Age, free fatty acids, METS, visceral adipose tissue and total body fat (%), family history of diabetes, as well as RER:FQ, accounted for 50% of variance in HOMA-IR (log trans-formed) (p < 0.00001).
Furthermore, subjects who had a HOMA≥1.95 had a
higher RER:FQ ratio, as well as a higher resting energy expenditure than those with HOMA < 1.95 (p < 0.006), even after adjusting for differences in body fat % and age. Similarly, those with a family history of diabetes also had a higher RER:FQ ratio, after adjusting for differences in body fat percentage and age (p < 0.05) (Figure 1).
Discussion
The results of the present study supported our hypoth-esis that metabolic inflexibility, indicated by a pragmatic proxy measure of fasting resting energy expenditure to food quotient (RER:FQ) ratio, was associated with insu-lin resistance and family history of diabetes mellitus, in otherwise apparently healthy women, independent of body fatness and age. Insulin resistance was associated with lower rates of whole body fat oxidation in relation to habitual dietary fat intake. This extends the findings of Ukropcova [19], who demonstrated impaired meta-bolic flexibility in response to short-term high-fat Table 1 Subject characteristics and body composition
IS N IR N P value
Age (years) 31±7.6 69 31±8.6 71 <0.001
Weight (kg) 61±6.4 69 91.6±15 71 <0.0001
BMI(kg/m2) 21.5±1.8 69 33±4.8 71 <0.0001
Waist (cm) 76.8±6.4 69 103±11.1 71 <0.0001
Body fat (%) 27.9±5.02 66 43±5.3 70 <0.0001
VAT (cm2) 61.2±20.1 55 141.9±61 58 <0.0001
SAT (cm2) 165±62.5 55 487±142.5 58 < 0.0001
VAT/SAT 0.41±0.2 55 0.30±0.11 58 <0.001
MET.min/wk 308±357 69 152±205 71 <0.05
FH obesity (%) 18(26%) 69 26(36.6%) 71 0.07
FH DM (%) 10(14.4%) 69 19(26.76%) 71 <0.05
feeding, in healthy individuals, as measured by changes in resting energy expenditure during sleep or in response to a hyperinsulinaemic, euglycaemic clamp. Similar to the current study, this effect was most marked in those with a family history of Type 2 diabetes mellitus. How-ever, unlike previous studies, the present study demon-strated these relationships using simple fasted resting measures of substrate oxidation, against self-reported, habitual dietary fat intake, without any manipulation of diet, or induced glycaemia [16].
The link between substrate oxidation or metabolic flexibility and family membership, as well as, family his-tory of diabetes, has been demonstrated using 24-hr resting energy expenditure [14,30], fasting substrate oxi-dation [34] and suppression of fat oxioxi-dation in response to insulin-induced glycaemia and in response to high-fat feeding, Ukropcova [17,19], hypothesized that patterns of fat oxidation are genetically or epigenetically deter-mined, in that, the differences in metabolic phenotype
were independent of body fat percentage. Taken
together, these results suggest that metabolic inflexibility is linked to genetic or epigenetic phenomenon, and is not secondary to insulin resistance, or the result of obes-ity, per se.
In previous studies, metabolic inflexibility has been shown to be concomitant with reduced skeletal muscle mitochondria size and density, [17,35] with an associated decrease in capacity for complete oxidative disposal of fat and loss of insulin sensitivity. Meex, [36] demon-strated that, 3 months of exercise training improved insulin sensitivity in both type 2 diabetics and non-diabetic individuals, along with metabolic flexibility, par-ticularly in relation to insulin-stimulated, oxidative, glu-cose disposal. In addition, mitochondrial function was increased in both groups. This is consistent with the Table 2 Markers of metabolic risk between IS and IR groups
IS N IR N P value
Fasting [glucose] (mmol/l) 4.5 ± 0.3 69 4.8 ± 0.4 71 <0.0001
[Insulin] (mU/l) 4.8 ± 1.3 69 12.7 ± 4.7 71 0.01
[FFA] (mmol/l) 0.33 ± 0.2 69 0.31 ± 0.2 70 NS
HOMA-IR 0.98 ± 0.3 69 2.71 ± 1.1 71 <0.0001
Total [cholesterol] (mmol/l) 4.6 ± 0.8 69 4.9 ± 1.0 71 0.033
[LDL-C] (mmol/l) 2.5 ± 0.8 69 3.0 ± 0.85 71 <0.0001
[HDL-C] (mmol/l) 1.8 ± 0.4 69 1.5 ± 0.4 71 <0.0001
[Triglycerides] (mmol/l) 0.90 ±0.4 69 1.17 ± 0.6 71 <0.0001
TC/HDL 2.6 ± 0.7 69 3.5 ± 1.1 71 <0.0001
TG/HDL 0.5 ± 0.26 67 0.86 ± 0.6 71 <0.0001
Results from ANCOVA, values are adjusted for age and expressed as the means ± SD. FFA, free fatty acids; HOMA-IR,homeostasis model for insulin resistance; LDL-C. low-density lipoprotein-cholesterol,HDL-C,high-density lipoprotein-cholesterol. TG, triglycerides.
Table 3 Habitual dietary Intake, energy expenditure and substrate oxidation
IS IR P value
(N=69) (N=71)
Energy and macronutrient intake
Energy Intake (MJ/d) 9.1±1.9 9.7±1.9 <0.05
Carbohydrate (g) 238.2±62.7 263.1±66.4 0.02
Protein (g) 80.2±19.4 131.2±17.9 0.04
Fat Intake (g) 75.2±23.4 79.6 ±24.2 <0.05
Food Quotient (FQ) 0.86±0.02 0.86±0.02 NS
Energy expenditure and substrate oxidation
RER 0.87±0.1 0.89±0.1 NS
RER/FQ 1.01±0.1 1.03±0.1 NS
Results of ANCOVA, values are expressed as the means ± SD; MJ/day, mega joules per day; RER, respiratory exchange ratio; FQ, food quotient.
Table 4 Dietary and lifestyle factors associated with HOMA-IR
N r P value
Added Sugar (g) 140 0.20 0.005
% Total Energy(Sugar) 140 0.20 0.008
Insoluble fibre (g) 140 −0.25 0.003
Soluble fibre (g) 140 −0.26 0.002
ω-6 FA (g) 140 0.21 0.01
% Energy Plant Protein 140 −0.23 0.006
Physical activity (MET.min/week) 140 −0.29 0.001
Short Fat Questionnaire (pts) 140 0.28 0.001
RER 140 0.21 0.01
RER/FQ 140 −0.19 0.03
Body Fat % 136 0.56 0.0001
Total SAT (cm2) 113 0.60 0.0001
VAT (cm2) 113 0.54 0.0001
VAT/SAT 113 −0.20 0.02
Waist (cm) 140 0.60 0.0001
results of the current study, in which the total physical activity levels and RER:FQ ratio contributed to the over-all variance in HOMA-IR, or insulin resistance (Table 5). However, we found no direct correlation between self-reported physical activity and resting energy expenditure or the RER:FQ ratio. The lack of a direct association be-tween physical activity, fasting substrate oxidation and metabolic flexibility, as measured in the present study, may be related to the fact physical activity levels were generally low, and the data were not normally distribu-ted. Alternatively subjects may have over reported phys-ical activity levels or the GPAQ may not have been sufficiently sensitive to distinguish between groups. Not unexpectedly, we found that the insulin resistant group reported lower levels of physical activity and a higher dietary fat intake [37], and thus, may have additionally confounded this relationship in bivariate analyses.
One unexpected finding in the present study, was the inverse associations between serum free fatty acids con-centrations and insulin resistance, in these non-diabetic, otherwise healthy women. While there are numerous studies that have shown that elevated free-fatty acid levels may be implicated in the aetiology of insulin re-sistance and are associated with Type 2 diabetes mellitus
[37,38], there is also some indication that the sequelae of insulin resistance may be tissue- and substrate-specific [16,39]. As such, it is possible that in these non-diabetic subjects, the increased circulating insulin concentra-tions, were still effective in the suppression of lipolysis or in the non-oxidative disposal of fatty acids [40].
In a cohort study, Bickerton, [41] compared men in the highest and lowest quartiles for fasting plasma insulin and found that there were no differences between groups with respect to circulating free fatty acid concentrations. How-ever, those with the highest fasting insulin also had higher triglyceride concentrations. In a smaller metabolic study, insulin-resistant men were compared to weight-matched, BMI-matched controls. Despite higher insulin levels, the insulin-resistant group had similar fasting free fatty acid concentrations when compared to control subjects, and systemic fatty acid production and appearance were lower. These authors suggest that there are ‘altered metabolic partitioning’ of fatty acids (reduced oxidation, increased re-esterification), in response to the insulin resistant state. This is consistent with Forbes [42], who found that lipoly-sis, palmitate appearance and palmitate oxidation were actually lower in non-obese women at risk for diabetes compared to controls. While at the same time, they demonstrated higher plasma insulin levels, suggesting increased capacity for storing fat.
The influence of diet on insulin sensitivity is mediated by both energy and nutrient content, in particular by dif-ferent types of dietary fatty acids [42,43]. The higher dietary fat intake (Table 3) of the insulin resistant group compared to the insulin sensitive group directly relates to insulin sensitivity [44]. We also found that higher
dietary ω-3 fatty acids, specifically C20:5, C22:5, and
C22:6, were strongly associated with increased fat oxida-tion (data not shown). Thus, specific dietary fatty acids may modulate the relationship between substrate oxida-tion and insulin resistance, by altering fatty acid parti-tioning, towards either storage or oxidation [45].
One limitation of the present study was that total fat intake was assessed by a quantified validated food frequency questionnaire (FFQ) [29], rather than an Table 5 Forward, stepwise, multiple linear regression for log HOMA-IR
Partial correlation coefficients ΒParameter estimates Std Error P value
Intercept −1.06 0.29 0.0005
Age (years) −0.31 −0.010 0.003 0.0002
%Body Fat 0.41 0.012 0.003 0.0001
VAT 0.32 0.00137 0.0005 0.005
RER/FQ 0.23 0.839 0.260 0.002
FH DM 0.16 0.0975 0.435 0.027
[FFA] −0.15 −0.206 0.097 0.035
Physical activity (MET.min/week) −0.08 −0.00008 0.00007 0.24
VAT, visceral adipose tissue; RQ, respiratory quotient; FH DM, family history of diabetes mellitus, FFA, free fatty acids, Adjusted R2=0.50, SEE = 0.18, P < 0.00001.
objective biomarker, which may have introduced the potential for bias, as over and under reporters were excluded from the analysis. However, a study in a sample of American men comparing fatty acid intake assessed by subcutaneous fat aspirate [46], 2-weeks diet records, and an amended version of the food
frequency questionnaire used in the US Nurses’
Health Study [47] suggested that the estimates of fat intake from the food frequency questionnaire were as valid as those from the diet records.
Conclusion
We found that a pragmatic measure of metabolic flexi-bility based on fasting respiratory exchange ratio in rela-tion to reported habitual dietary fat intake was a useful marker of insulin resistance in otherwise, healthy women, independent of obesity. Importantly, metabolic flexibility, measured in this way, was lower in those women who reported a family history of diabetes melli-tus. Further research is needed to characterize the oxida-tive response to various dynamic challenges to better clarify the role of metabolic flexibility in the patho-physiology of obesity and diabetes. Additionally, longitu-dinal studies, monitoring changes in substrate oxidation in relation to substrate balance, over time, and in rela-tion to changes in body energy stores and fat distribu-tion are needed. Finally, there is a need for a greater understanding of the respective role of genotype and en-vironment in determining this susceptible phenotype.
Competing interests
The author declares that she has no competing interests to declare.
Authors’contributions
MC helped to design the study, collected the data, analysed and interpreted the results, wrote and edited the manuscript. JE was involved in subject recruitment, data collection and analysis and interpretation of the results, and editing the manuscript. JG and EVL were involved in the design of the study, analysis and interpretation of the data, writing and editing of the manuscript. LD, JK and NL were involved in the analysis and interpretation of the results, and the editing of the manuscript. All authors read and approved the final manuscript.
Acknowledgements
The authors wish to thank the Research volunteers for their participation in this study. Hendrienna Victor and Neezaam Kariem, are thanked for their expert clinical and technical assistance. Dr. Jack Bergman and Naomi Fenton of Syminton Radiology are thanked for performing the CT scans and Linda Bewerunge is thanked for performing the DEXA scans. This study was funded by the National Research Foundation of South Africa, the Medical Research Council of South Africa, and the University of Cape Town.
Author details 1
MRC/UCT Research Unit for Exercise Science and Sports Medicine, Department of Human Biology, Faculty of Health Sciences, University of Cape Town, PO BOX 115, Newlands, Cape Town 7725, South Africa. 2Department of Preventive Medicine and Epidemiology, Strict School of
Medicine, Maywood, IL, USA.3Division of Endocrinology & Diabetic Medicine, Department of Medicine, Faculty of Health Sciences, University of Cape Town, Cape Town, South Africa.4South African Medical Research Council, Parow, Cape Town, South Africa.
Received: 12 September 2012 Accepted: 15 December 2012 Published: 14 January 2013
References
1. WHO [online]: www.who.int/dietphysicalactivity/media/en/gsfs_obesity.pdf [accessed 21 January 2010].
2. Guh DP, Zhang W, Bansback N, Amarsi Z, Birmingham CL, Anis AH:The incidence of co-morbidities related to obesity and overweight: a systematic review and meta-analysis.BMC Public Health2009,9:88. 3. Gersh BJ, Sliwa K, Mayosi BM, Yusuf S:Novel therapeutic concepts: the
epidemic of cardiovascular disease in the developing world: global implications.Eur Heart J2010,31(6):642–648.
4. Popkin BM:Recent dynamics suggest selected countries catching up to US obesity.Am J Clin Nutr.2010,91(1):284S-288S. doi:10.3945/ ajcn.2009.28473C. Epub 2009 Nov 11. PubMed PMID: 19906804; PubMed Central PMCID: PMC2793114
5. King DE, Mainous AG, Carnemolla M, Everett CJ:Adherence to healthy lifestyle habits in US adults, 1988–2006.Am J Med2009,122(6):528–534. 6. Drewnowski A:Obesity and the food environment: dietary energy
density and diet costs.Am J Prev Med2004,27(3 Suppl):15462.
7. Monteiro CA, Moura EC, Conde WL, Popkin BM:Socioeconomic status and obesity in adult populations of developing countries: a review.Bull World Health Organ2004,82:940–946.
8. Bell EA, Castellanos VH, Pelkman CL, Thorwart ML, Rolls BJ:Energy density of foods affects energy intake in normal-weight women.Am J ClinNutr
1998,67(3):412–420.
9. Bray GA:Medical consequences of obesity.J ClinEndocrinol Metab2004,89 (6):2583–2589.
10. Riccardi G, Giacco R, Rivellese AA:Dietary fat, insulin sensitivity and the metabolic syndrome.Clin Nutr2004,23(4):447–456.
11. Astrup A, Buemann B, Christensen NJ, Toubro S:Failure to increase lipid oxidation in response to increasing dietary fat content in formerly obese women.Am J Physiol1994,266(4 Pt 1):E592–E599.
12. Thomas CD, Peters JC, Reed GW, Abumrad NN, Sun M, Hill JO:Nutrient balance and energy expenditure during ad libitum feeding of high-fat and high-carbohydrate diets in humans.Am J Clin Nutr1992,55(5):934–942. 13. Weinsier RL, Nelson KM, Hensrud DD, Darnell BE, Hunter GR, Schutz Y:
Metabolic predictors of obesity. Contribution of resting energy expenditure, thermic effect of food, and fuel utilization to four-year weight gain of post-obese and never-obese women.J Clin Invest1995, 95(3):980–985.
14. Zurlo F, Lillioja S, Esposito-Del Puente A, Nyomba BL, Raz I, Saad MF, Swinburn BA, Knowler WC, Bogardus C, Ravussin E:Low ratio of fat to carbohydrate oxidation as predictor of weight gain: study of 24-h RQ.
Am J Physiol1990,259(5 Pt 1):E650–E657.
15. Storlien L, Oakes ND, Kelley DE:Metabolic flexibility.Proc Nutr Soc2004, 63(2):363–368.
16. Galgani JE, Moro C, Ravussin E:Metabolic flexibility and insulin resistance.
Am J Physiol Endocrinol Metab2008,295(5):E1009–E1017.
17. Ukropcova B, McNeil M, Sereda O, de Jonge L, Xie H, Bray GA, Smith SR: Dynamic changes in fat oxidation in human primary myocytes mirror metabolic characteristics of the donor.J Clin Invest2005,
115(7):1934–1941.
18. Færch K, Vaag A:Metabolic inflexibility is a common feature of impaired fasting glycaemia and impaired glucose tolerance.Acta Diabetol2011, 48(4):349–353.
19. Ukropcova B, Sereda O, de Jonge L, Bogacka I, Nguyen T, Xie H, Bray GA, Smith SR:Family history of diabetes links impaired substrate switching and reduced mitochondrial content in skeletal muscle.Diabetes2007, 56(3):720–727.
20. Hu FB:The role of n-3 polyunsaturated fatty acids in the prevention and treatment of cardiovascular disease.Drugs Today (Barc)2001,37(1):49–56. 21. Risérus U, Willett WC, Hu FB:Dietary fats and prevention of type 2
diabetes.Prog Lipid Res2008,48(1):44–51.
22. Lovejoy JC:The influence of dietary fat on insulin resistance.Curr Diab Rep2002,2(5):435–440.
23. Paulweber B, Valensi P, Lindstrőm J, Lalic NM, Greaves CJ,et al:A European evidence-based guideline for the prevention of type 2 diabetes.Horm Metab Res2010,42:S3–S36.
factor-αgene modifies the association between saturated fat intake and serum total cholesterol levels in white South African women.Genes Nutr2011, 6(4):353-9. doi:10.1007/s12263-011-0213-2. Epub 2011 Mar 8. PubMed PMID: 21484162; PubMed Central PMCID: PMC3197842.
25. Smith SR, Lovejoy JC, Greenway F, Ryan D, de Jonge L, de la Bretonne J, Volafova J, Bray GA:Contributions of total body fat, abdominal
subcutaneous adipose tissue compartments, and visceral adipose tissue to the metabolic complications of obesity.Metabolism2001,50(4):425–435. 26. Friedewald WT, Levy RI, Fredrickson DS:Estimation of the concentration of
low-density lipoprotein cholesterol in plasma, without use of the preparative ultracentrifuge.Clin Chem1972,18(6):499–502.
27. Matthews DR, Hosker JP, Rudenski AS, Naylor BA, Treacher DF, Turner RC: Homeostasis model assessment: insulin resistance and beta-cell function from fasting plasma glucose and insulin concentrations in man.
Diabetologia1985,28(7):412–419.
28. Karelis AD, Brochu M, Rabasa-Lhoret R:Can we identify metabolically healthy but obese individuals (MHO)?Diabetes Metab2004,30(6):569–572. 29. Steyn NP, Nel JH, Casey A:Secondary data analyses of dietary surveys
undertaken in South Africa to determine usual food consumption of the population.Public Health Nutr2003,6(7):631–644.
30. Toubro S, Sørensen TI, Hindsberger C, Christensen NJ, Astrup A: Twenty-four-hour respiratory quotient: the role of diet and familial resemblance.
J Clin Endocrinol Metab1998,83(8):2758–2764.
31. Black AE:Critical evaluation of energy intake using the Goldberg cut-off for energy intake: basal metabolic rate. A practical guide to its calculation, use and limitations.Int J Obes Relat Metab Disord2000, 24(9):1119–1130.
32. Dobson AJ, Blijlevens R, Alexander HM, Croce N, Heller RF, Higginbotham N, Pike G, Plotnikoff R, Russell A, Walker R:Short fat questionnaire: a self administered measure of fat-intake behaviour.Aust J Public Health1993, 17:144–149.
33. Weir JB:New methods for calculating metabolic rate with special reference to protein metabolism.J Physiol1949,109(1–2):1–9. 34. Bull FC, Maslin TS, Armstrong T:Global physical activity questionnaire
(GPAQ): nine country reliability and validity study.J Phys Act Health2009, 6(6):790–804.
35. De Pergola G, Pannacciulli N, Minenna A, Martina RA, Cannito F, Giorgino R: Fuel metabolism in adult individuals with a wide range of body mass index: effect of a family history of type 2 diabetes.Diabetes Nutr Metab
2003,16(1):41–47.
36. Chomentowski P, Coen PM, Radiková Z, Goodpaster BH, Toledo FG:Skeletal muscle mitochondria in insulin resistance: differences in intermyofibrillar versus subsarcolemmal subpopulations and relationship to metabolic flexibility.J Clin Endocrinol Metab2011,96(2):494–503.
37. Meex RC, Schrauwen-Hinderling VB, Moonen-Kornips E, Schaart G, Mensink M, Phielix E, van de Weijer T, Sels JP, Schrauwen P, Hesselink MK: Restoration of muscle mitochondrial function and metabolic flexibility in type 2 diabetes by exercise training is paralleled by increased myocellular fat storage and improved insulin sensitivity.Diabetes2010, 59(3):572–579.
38. Schrauwen P, van Aggel-Leijssen DP, Hul G, Wagenmakers AJ, Vidal H, Saris WH, van Baak MA:The effect of a 3-month low-intensity endurance training program on fat oxidation and acetyl-CoA carboxylase-2 expression.Diabetes2002,51(7):2220–2226.
39. Lattuada G, Costantino F, Caumo A, Scifo P, Ragogna F, De Cobelli F, Del Maschio A, Luzi L, Perseghin G:Reduced whole-body lipid oxidation is associated with insulin resistance, but not with intramyocellular lipid content in offspring of type 2 diabetic patients.Diabetologia2005, 48(4):741–747.
40. Coker RH, Williams RH, Yeo SE, Kortebein PM, Bodenner DL, Kern PA, Evans WJ:Visceral fat and adiponectin: associations with insulin resistance are tissue-specific in women.Metab Syndr Relat Disord2009,7(1):61–67. 41. Bickerton AS, Roberts R, Fielding BA, Tornqvist H, Blaak EE, Wagenmakers AJ,
Gilbert M, Humphreys SM, Karpe F, Frayn KN:Adipose tissue fatty acid metabolism in insulin-resistant men.Diabetologia2008,51(8):1466–1474. 42. Forbes S, Robinson S, Dungu J, Anyaoku V:Sustained endogenous glucose
production, diminished lipolysis and non-esterified fatty acid appearance and oxidation in non-obese women at high risk of type 2 diabetes.Eur J Endocrinol2006,155(3):469–476.
43. Hung T, Sievenpiper JL, Marchie A, Kendall CW, Jenkins DJ:Fat versus carbohydrate in insulin resistance, obesity, diabetes and cardiovascular disease.Curr Opin Clin Nutr Metab Care2003,6(2):165–176.
44. Pérez-Jiménez F, López-Miranda J, Pinillos MD, Gómez P, Paz-Rojas E, Montilla P, Marín C, Velasco MJ, Blanco-Molina A, Jiménez Perepérez JA, Ordovás JM:A Mediterranean and a high-carbohydrate diet improve glucose metabolism in healthy young persons.Diabetologia2001, 44(11):2038–2043.
45. Thorseng T, Witte DR, Vistisen D, Borch-Johnsen K, Bjerregaard P, Jørgensen ME:The association between n-3 fatty acids in erythrocyte membranes and insulin resistance: the Inuit health in transition study.Int J Circumpolar Health2009,68(4):327–336.
46. Hunter DJ, Rimm EB, Sacks FM, Stampfer MJ:Comparison of measures of fatty acid intake by subcutaneous fat aspirate, food frequency questionnaire, and diet records in a free-living population of US men.
Am J Epidemiol1992,135(4):418–427.
47. Mostad IL, Bjerve KS, Bjorgaas MR, Lydersen S, Grill V:Effects of n-3 fatty acids in subjects with type 2 diabetes: reduction of insulin sensitivity and time-dependent alteration from carbohydrate to fat oxidation.Am J Clin Nutr2006,84(3):540–550.
doi:10.1186/1743-7075-10-8
Cite this article as:Carstenset al.:Fasting substrate oxidation in relation to habitual dietary fat intake and insulin resistance in non-diabetic women: a case for metabolic flexibility?.Nutrition & Metabolism201310:8.
Submit your next manuscript to BioMed Central and take full advantage of:
• Convenient online submission
• Thorough peer review
• No space constraints or color figure charges
• Immediate publication on acceptance
• Inclusion in PubMed, CAS, Scopus and Google Scholar
• Research which is freely available for redistribution