BRAIN MICRO- AND MACRO-STRUCTURAL CHARACTERISTICS INVESTIGATION IN FIBROMYALGIA USING MULTI-MODAL MAGNETIC RESONANCE IMAGING
Estephan Jose Moana-Filho
A dissertation submitted to the faculty at the University of North Carolina at Chapel Hill in partial fulfillment of the requirements for the degree of Doctor of Philosophy in the
Curriculum in Oral Biology (Concentration in Pain Neurobiology) in the School of Dentistry.
Chapel Hill 2014
© 2014
ABSTRACT
Estephan Jose Moana-Filho: Brain Micro- and Macro-Structural Characteristics Investigation in Fibromyalgia Using Multi-Modal Magnetic Resonance Imaging
(Under the direction of Richard H. Gracely)
Fibromyalgia (FM) is a chronic widespread pain condition that deeply impacts the lives of patients. Multiple symptoms such as fatigue, impaired cognition, and sleep disturbances among others are commonly described. Despite intensive research effort, no disease-specific mechanism uniquely explains the clinical presentation of FM. Nonetheless, current evidence points to a major role of the central nervous system for the main feature of this condition: pain and sensory augmentation. Neuroimaging techniques provide a window into the brain mechanisms that may play a role in FM. Several studies using functional magnetic resonance imaging (MRI) show abnormalities in pain processing in the brain of FM patients. Likewise, structural abnormalities are found using anatomical MRI however the findings are less consistent. The main goal of this dissertation was to comprehensively assess brain structural features of FM patients and matched controls at both micro- (cellular-level structures such as membranes, myelin as well as axonal density) and macro-structural (gross anatomical) levels as measured by diffusion-weighted and high-resolution anatomical MRI respectively.
that alterations in the brain of patients potentially contribute to the symptoms experienced by them. Conversely, macro-structural brain features showed little difference between patients and controls regarding gray matter (GM) characteristics. Between-group differences were only found for increased volume in the amygdalae and WM adjacent to the anterior cingulate cortex and left insula for FM patients relative to controls.
To my mother, who dedicated her life to her family and provided me the environment and conditions so I could be my best. I will never forget all your love, dedication, affection, and support for me to experience all the good things in life. May God bless
you and keep you close to Him.
To my father, I appreciate and recognize all your effort to provide me the best resources to grow as a person and as a professional. Your support for my decisions
about my professional life was fundamental for me to achieve my goals. To my sisters, who helped me organize my endeavors in Brazil while I was living abroad. All the visits to see you in our home country were always filled with fun and joy!
To my nephew Pedro and niece Maria Isadora, I am sorry to have missed your growth during my studying abroad. I hope we made the best of our time together during
my visits to Brazil, and we will plan for you to visit me more frequently wherever I may be in the future.
To my former advisor Don Nixdorf, who has been a career mentor and a friend ever since we started working together, even after I moved to the next step of my career. I
appreciate all your support and guidance during all this time, and look forward to continue working with you.
To all my friends who supported me in one way or another. A special thanks to Sandro, my childhood friend who always kept in touch and never let the friendship die even with all the physical distance between us. I am looking forward for more fun in the
years ahead!
To my wife Karla. No other person – none! – knows better than you all the sacrifice, countless hours of study and work, and time away from family and friends that was
needed for me to achieve this goal.
This Doctorate of Philosophy is as much mine as it is yours, and I cannot think of anybody else who could be a better spouse and partner than you. This is my public recognition of the love, support, dedication, and self-sacrifice you offered me during all these years. I will continue doing all within my reach to provide you the same in return.
ACKNOWLEDGEMENTS
This dissertation resulted not only from my personal effort, but also from many other people who helped me throughout this research project:
My mentor and advisor Richard Gracely, who gave all his support to develop this neuroimaging effort beyond the original research project. I appreciate your guidance and the freedom you provided me so I could learn my own way through research;
To Inna Tchivileva, our study coordinator who put much effort in taking this project off the ground and helped expedite data collection so I could graduate in time. I appreciate our discussions on academic and life matters;
To Mike Young and Ollie Monbureau, your help on technical aspects of our project was fundamental to have it started and going on smoothly;
To Cindy Blake, who take good care of her Oral Biology students;
To Patrick Flood, who always had his students’ best interest and was always available to us;
To all Oral Biology faculty, in guiding us students during our learning years; To all past and present fellow Oral Biology PhD students, your support and companionship during these years was much needed and welcomed;
TABLE OF CONTENTS
LIST OF TABLES ... x
LIST OF FIGURES ... xi
LIST OF ABBREVIATIONS ... xii
CHAPTER 1: INTRODUCTION, METHODS OVERVIEW AND SUBJECT SAMPLE DESCRIPTION ... 1
Introduction ... 1
Fibromyalgia: an overview ... 4
Brain characteristics in fibromyalgia assessed by neuroimaging techniques ... 13
Rationale for investigating brain structural characteristics of fibromyalgia ... 16
Objectives ... 18
Methods overview ... 18
Subjects ... 18
Demographic characteristics and clinical measures ... 20
Questionnaires ... 20
MRI scanning session ... 23
Statistical analysis ... 23
Results ... 24
Demographic characteristics and clinical measures ... 24
Questionnaires ... 25
CHAPTER 2: ASSESSMENT OF BRAIN MICRO-STRUCTURAL CHARACTERISTICS OF FIBROMYALGIA PATIENTS USING
DIFFUSION TENSOR IMAGING ... 29
Introduction ... 29
Methods ... 30
Imaging acquisition parameters ... 30
Diffusion tensor imaging, tensor model and related metrics ... 31
DWI preprocessing steps ... 36
Tract-based spatial statistics ... 37
Statistical analyses ... 38
Results ... 40
Subjects demographics characteristics, clinical measures and questionnaires .... 40
TBSS analysis (voxelwise) ... 40
Whole brain, WM skeleton and pain-related region of interest analyses ... 42
Association of DTI metrics with clinical and psychosocial measures ... 43
Discussion ... 44
WM skeleton abnormalities in TBSS ... 44
Global and regional differences of DTI metrics in the whole brain and WM skeleton ... 47
Figures ... 53
Tables ... 60
CHAPTER 3: ASSESSMENT OF BRAIN MACRO-STRUCTURAL CHARACTERISTICS IN FIBROMYALGIA USING HIGH-RESOLUTION T1-WEIGHTED ANATOMICAL IMAGING ... 66
Introduction ... 66
Methods ... 67
Imaging data processing pipelines ... 67
Statistical analyses ... 73
Results ... 73
Subjects demographics characteristics, clinical measures and questionnaires .... 73
Brain tissue volumes estimation ... 73
Gray matter assessment via voxel-based morphometry ... 74
Subcortical structures segmentation and volumetric analyses ... 75
Assessment of brain cortical and subcortical characteristics ... 75
Discussion ... 76
Figures ... 81
Tables ... 88
CHAPTER 4: OVERALL IMPLICATIONS OF PRESENT FINDINGS AND FUTURE DIRECTIONS ... 94
Present findings overview ... 94
Future directions ... 96
LIST OF TABLES
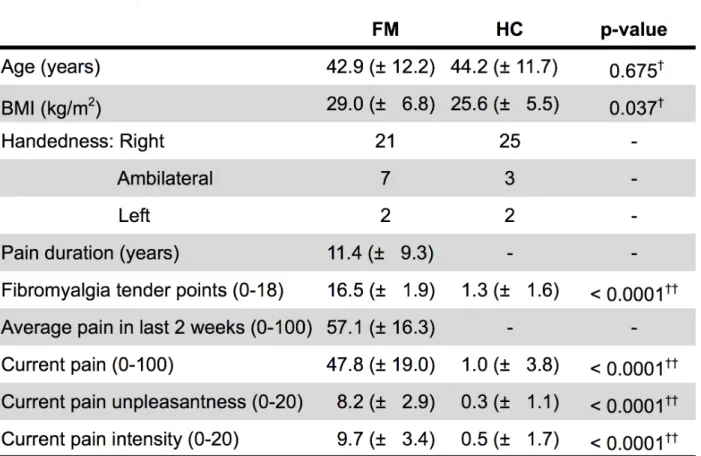
Table 1.1. Demographic characteristics and clinical measures. ... 27
Table 1.2. Questionnaires scores. ... 28
Table 2.1. Locations with lower fractional anisotropy in FM patients compared to controls. ... 60
Table 2.4. Correlations for DTI metrics in the whole brain and white matter skeleton voxels. ... 63
Table 2.5. Correlations for DTI metrics for non-skeletonised pain-related regions of interest. ... 64
Table 2.6. Correlations for DTI metrics in FM patients only for white matter skeletonised pain-related regions of interest. ... 65
Table 3.1. Brain tissue volumes estimates. ... 88
Table 3.2. Gray matter volume as measured by voxel-based morphometry. ... 89
Table 3.3. Subcortical structures volume estimates. ... 90
Table 3.5. Gyral white matter volume measurements. ... 92
LIST OF FIGURES
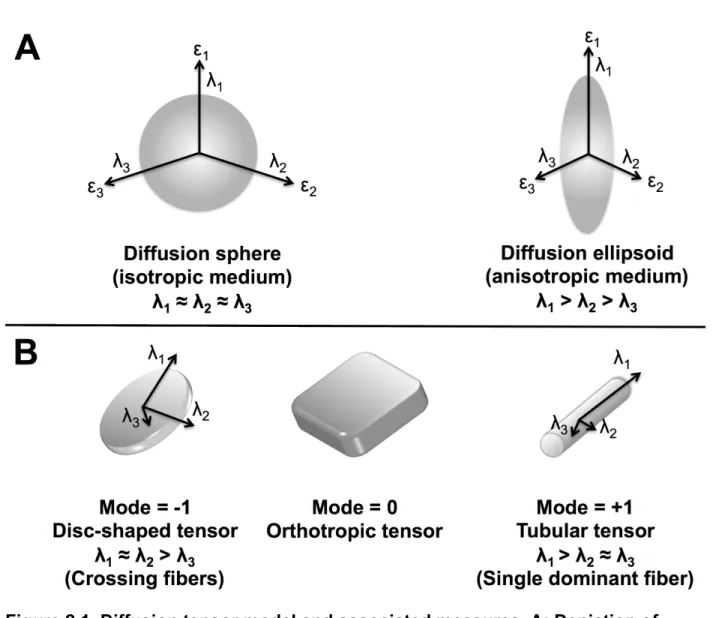
Figure 2.1. Diffusion tensor model and associated measures ... 53
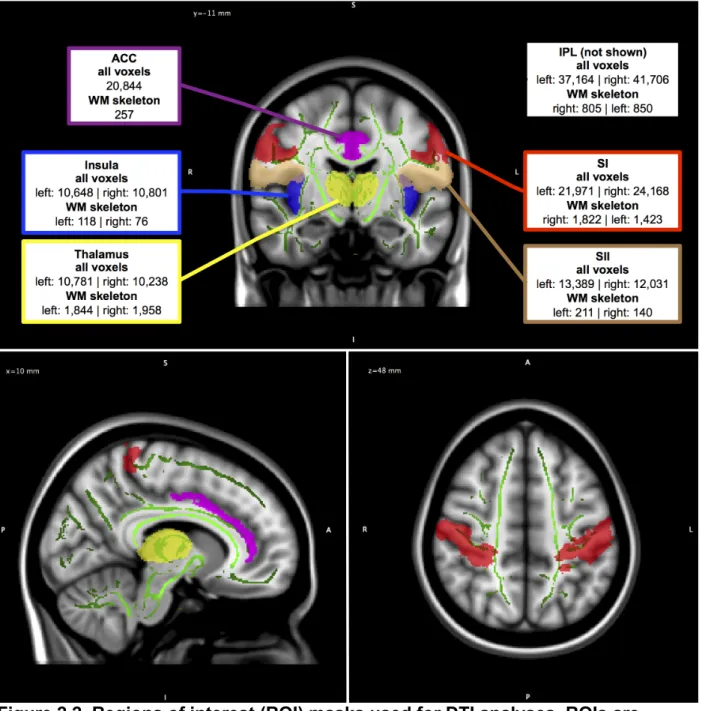
Figure 2.2. Regions of interest (ROI) masks used for DTI analyses ... 54
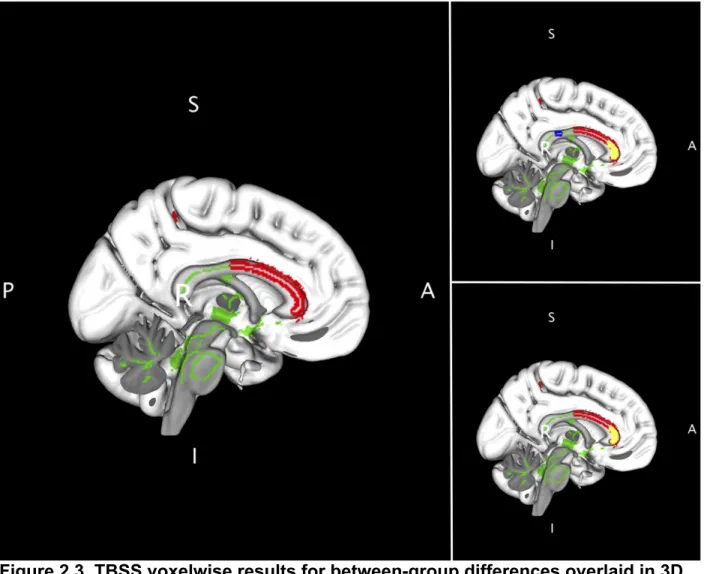
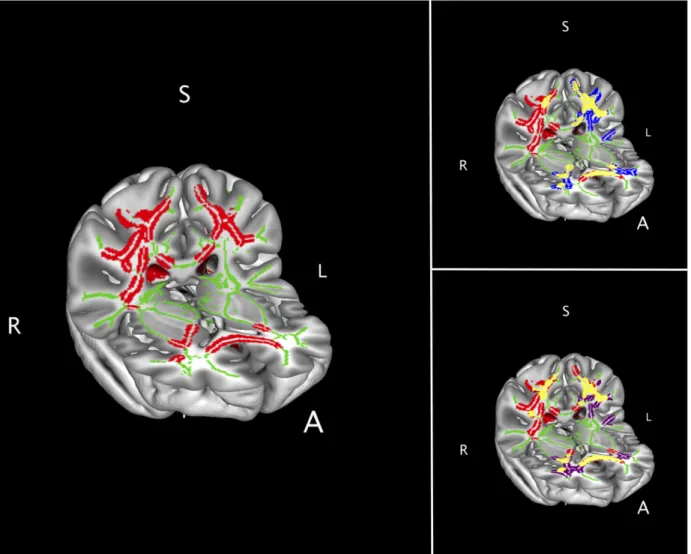
Figure 2.3. TBSS voxelwise results for between-group differences overlaid in 3D MNI brain template shown in sagittal view, highlighting the corpus callosum ... 55
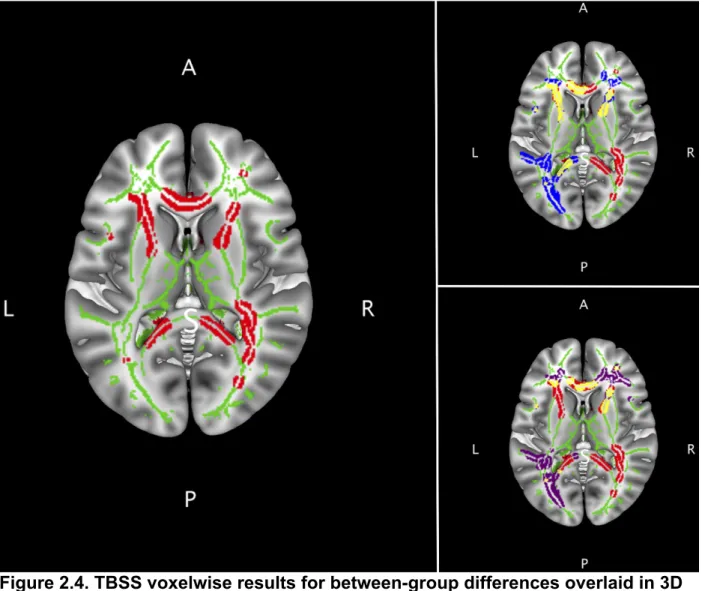
Figure 2.4. TBSS voxelwise results for between-group differences overlaid in 3D MNI brain template shown in axial view, highlighting the corpus callosum and internal capsule ... 56
Figure 2.5. TBSS voxelwise results for between-group differences overlaid in 3D MNI brain template shown in axio-coronal view, highlighting the corticospinal tracts ... 57
Figure 2.6. TBSS voxelwise results for between-group differences overlaid in 3D MNI brain template shown in axio-coronal view, highlighting the white matter adjacent to SI and M1 ... 58
Figure 2.7. DTI metrics mean values for whole brain and WM skeleton voxels ... 59
Figure 3.1. Brain segmentation for volumes estimates ... 81
Figure 3.2. Study-specific gray matter (GM) template and regions of interest (ROI) ... 82
Figure 3.3. Left and right amygdala volumes ... 83
Figure 3.4. Brain cortical parcellations and subcortical regions used for region of interest (ROI) analyses in 2D view ... 84
Figure 3.5. Brain cortical parcellations used for region of interest (ROI) analyses in 3D view ... 85
Figure 3.6. Left and right insula gyral WM volumes ... 86
LIST OF ABBREVIATIONS ACR American College of Rheumatology AD Axial diffusivity
CNS Central nervous system CSF Cerebral spinal fluid DTI Diffusion tensor imaging DWI Diffusion weighted imaging FA Fractional anisotropy
FM Fibromyalgia
fMRI Functional magnetic resonance imaging FSS Functional somatic syndrome
GM Gray matter MD Mean diffusivity
MNI Montreal Neurological Institute MO Mode of anisotropy
MRI Magnetic resonance imaging NRS Numerical rating scale
RD Radial diffusivity
CHAPTER 1: INTRODUCTION, METHODS OVERVIEW AND SUBJECT SAMPLE DESCRIPTION
Introduction
When one ponders on the meaning of the word “pain”, some possibilities arise. It could refer to the conscious experience related to bodily injury or disease processes, which is probably one of the most common interpretations. Another possible meaning would be the discomfort associated with unpleasant feelings, such as the separation from a spouse or the mourning of a loved one. This dichotomous view on pain is present for millennia, dating from the times of the ancient Greek philosophers such as Aristotle (Perl, 2007; Cervero, 2009). In the last centuries, competing pain theories developed describing distinct features: i. Following a noxious stimulus in peripheral tissues (e.g., skin), dedicated pain receptors in the periphery detect and transmit the noxious input through pain specific pathways to the brain (specificity theory); ii. Peripheral stimulus intensity as transduced by unspecialized afferent fibers would dictate a non-painful (innocuous stimulus) or painful (intense stimulus) perception
according to the level of neuronal discharge (intensity theory); or iii. Peripheral receptors, irrespective of sensory input modality, following an intense stimulation would trigger a sequence of impulses in peripheral and central neurons in particular spatial and
be considered to some extent in different scenarios of clinical and experimental pain (Prescott et al., 2014).
The complexity of the pain phenomenon is well recognized currently, where the view of it as a dedicated “alarm system” that serves solely a protective function for survival and well being is not sufficient. Pain is now considered a multi-dimensional experience, that includes sensory-discriminative, affective-motivational and cognitive-evaluative components (Treede et al., 1999). This multidimensionality is embedded within the definition of pain provided by the International Association of Pain (IASP) (Merskey and Bogduk, 1994):
“An unpleasant sensory and emotional experience associated with actual or potential tissue damage, or described in terms of such damage.”
This definition includes distinct aspects related to pain: it is a subjective (i.e., personal and individualized) experience that encompasses both sensory and emotional components, and tissue damage does not necessarily have to take place. Given this inherent intricacy, it is not a surprise that several types of pain exist such as nociceptive, inflammatory or neuropathic (Cervero and Laird, 1991; Cervero, 2009). The first two types of pain are considered physiological and serve to protect an individual from harm. Neuropathic pain however, where even innocuous peripheral stimuli can evoke pain, can be considered a neurological disease secondary to damage or dysfunction of the peripheral and/or central nervous systems.
and can be seen as a pathological process (Davis, 2013), with ample evidence of associated functional, structural and neurochemical brain changes (Tracey and
Bushnell, 2009). The processes related to the transition from acute to chronic pain are not completely understood (Mifflin and Kerr, 2014), nonetheless predictors of this transition are under investigation (Apkarian et al., 2013).
The aforementioned complexity of pain is well represented in puzzling clinical conditions considered together under the term “functional somatic syndrome”. It refers to related syndromes where symptoms, suffering and disability better characterize the clinical presentation than disease-specific structural or functional abnormalities (Barsky and Borus, 1999). Functional somatic syndromes (FSS) usually are not present in isolation but rather with one or more comorbid pain conditions (Wessely et al., 1999; Aaron and Buchwald, 2001), and previous diagnosis of a FSS is a strong risk factor for other FSSs (Warren et al., 2013). These associations of comorbid pain conditions likely represent underlying common pathophysiological mechanisms (Yunus, 2007), and studies based on mechanism-driven hypotheses might help understand each
gathered. What follows is a brief description of the history and current accepted knowledge of FM.
Fibromyalgia: an overview Early studies of fibromyalgia
Initial reports of a condition with similar clinical presentation as FM can be traced back to the beginning of the 20th century. Sir William Gowers provided a comprehensive description of what was known then about this condition and proposed naming it
“fibrositis”, as it was believed to be some form of “inflammation of the fibrous tissue of the muscles” (Gowers, 1904). Almost fifty years later, Graham described the
controversy surrounding “fibrositis” within the rheumatology specialty and how it became a “depot for many varieties of non-articular rheumatism” (Graham, 1953). Of note, he mentions the lack of evidence for an inflammatory etiology for this condition and therefore questioning the propriety of that term (“-itis” = inflammation).
Moldofsky and colleagues provided interesting insights in systematically investigating sleep disturbances using electroencephalography (EEG) in FM patients and in healthy controls following sleep deprivation (Moldofsky et al., 1975). They
reported a disruption in the EEG sleep pattern in FM patients named “alpha-delta” sleep, and that a 3-night sleep deprivation during the non rapid eye movement (REM) stages elicited musculoskeletal and mood symptoms in healthy controls similar to those seen in FM patients. Following recovering nights with undisrupted sleep, healthy controls
Following these observations, Smythe and Moldofsky proposed criteria for the diagnosis of “fibrositis”, that could differentiate FM patients from patients suffering from other diffuse pain syndromes, malingering or neuroticism (Smythe and Moldofsky, 1977). Many consider this seminal work the birth of the modern concept of FM (Clauw, 2009; Wolfe and Hauser, 2011). A comprehensive clinical description of 50 FM patients and 50 age-, sex- and race-matched healthy controls was offered by Yunus and
collaborators, where they also proposed using “fibromyalgia” as opposed to “fibrositis” given the lack of evidence for inflammation as a etiological factor for the so-called primary FM (i.e., “when no known cause or associated contributory disorder is present”) (Yunus et al., 1981). Additional early studies have shown no specific personality profile for FM patients, and that pharmacological (antidepressants, non-steroidal
anti-inflammatory drugs, chlorpromazine) and non-pharmacological (strenuous physical exercise) treatment modalities provided significant improvements in FM symptoms (McCain and Scudds, 1988).
Fibromyalgia classification and diagnostic criteria
might exclude patients that present several but not all signs and symptoms to meet the ACR 1990 FM classification criteria (Clauw, 2009).
Partly to overcome this limitation and to address objections from different parties to the ACR 1990 FM classification criteria, new diagnostic criteria for FM were offered in 2010 (Wolfe et al., 2010). The most significant change was removing the requirement for tender point examination and count. In addition, two metrics were developed: 1. Widespread pain index (WPI), where the investigator notes how many body areas (out of 19) the patient had pain in the last week; and 2. Symptom severity (SS) scale, that considers the severity of fatigue, waking unrefreshed and cognitive symptoms plus the extent of somatic symptoms in general (score range: 0-12). To satisfy the ACR 2010 FM diagnostic criteria a patient must meet three conditions: i. Either a WPI ≥ 7 and SS ≥ 5, or WPI 3-6 and SS ≥ 9; ii. Symptoms must be present at similar levels for at least 3 months; and iii. No presence of other disorder that could explain the pain (Wolfe et al., 2010). The authors stressed that these diagnostic criteria were not meant to replace the ACR 1990 criteria, but rather offer an alternative method of diagnosis.
With the goal of developing criteria that allowed self-administration thus eliminating the need for an interviewer, a modification of the ACR 2010 diagnostic criteria was proposed (Wolfe et al., 2011). To achieve that goal, the SS scale was modified in a way that, instead of having a somatic symptoms list to check, patients respond “yes” or “no” to the presence of headaches, pain / cramps in the lower
simply the sum of the WPI and the modified SS with a score range of 0-31; a score of ≥ 13 was shown to have good sensitivity and specificity for identifying FM (Wolfe et al., 2011). Given the self-administering feature of this modified criteria, the authors provided a cautionary note that this instrument does not serve as a self-diagnosis tool or
substitutes a physician’s diagnosis.
These recent criteria were received with mixed opinions, and several researchers argued about the added value they brought beyond that offered by the accepted ACR 1990 FM classification criteria (Wolfe and Hauser, 2011; Abbi and Natelson, 2013; Hannonen, 2013). Nonetheless, these criteria are recognized as valuable instruments in designing studies that will help elucidate etiological factors, identify more homogenous subgroups of patients and develop targeted treatments (McBeth and Mulvey, 2012).
A supplementary issue to the classification of FM is the recognition (or the lack thereof) of it as a valid clinical entity (Ablin et al., 2012). On one side are those who defend that FM is no more than a collection of symptoms, i.e., “aches and pain that all people often have” at some point in life (Ehrlich, 2003). On the opposite side are investigators who, although acknowledging the limitations in the available FM criteria and that those affected by this condition may be at “end of the bell-shaped curve”, understand that FM arises from altered pain processing mechanisms as shown by several studies (Harris and Clauw, 2006). In an article named “Fibromyalgia wars”, Wolfe explores the myriad of interests of different agents pro and against having FM as a legitimate diagnosis: patients, some specialty physicians vs. the majority of physicians, pharmaceutical companies, professional organizations, patients’ support groups,
literature on this topic, it becomes clear that FM is a controversial subject in the
scientific and medical field, and that it impacts not only the affected patients but also the society at large.
Etiology, pathophysiology and treatment of fibromyalgia
Several studies have investigated the pathophysiology of FM, trying to determine etiological (i.e., causative) factors and pathophysiological (i.e., functional changes associated with a condition) mechanisms of this syndrome. Different investigational approaches brought some light on putative etiological factors in FM, even though some early studies tended to have relatively small samples that make interpretation of its results difficult.
Genetic factors seem to play an important role in FM, given the familial
aggregation found where having a relative with FM increased the odds of other relatives presenting it (Buskila and Neumann, 2005), with one study showing odds ratio of 8.5 when compared to families with one member affected by rheumatoid arthritis (Ablin et al., 2006). Family members of FM patients are more sensitive to pain than controls, and they also have higher rates of comorbid conditions including irritable bowel syndrome (IBS), temporomandibular disorders (TMD), headaches or other regional pain
while no associations were found for 5-HTT and COMT (Lee et al., 2012). Given the evidence for genetic factors in FM, some environmental triggers associated with FM have been described. Among those are physical trauma, some infections (mostly viral), and emotional stress (Clauw, 2009).
Impairment of the stress responses and dysfunction of the hypothalamic-pituitary-adrenal (HPA) axis are linked to FM, however the abnormalities found varies across studies (Clauw, 2009). Disturbances in the autonomic nervous system are described in FM including postural orthostatic tachycardia (Staud, 2008), hyperactivity at rest / hyporeactivity during stress (Martinez-Lavin, 2007), and abnormalities in heart rate variability (Staud, 2008; Lerma et al., 2011). Proinflammatory cytokines were found to be mildly increased in FM patients compared to controls, however the methodological quality of those studies was considered low thus preventing a better understanding on the role of cytokines in FM pathophysiology (Uceyler et al., 2011).
Mood disorders like anxiety and depression are commonly reported in FM
patients, but this could be attributed at least partly to sampling bias by selecting patients from tertiary care centers (Clauw, 2009). Sleep disturbances are part of the core
symptoms of FM, and several recent studies provide additional support for the role of sleep based on questionnaires (Osorio et al., 2006; Munguia-Izquierdo and Legaz-Arrese, 2011) and polysomnography (Shah et al., 2006) data. However, sleep measures determined by 24-hour actigraph use and sleep diary for 14 days failed to predict clinical pain levels (Anderson et al., 2012).
Rodriguez, 2006). An interesting finding was abnormalities related to the temporal summation of pain or “wind-up”, which is the increased pain sensation that arises when identically intense stimuli are presented repeatedly; it has been shown to result from central mechanisms that involve the N-methyl-D-aspartate (NMDA) receptor system. FM patients exhibit wind-up following experimental stimuli (mechanical, thermal, electrical) at lower frequencies and lower stimulus intensities than controls, and after sensations are more intense, longer-lasting and are more painful in patients (Staud, 2006).
In fact, augmented sensory and pain processing in FM is well supported by evidence. Using sophisticated psychophysical methodology in which stimuli
presentation was done in a random fashion, Petzke and colleagues demonstrated that FM patients are more sensitive to pressure and heat than healthy controls (Petzke et al., 2003) however the increased pain sensitivity is dissociated from pain unpleasantness ratings (Petzke et al., 2005). Sensitivity to other stimulus modalities such as cold and electrical are not different between FM patients and controls, however patients do exhibit lower thresholds to noxious auditory tones (Clauw, 2009). One potential explanation for the augmented pain processing in FM is a deficiency in endogenous analgesics system such as the diffuse noxious inhibitory controls (DNIC) (McBeth and Mulvey, 2012), and this might be related to impaired serotonergic and noradrenergic activity but not opioidergic activity - since the latter was found to be normal or even increased in FM (Clauw, 2009).
quality of life (Timmerman et al., 2013). Peripheral factors as part of FM etiology have been investigated before but the evidence provided was considered weak (Abeles et al., 2007), however small nerve pathology got some attention in 2013 when two studies reporting this were published a few months apart. In the first study published by a German group (Uceyler et al., 2013), they used three methods (quantitative sensory testing, pain-related evoked potentials, and skin punch biopsies) that converged in supporting impaired small nerve fiber function in FM patients. The second study used standard tests for clinical diagnostic criteria of small-fiber polyneuropathy (distal-leg skin biopsy and autonomic function testing) in FM patients and matched controls (Oaklander et al., 2013), and showed that over 50% of FM patients exhibited evidence of small-fiber polyneuropathy compared to 17.2% of controls. The fact that two different groups found reproducible findings is promising, even though they are not in agreement of the specific pathology affecting small nerve fibers (Uceyler and Sommer, 2013).
Neuroimaging studies have provided much new information about FM
pathophysiology, and they will be addressed separately in a later section of this chapter. Treatment options for FM are numerous, since the above discussed mechanisms may play a role for the expression of FM symptoms in each patient in different degrees thus an individualized treatment plan is of utmost importance (Staud, 2007). Non-pharmacological options include physical therapy modalities (thermal, electrical
(Busch et al., 2011). The pharmacotherapy for FM reported in the literature is broad, including several categories such as analgesics, muscle relaxants, antidepressants, anticonvulsants, sedative-hypnotic drugs, among others; the evidence for benefit is equally diverse ranging from no efficiency to those showing strong evidence of benefit (Clauw, 2009). Three drugs are currently approved by the U.S Food and Drug
Administration (FDA) for treatment of FM: pregabalin (an alpha2-delta calcium channel ligand), duloxetine and minalcipran (both are serotonin-norepinephrine reuptake
inhibitors) (Hsu, 2011). Despite the numerous options for treatment, prognosis of FM is in general somber with limited improvements over periods of up to 10 years (McBeth and Mulvey, 2012). A study that followed 1,555 FM patients semi-annually with questionnaires for up to 11 years showed no clinically meaningful symptomatic improvement, however 25% had at least moderate improvement of pain over time (Walitt et al., 2011). It has been suggested that the prognosis might depend on where a particular FM patient falls within the disease severity spectrum (Clauw, 2009), and this must be taken into account when developing a treatment plan for each individual. Epidemiology and health care cost of fibromyalgia
countries spanning four continents (Africa, the Americas, Asia and Europe) (Queiroz, 2013). The estimated global mean prevalence of FM was 2.7% (range = 0.4 – 9.3%), with a mean prevalence for women of 4.2% and for men 1.4% (female:male ratio = 3:1). Incidence of FM was estimated in two studies only, with one reporting an incidence of 5.83 new cases per 1,000 persons-years for females only while the other described numbers of new FM cases per 1,000 person-years as 11.28 for females and 6.88 for males (Queiroz, 2013).
Health care costs associated with FM are higher when compared to non-FM patients. Using a U.S. health insurance database to determine characteristics and
health care costs within a 12-month period, FM patients had three-fold higher mean cost and four times more doctor office visits when compared to non-FM patients (Berger et al., 2007). More recently, a retrospective study from the Quebec provincial health plans reported that the annual number of visits for FM patients was 25.1 with an associate cost of $ 4,065, while non-FM patients had a mean of 14.8 visits and costs of $ 2,766 (Lachaine et al., 2010).
Brain characteristics in fibromyalgia assessed by neuroimaging techniques Pain research in humans has benefited from recent advancements in
neuroimaging, since it allows probing brain functional and structural characteristics in vivo with minimal to no invasiveness. Numerous neuroimaging technologies have been used for the study of pain including magnetic resonance imaging (MRI),
complex genetic relationships through the concept of endophenotypes, i.e., a
measurable component (such as neuroimaging measurements) of a clinical condition that has a more direct link to the underlying genetics than the condition itself (Tracey, 2011).
Diverse neuroimaging techniques have been used to investigate brain characteristics of FM patients, as the numerous reviews on the subject describe
(Williams and Gracely, 2006; Cook et al., 2007; Nebel and Gracely, 2009; Gracely and Ambrose, 2011; Staud, 2011; Jorge and Amaro, 2012). Here the focus will be on MRI-based modalities, as this dissertation uses only this technique.
MRI generates images of the body through the use of strong magnetic fields and radiofrequency pulses. The well studied properties of hydrogen nuclei (which are
abundant in the human body in water molecules) when placed within a strong magnetic field allows investigators to manipulate several variables in order to generate brain images with different characteristics. In a very crude description, MRI modalities can generate brain images through exploring distinct magnetic properties of brain tissues, e.g.,: i. In high-resolution structural imaging, the gray and white matter and cerebral spinal fluid (CSF) can be distinguished according to their unique magnetic relaxation time (T1); ii. Functional MRI (fMRI) can detect the levels of blood oxygenation across the
MRI is sensitive to changes over time of neuronal activity, while structural MRI measures biophysical properties of local brain tissue (Smith et al., 2004).
Stimulus-evoked fMRI studies in FM are abundant. The first such study was developed by Gracely and collaborators in 2002, using blunt pressure to the thumb nail as stimulus (Gracely et al., 2002). They used a pressure level able to evoke pain in 16 FM patients, and used two pressure levels in 16 controls: higher pressure level in order to elicit comparable subjective pain ratings or a lower pressure level that matches that used for the FM patients. Brain activations were similar for both groups only when matched for subjective pain ratings (using much greater pressure for controls), while no common activations were found following matched pressure level stimuli in both groups. These results were replicated when painful heat was used as stimulus (Cook et al., 2004). Other notable findings using fMRI following noxious thumb pressure stimulation in FM patients were association of depression (Giesecke et al., 2005) and
catastrophizing (Gracely et al., 2004) scores to brain activations that failed to be
reproduced in subsequent studies (Jensen et al., 2010; Burgmer et al., 2011), and also reduced activation in rostral anterior cingulate cortex compared to controls (Jensen et al., 2009). Other types of stimuli and cognitive tasks have been also used in fMRI studies with FM patients, along with resting-state BOLD studies where the functional connectivity of the brain is investigated and magnetic resonance spectroscopy to measure neurochemical metabolites to infer brain properties related to pathology and pharmacological manipulation (Gracely and Ambrose, 2011).
Schmidt-Wilcke et al., 2007; Luerding et al., 2008; Burgmer et al., 2009; Hsu et al., 2009; Robinson et al., 2011) or VBM with another MRI modality such as diffusion weighted imaging (Lutz et al., 2008) or imaging technique like positron emission
tomography (Wood et al., 2009). Diffusion weighted imaging was used alone in an early study (Sundgren et al., 2007) and recently a cortical thickness analysis was done in conjunction with functional connectivity of stimulus-evoked BOLD measurements (Jensen et al., 2013) as well as a multi-modal MRI using both functional and structural imaging in FM patients (Ceko et al., 2013). These studies will be described in more details in the respective chapters on diffusion weighted (chapter 2) and high-resolution anatomical imaging (chapter 3).
Rationale for investigating brain structural characteristics of fibromyalgia
group showed gray matter decreases compared to controls, while the past pain group did not. Other interesting recent findings in healthy controls were that lack of habituation to noxious stimuli is associated with gray matter reductions (Stankewitz et al., 2013) and a negative association between pain ratings and gray matter density (Emerson et al., 2014). These studies show that other variables besides patient status might explain gray matter morphometric differences, and those must be taken into account when interpreting results from clinical samples.
Diffusion MRI can probe tissue micro-structure in a non-invasive manner,
providing unique brain information on the microscopic scale in both health and disease states (Le Bihan, 2003). Two early studies reported DWI data from FM patients
(Sundgren et al., 2007; Lutz et al., 2008). These pioneering studies, while valuable, were limited by the available technology, i.e., use of 1.5 Tesla MR scanners, low number of encoding directions, manually drawn ROIs, and focus on only 2 diffusion metrics (apparent diffusion coefficient and fractional anisotropy). Current MR technology and software packages for neuroimaging analyses allow a more extensive approach to DWI, for both data acquisition (higher signal-to-noise ratio from higher magnetic fields, greater number of diffusion-encoding directions, cardiac-gate acquisition, brain
probabilistic atlases for region of interest selection among others) and processing
(several available software packages for DWI data analysis) (Hasan et al., 2011; Soares et al., 2013).
From the aforementioned, it seems possible that the brain structural characteristics in FM have been underexplored. In order to address this gap of
of brain micro- and macro-structural characteristics in FM patients using reference data from healthy, painfree control subjects.
Objectives
The objectives of this dissertation were:
• To recruit a relatively large sample of FM patients and age- and
sex-matched controls and perform a detailed characterization based on demographic attributes, clinical measures and psychosocial instruments; • To determine global and regional micro-structural brain tissue
characteristics using diffusion weighted imaging for those subjects; and • To do a comprehensive assessment of brain macro-structural features for
both FM and control subjects using high-resolution anatomical imaging, which includes brain volume estimation, gray matter assessment, subcortical structures segmentation and volumetric analysis, and measurement of brain cortical and subcortical characteristics. Methods overview
In this section, an overview of the methods used in this dissertation will be provided. All subjects recruited as described below participated in the studies reported in subsequent chapters, and their data (demographic characteristics, clinical measures, questionnaires scores) were used accordingly where appropriate for particular analyses as outlined in each chapter.
Subjects
through advertisements in the local community. A calibrated examiner assessed all subjects using the 1990 ACR classification criteria (Wolfe et al., 1990). Additionally, FM patients were also assessed using the ACR 2010 diagnostic criteria (Wolfe et al., 2010). Inclusion criteria for FM patients were: 1) female patients with age between 18 and 64 years; and 2) fulfillment of the ACR 1990 FM classification criteria. Exclusion criteria for all subjects were: 1) significant hearing loss (determined by self-report and hearing screening) or the use of hearing aid; 2) medical conditions capable of worsening physical functional status independent of FM (e.g., morbid obesity, cardiopulmonary disorders, uncontrolled hypertension, uncontrolled endocrine or allergic disorders, disorders of vestibular system, renal disorders, seizures, psychiatric disorders requiring hospitalization ≤ 6 months, cancer within the last 2 years or current chemotherapy / radiation treatment); 3) current substance abuse; 4) pregnancy; or 5) any typical MRI contraindication, including claustrophobia. Patients taking opioid medications on a regular basis were also excluded. Participants were allowed to continue with their regular medication regimen; however, they were asked to avoid any analgesic medication 24 hours prior to the MRI session. Healthy controls reported no current chronic pain condition at the time of enrollment. Informed consent was obtained from all study participants for procedures approved by the Institutional Review Board at the University of North Carolina (UNC) at Chapel Hill.
(stimulus-evoked BOLD, resting-state BOLD, resting-state arterial spin labeling) in addition to the herein reported diffusion weighted and high-resolution T1-weighted anatomical imaging. Demographic characteristics and clinical measures
Age, weight and height were collected from all subjects by self-report. We assessed handedness by using the scale proposed by Chapman and Chapman
(Chapman and Chapman, 1987). It consists of 13 items that describes several specific activities where the participant must answer, “which hand you ordinarily use for each activity” (1-right, 2-either, 3-left). It yields a summed score that can range from 13 (completely right-handed) to 39 (completely left-handed). We used the cut-off ranges suggested by those authors: right-handed = 13-17, left-handed = 33-39, ambilateral = 18-32.
FM patients reported the average pain level in the past 2 weeks using a 0-100 numerical rating scale (NRS; anchors: 0 = No pain, 100 = Most intense pain imaginable). They were also asked to report the time in years since the onset of their widespread pain. At the day of the MRI scanning, all participants were asked to rate their current pain level using the 0-100 NRS, and they also rated separately their current pain intensity and pain unpleasantness using the 0-20 Gracely’s box scales (Gracely et al., 1978).
Questionnaires
Measures of affective distress
extensively validated (Beck et al., 1988). The sum of all items gives the total score, which ranges between 0-63.
Level of trait anxiety was measured using the State-Trait Anxiety Inventory (STAI Y2) (Spielberger et al., 1983). Participants rated how they generally feel by answering each of the 20 items using a 4-category scale (1 = Almost Never; 2 = Sometimes; 3 = Often; 4 = Almost Always). The total score is the sum of all items scores, ranging from 20 to 80.
Measure of psychosocial stress
The perceived stress scale (PSS) is 10-item scale that assesses the perception of stress (Cohen et al., 1983). Participants indicate for each item how they felt or thought in the previous month using a 5-category scale (Never, Almost Never,
Sometimes, Fairly Often, Very Often). The total perceived stress score is the sum of the weights of all items (0-4), ranging from 0 to 40.
Measure of coping
The Coping Strategies Questionnaire-Revised (CSQ-R) is a revised version of the originally proposed CSQ (Rosenstiel and Keefe, 1983), and it is composed of 27 items that are related to the strategies used by individuals to cope with pain. For each item, the participants indicate how frequent they engaged in a particular coping strategy using a 7-category numerical scale (anchors: 0 = Never do that; 6 = Always do that). Six subscales measuring different strategies used by the individual are derived:
Measure of somatic awareness
Somatic awareness, or the general tendency to endorse physical symptoms, can be estimated through the Pennebaker Inventory of Limbic Languidness (PILL)
(Pennebaker, 1982). This questionnaire is composed of 54 items that describes physical symptoms and the participant answers how often each occur in a 5-category scale (Never or almost never have, Less than 3 or 4 times per year, Every month or so, Every week or so, More than once every week). The PILL summary score was derived by summing the scores for each of the 54 items.
Additional questionnaires (pain descriptors, sleep quality)
The short-form McGill pain questionnaire (SF-MPQ) provides information on the dimensions of clinical pain (Melzack, 1987). The version used in the present study includes the 15 pain descriptors that the participant must rate the intensity in a 4-category scale (None, Mild, Moderate, Severe). The pain descriptors can be divided in sensory or affective, and by summing the respective items two scores are formed (range for sensory score = 0-33; affective score = 0-12).
MRI scanning session
All participants underwent a single MRI scanning session at the Biomedical Research Imaging Center at UNC-Chapel Hill, using its 3-Tesla Trio Siemens MR scanner with a 12-channel head coil. Prior to entering the scanner room participants filled the 0-100 NRS for current pain and the Gracely’s box scales for pain intensity and unpleasantness, and they were instructed on what to expect during the scanning (high level of noises and vibrations, avoidance of head motion during imaging acquisition, ability to communicate with investigators at any time if needed). Once in the scanner room, participants were fitted comfortably on the scanner bed with a leg support pillow. Their head was padded with foam pads to minimize movements and ear muffs were used for hearing protection. A vitamin E capsule was attached to the right temple of the participants’ head to avoid right-left ambiguities during imaging data processing and analysis. Physiological monitoring was done by fitting a peripheral pulse oximeter to the participant’s left index finger and a respiration belt. Communication with participants was established via intercom in between imaging runs. After all imaging data were acquired, participants were removed from the scanner and debriefed for any discomfort or problems during the scanning.
Details for diffusion weighted and high-resolution anatomical imaging acquisition parameters will be offered in the respective chapters.
Statistical analysis
the independent samples t-test (2-tailed). Non-normally distributed data were tested using the independent samples Mann-Whitney U test (2-tailed). All statistical tests were considered significant at p < 0.05.
Results
Demographic characteristics and clinical measures
Subjects’ demographic characteristics and clinical measures details are offered in Table 1.1. We used the ACR 1990 FM classification criteria as the inclusion criterion for the patient group, and found discordance in 3 patients that met the classification but did not fit the ACR 2010 FM diagnostic criteria. As a result of the matching procedure, the participants’ age did not significantly differ between groups (FM patients mean age ± SD: 42.9 ± 12.2 years; controls: 44.2 ± 11.7 years; p = 0.675), with a wide range
observed (FM patients minimal and maximum age: 23 - 63; controls: 23 - 61). Body mass index (BMI) was calculated for all subjects in units of kg/m2 and it was significantly
The duration of widespread pain for FM patients was 11.4 years (± 9.3) on
average, with a range of 1 to 40 years. Average pain in the last 2 weeks was a minimum of 25 and a maximum of 85 using the 0-100 NRS (mean ± SD: 57.1 ± 16.3). At the day of MRI scanning, FM patients rated their current pain (0-100 NRS: 47.8 ± 19), current pain unpleasantness (0-20: 8.2 ± 2.9) and intensity (0-20: 9.7 ± 3.4) significantly different than controls (p < 0.0001) as expected.
Questionnaires
Measures of affective distress, psychosocial stress, coping, and somatic awareness were markedly higher for FM patients compared to controls (Table 1.2). Depressive symptoms and trait anxiety as measured by BDI and STAI Y2, respectively, were significantly greater for the patient group (p < 0.0001). Psychosocial distress as perceived by participants was highly significantly different between groups (FM patients: 18.8 ± 8.3; controls: 9.7 ± 6; p < 0.0001). From the coping strategies measured by the CSQ-R, only catastrophizing (p < 0.0001) and ignoring pain (p < 0.017) reached statistical significance for group differences. Somatic awareness, derived from PILL scores, was significantly greater for FM patients (153.8 ± 36.7) compared to controls (84.9 ± 20.8) (p < 0.0001).
Discussion
The present subject sample was well characterized using several demographic characteristics and clinical measures, with results reported here consistent with
previous literature including BMI (Ursini et al., 2011; Timmerman et al., 2013). Many of the psychosocial measures described have been used in neuroimaging studies of FM patients (Schmidt-Wilcke et al., 2007; Jensen et al., 2010; Burgmer et al., 2011; Jensen et al., 2013). Assessment of sleep quality in FM using the PSQI has been performed previously, with similar results (Osorio et al., 2006; Munguia-Izquierdo and Legaz-Arrese, 2011). Given the use of validated classification criteria for FM, the
Tables
CHAPTER 2: ASSESSMENT OF BRAIN MICRO-STRUCTURAL CHARACTERISTICS OF FIBROMYALGIA PATIENTS USING DIFFUSION
TENSOR IMAGING Introduction
Augmented pain and sensory processing is considered a main feature of
fibromyalgia (FM) presentation. At least part of its putative mechanisms likely originate from the central nervous system (CNS) with several lines of evidence supporting this view (Clauw, 2009), including central sensitization mechanisms such as the “wind-up” phenomenon and impaired pain modulatory systems being described in FM patients. Neuroplastic brain changes in chronic pain is well described (Latremoliere and Woolf, 2009; Siddall, 2013), and it is corroborated by neuroimaging studies (Seifert and
Maihofner, 2011). Neuroplasticity within the brain is one putative mechanism in FM and concurs with a role for the CNS in its pathophysiology, with functional, neurochemical, and structural brain abnormalities in patients when compared to controls being
described (Gracely and Ambrose, 2011).
dissimilarities between FM patients and controls, and attributed these discordant results between both studies to methodological differences (Lutz et al., 2008). These
pioneering studies did not benefit from recent methodological improvements in diffusion MRI, including advancements in MR scanners technology, computational methods and availability of dedicated software packages (Hasan et al., 2011; Soares et al., 2013). Recently a study using multi-modal MRI including diffusion reported regional WM abnormalities in FM patients relative to age-matched controls (Ceko et al., 2013)
The main goal of the present study was to determine brain micro-structural characteristics in FM patients, and assess potential WM abnormalities using age-matched controls as reference. Diffusion MRI allows this in a non-invasive manner, by measuring water molecule diffusion within the brain tissues. It is a versatile MRI
modality not only for research but also for clinical uses, e.g., detection of acute brain ischemia (Sundgren et al., 2004). Our main focus was to assess micro-structural features of: i. WM tracts using tract-based spatial statistics (TBSS), and ii. Whole brain and pain-related regions of interest (ROI). We hypothesized that FM patients would present both global and regional brain WM abnormalities when compared to matched controls, including pain-related areas of the brain.
Methods
Imaging acquisition parameters
factor = 2 (GRAPPA)) acquired along 42 non-collinear, non-coplanar directions (b = 1,000 s/mm2). Two dummy volumes were acquired and discarded to allow the
longitudinal magnetization to reach a steady state prior to data acquisition. Seven non-diffusion weighted images (B0; b = 0 s/mm2) were acquired at equidistant points
throughout the acquisition at a ratio of one B0 image for every seven diffusion weighted
images – within the range of suggested optimum ratios for assumptions of isotropic and anisotropic tensors (Jones et al., 1999; Alexander and Barker, 2005). A total of 68 slices oriented to the axial plane (no gap) were collected to ensure whole brain coverage (from vertex to second cervical spinal process). The image sequence was synchronized to the subject’s cardiac cycle via a pulse oximeter signal with no delay (cardiac gating),
avoiding data acquisition when the brain is susceptible to cardiac pulsatility which can severely corrupt diffusion weighted data (Jones and Leemans, 2011). We also acquired fieldmap images (TR = 800 ms; TE1 = 4.92 ms, TE2 = 7.38 ms; field of view = 256 mm; 4 x 4 x 2 mm3 voxels; 68 slices) immediately prior to the DWI data acquisition, in order to correct for geometric distortions secondary to magnetic field inhomogeneities
(Jezzard, 2012).
Diffusion tensor imaging, tensor model and related metrics
Diffusion is a physical process, where molecules present a constant random thermal motion at temperatures above absolute zero. This was described by Robert Brown in 1828 (Jones, 2009), thus this is also known as “Brownian motion”. Despite its trajectory being a “random walk” in 3D space, Einstein showed in 1905 that one
mean square displacement of all molecules, 〈∆r2〉, divided by the number of dimensions, n, and the diffusion time, t (Alexander et al., 2007; Jones, 2009):
• D = !∆!!!
!!∆!
At body temperature (37 Cº) a cube of water of an approximate volume of 2.5 mm3 present a diffusion coefficient of 3 x 10⁻³ mm2/s, thus following an observation time of 30 ms water molecules would have displaced approximately 25 µm in all directions on average (Jones, 2009). In the brain, however, water molecules are not free to diffuse as there are many barriers including cellular membranes, myelin sheaths and
cytoskeleton macromolecules. Therefore diffusion within brain tissues is approximately four times smaller compared to “free” diffusion, and it is thus called apparent diffusion coefficient (ADC) (Jones, 2009).
Diffusion has contrasting features in gray matter (GM) and WM. In the former diffusion occurs in all directions due to a convoluted tissue orientation (isotropic), while in the latter there is a high directionality component of tissue orientation from the
bundling of axonal fibers, i.e., anisotropy. Thus the diffusion magnitude within the brain WM as measured by the ADC will depend on the direction used for measurement, making a single ADC measurement insufficient to fully characterize water diffusion in WM. Where diffusion is isotropic (GM, cerebral spinal fluid (CSF)), the probability of the mean displacement of water molecules can be represented by a diffusion sphere; for anisotropic diffusion however, when diffusion has a preferential main direction such as within WM, this is better described by a diffusion ellipsoid (Figure 2.1 A).
factor (b-value), a brain image composed of several volume elements (voxels) can be acquired by imposing magnetic gradients on a particular direction. Non-diffusion weighted images where the b-value is zero are also acquired. By measuring the water displacement in multiple directions from the diffusion-weighted and non-diffusion weighted images the diffusion can be quantified in a voxelwise manner.
In order to adequately represent diffusion in an anisotropic medium such as WM, data from diffusion MRI can be modeled in a voxel-by-voxel basis using a diffusion tensor (Basser et al., 1994a; Basser et al., 1994b), i.e., diffusion tensor imaging (DTI). The diffusion tensor D is a 3 x 3 symmetric matrix, where the diagonal elements represent diffusivities along three orthogonal axes (Dxx, Dyy, and Dzz) and correlations
between those are represented by the symmetric off-diagonal elements (Dxy = Dyx, Dxz =
Dzx, and Dyz = Dzy):
D =
The diffusion ellipsoid can be described by applying a mathematical procedure to the diffusion tensor matrix, i.e., diagonalization, so that its internal frame of reference (x’, y’, z’) matches the principal axes of the measurement frame (x, y, z). In such case, all off-diagonal elements are zero and the orientation of the ellipsoid main axes is given by eigenvectors (ε1, ε2, ε3), with the orientation of the tensor depicted by the principal
eigenvector (ε1) – its direction is assumed to be parallel to the dominant fiber orientation
within the voxel being measured. The degree of diffusion along the eigenvectors is Dxx Dxy Dxz
Dyx Dyy Dyz
the displacement within the ellipsoid in each axis is scaled to the square root of the corresponding eigenvalue (according to Einstein’s formula) (Winston, 2012). The eigenvalues are, by definition, sorted according to their magnitude, i.e., λ1 > λ2 > λ3
(Figure 2.1 A).
From the eigenvalues determined from the tensor model it is possible to derive scalar measurements that allow simplification of the diffusion data (as opposed to have brain images where each voxel contains a 3 x 3 matrix). These quantitative parameters were originally proposed by Basser and Pierpaoli in 1996 (Basser and Pierpaoli, 1996), and they include:
• Trace, which measures the magnitude of diffusion:
o Sum of the three eigenvalues: λ1 + λ2 + λ3
• Mean diffusivity (MD), the mean diffusion across all three axes:
o Average of the three eigenvalues :(λ1 + λ2 + λ3) / 3
• Fractional anisotropy (FA) is an anisotropy index, that measures the fraction of the tensor that can be attributed to anisotropy parallel to the orientation of the main fiber tract (in the formula, L = λ):
o FA = !
!
(!!!!")!! (!!!!")!! (!!!!")! !!!! !!!! !!!
Both trace and MD have units of mm2/s, while FA is dimensionless and
normalized so that its values range from 0 (isotropic diffusion) to 1 (anisotropic diffusion, i.e., constrained along one axis).
(Gauvain et al., 2001) and cellular swelling (Benveniste et al., 1992) reduces MD. FA values for healthy WM have a peak close to 0.3 (Alexander et al., 2007), with values around 0.2 for cortical GM, 0.2-0.4 in deep GM and a wider range in WM (circa 0.45 in subcortical WM to about 0.8 in the corpus callosum) (Beaulieu, 2009). Given such variability for FA values across the brain it becomes clear that only similar brain regions can be compared using this measure, i.e., comparing the FA from area “X” to area “Y” is meaningless to infer underlying micro-structural differences such as axonal density or degree of myelination (Beaulieu, 2009). It has been reported that the parallel disposition of WM bundles is key for diffusion anisotropy (Alexander et al., 2007), due to the
presence of axonal membranes. Myelination has a secondary modulatory role for FA, as unmyelinated fibers also present anisotropic diffusion and animal models of
dysmyelination (failure to form normal myelin) showed an average FA reduction of only 15% (range 0-32%) (Beaulieu, 2009). Hence several factors can impact the FA value measured within a voxel including axonal count and density, myelination, fiber
organization, and crossing fibers (Winston, 2012).
It is important to note that FA does not describe the tensor shape or distribution in its entirety, as different eigenvalue combinations can result in similar FA values. Thus studies have used the eigenvalues separately or in combination to provide a more specific understanding of WM micro-structure (Alexander et al., 2007; Winston, 2012):
• Axial diffusivity (AD) is the diffusivity parallel (longitudinal) to the main axis of diffusion:
• Radial diffusivity (RD) is the diffusivity perpendicular (orthogonal) to the main axis of diffusion:
o Average of the two eigenvalues orthogonal to λ1: (λ2 + λ3) / 2
These two measures, as they are derived from the eigenvalues directly, also have units of mm2/s. AD is considered a marker for axonal damage (reduced AD ≈ axonal degeneration), while increases in RD reflects myelin degradation (Alexander et al., 2007; Winston, 2012).
Lastly, the mode (MO) of anisotropy can specify the geometric shape of the ellipsoid (Ennis and Kindlmann, 2006) (in the formula, L = λ):
• MO = !! ! !! ! !!
(!!!!")!! (!!!!")!! (!!!!")! !
Its values range from -1 to +1 (dimensionless), describing a tensor that is disc-shaped (planar anisotropy) to one that is a tubular (linear anisotropy) respectively (Smith and Kindlmann, 2009; Winston, 2012). MO values closer to -1, indicating a disc-shaped (oblate) tensor where λ1 ≈ λ2, is suggestive of crossing fibers while values
closer to +1 (prolate tensor) indicates primarily a single dominant fiber (λ2 ≈ λ3) (Fig. 2.1
B). MO is orthogonal (mathematically independent) to FA, and it can provide important additional information about diffusion within the brain. This importance can be
appreciated when assessing FA measurements, as brain areas with crossing WM tracts (lower MO values) will present lower FA values in the absence of any WM abnormality (Alexander et al., 2007).
DWI preprocessing steps
library (FSL v. 5.0.5) (Smith et al., 2004; Jenkinson et al., 2012)
(http://fsl.fmrib.ox.ac.uk/fsl/fslwiki). DWI and fieldmap images were reoriented to the Montreal Neurological Institute (MNI) brain template using the FSL tool “fslreorient2std”, and then loaded into the visualization tool “FSLview” to be visually checked for any obvious artifacts. Eddy current and motion artifact correction was done using the FMRIB Diffusion Toolbox (FDT), followed by application of the rotational component of the transformation for each volume to the gradient direction encoding vectors. The resulting eddy current and motion corrected DWI images were visually inspected. Individual brain masks were derived from the first B0 image using the Brain Extraction Tool (BET) (Smith,
2002). Fieldmap images were processed using the FSL tool “fsl_prepare_fieldmap”, and then used to correct geometric distortions in the DWI images as implemented by FSL’s FUGUE, and the resulting output was visually inspected for artifacts.
Finally, a diffusion tensor model was estimated from the undistorted DWI images using weighted linear least-squares regression as implemented by FDT (Behrens et al., 2003). An image of the sum of squared error was also produced by FDT and it was visually checked for artifacts, as well as the calculated FA, MD, AD and MO parametric maps. RD images were calculated as the average of the maps for the two radial vectors eigenvalues (λ2, λ3) using the FSL tool “fslmaths”.
Tract-based spatial statistics
male and female subjects aged between 20-50
(http://fsl.fmrib.ox.ac.uk/fsl/fslwiki/FMRIB58_FA)); 2) a mean FA image derived from all subjects was created, then thinned to represent the center of the major WM tracts common to all subjects, i.e., a mean WM skeleton image; 3) the mean FA skeleton was thresholded at 0.2 to include FA values with acceptable cross-subject variability, then each individual’s normalized FA map was projected into the skeleton resulting in a 4D image file containing the skeletonized FA data for all subjects.
Non-FA images of the additional DTI metrics (AD, MD, RD, MO) were also processed using TBSS. Each of the non-FA images was registered into standard space by applying the non-linear registration calculated for FA images, then projected onto the original mean FA skeleton. Therefore for each non-FA DTI metric a 4D skeletonized image was generated, where voxels in the same spatial location contain each of those metrics values respectively.
Statistical analyses
TBSS analysis (voxelwise)
A between-group permutation-based nonparametric t-test (Nichols and Holmes, 2002) using age as a covariate of no interest was done, using the 4D skeletonized mean FA image as input for the FSL tool “randomise” with 5,000 permutations and using the threshold-free cluster enhancement option. This option allows the detection of cluster-like formation(s) of significant voxels with no arbitrary thresholding while
The WM skeleton is thin (few voxels wide) thus hard to visualize when overlaid onto a brain image, therefore we used the FSL tool “tbss_fill” to thicken the skeleton areas with significant group differences for enhanced visualization. Location of significant differences between groups were identified using FSLview and the built-in anatomical atlases (http://fsl.fmrib.ox.ac.uk/fsl/fslwiki/Atlases), as well as a MRI-based atlas of human WM (Oishi and Crain, 2011).
Whole brain, WM skeleton and pain-related region of interest analyses
To perform between-group comparisons for the whole brain and WM skeleton, each DTI parametric map was averaged across the whole brain and across all voxels within the WM skeleton for each subject.
right and left SI, SII, and IPL were derived from the Jülich atlas. Since the cortical ROIs were constructed from probabilistic atlases moderately thresholded at p = 0.25, they encompassed voxels beyond the cortical mantle and included WM voxels within it, a method used previously for DTI measurements (Stein et al., 2012). These WM voxels preferentially include afferent/efferent fibers associated with the cortical region proximal to it (Salat et al., 2009a). We extracted the mean for each DTI metric across all voxels within each ROI, as well from the WM skeleton voxels within it (Figure 2.2).
Between-group differences were assessed using analyses of covariance with age as a covariate of no interest. All statistical tests were done using SPSS v. 18, with significance thresholding of p < 0.05.
We also assessed associations of DTI metrics measured in the whole brain and ROIs with subject’s clinical measures and psychosocial questionnaire scores using the Pearson’s correlation coefficient “r”. Correlations with p-value < 0.01 were considered significant.
Results
Subjects demographics characteristics, clinical measures and questionnaires A full description of the FM patients and controls is presented in chapter 1, results section.
TBSS analysis (voxelwise)
clusters summing 2,729 voxels were localized within the corpus callosum, including the genu, body and splenium. Two clusters were localized in the anterior limbs of the internal capsule (IC) and anterior corona radiata, one on the left (709 voxels) and another on the right (431 voxels) side. The left corticospinal tract, and WM adjacent to the left SI and M1 were part of another cluster with 568 voxels. Other clusters were localized in the inferior fronto-occiptal, inferior longitudinal and superior longitudinal fasciculi (1,984 voxels), while 140 voxels were localized deep within WM. No significant cluster was found for FM having increased FA compared to controls.
Group differences for other DTI metrics included significant increases of RD (10,356 voxels) and MD (10,805 voxels) for the patient group, while MO showed reductions for patients in a limited spatial distribution (1,526 voxels) – see description below. No group differences for AD were found in either direction.
respectively). WM tracts close to SI and M1 with reduced FA in patients are shown in Figure 2.6 left panel, with the tracts showing overlap of RD and MD differences depicted on the right top and bottom panels respectively.
Significantly reduced MO in patients as compared to controls was spatially limited compared to the other DTI metrics’ parametric maps, with differences mostly over the genu, body and splenium of corpus callosum (765 voxels), and parts of the corona radiata (761 voxels) (data not shown). No increases of MO for patients compared to controls were significant.
Whole brain, WM skeleton and pain-related region of interest analyses
Comparing DTI metrics across the whole brain showed no group differences for FA (p = 0.32), however AD and MD were significantly reduced for FM patients
compared to controls (p = 0.023 and p = 0.037 respectively) while RD approached significance (p = 0.051) (Figure 2.7). For measures within the WM skeleton no significant differences were found, although FA reduction in patients compared to controls was close to significance (p = 0.065).
ROI analyses revealed an interesting pattern (Table 2.2 and 2.3). When comparing DTI metrics across all voxels within each ROI (non-skeletonised), no
Assessing metrics for WM skeleton voxels within each ROI showed more varied differences (Table 2.3). For WM skeleton FA and RD, both left and right SI showed significant differences in patients compared to controls (reduced FA in left and right SI: p = 0.002 and p = 0.001 respectively; increased RD: p = 0.004 and p = 0.011) while for MD only left SI showed a significant increase (p = 0.016). Compared to controls, FM patients showed significant reductions in AD, RD and MD in the left insula (all at p < 0.001).
Association of DTI metrics with clinical and psychosocial measures
When assessed in the whole brain (non-skeletonised), DTI metrics showed significant correlations with age in FM patients (r for FA = -0.54, AD = 0.49, RD = 0.56; MD = 0.54) and controls (AD = 0.65; RD = 0.68; MD = 0.67), indicating that increased age is associated with reduced FA and increased AD, RD, and MD. Within the WM skeleton, negative correlations between age and FA (r = -0.47) and between BMI and AD, RD, and MD were found only for patients (-0.68 < r < -0.47) (Table 2.4), thus increased BMI in patients is correlated with decreases in AD, RD and MD. No
associations for DTI metrics and pain characteristics were found, and no psychosocial measures were significantly correlated with DTI metrics for either group at p < 0.01.
For FM patients, non-skeletonised ROIs showed significant negative associations with age and FA in several ROIs except left SII, ACC and left IPL (-0.62 < r < -0.38), while AD, RD, and MD were positively associated with age in most ROIs except SI bilaterally and ACC (0.48 < r < 0.68) (Table 2.5). Controls showed no significant
For correlations of DTI metrics within the WM skeleton, FM patients showed negative associations for age and FA (-0.63 < r < -0.54) and positive associations for other metrics (AD, RD, MD; 0.47 < r < 0.60) in the left and right thalamus (Table 2.6). Controls showed only negative correlation between age and left IPL FA (r = -0.47). In FM patients only, significant negative correlations of BMI were found in the right thalamus and AD (r = 0.50); right SI and left SII and AD, RD, and MD (0.73 < r < -0.48); and left IPL for AD (r = -0.52) and both IPL for RD and MD (-0.60 < -0.48) (Table 2.6).
Discussion
Global and regional WM abnormalities in the brain of FM patients, as compared to age- and sex-matched healthy controls, are suggested based on the results reported here. Supporting a role for the CNS in FM pathophysiology, global abnormalities were found by reductions of diffusion anisotropy and increased radial and mean diffusivity along WM tracts associated with multiple functional roles including sensory, motor, visual, auditory and inter-hemispheric connectivity. Regional differences of diffusion patterns were also revealed in pain-related brain locations, further supporting CNS micro-structural abnormalities as a putative mechanism in FM.
WM skeleton abnormalities in TBSS
WM tracts are the “information highways” in the CNS, and have been traditionally divided in three groups according to their connectivity (Jellison et al., 2004; Wycoco et al., 2013):