AUTOMATION OF THE MICRORAFT ARRAY PLATFORM FOR THE SELECTION OF CYTOTOXIC T LYMPHOCYTES
Peter Joseph Attayek
A dissertation submitted to the faculty at the University of North Carolina at Chapel Hill in partial fulfillment of the requirements for the degree of Doctor of Philosophy in the School of
Medicine (Biomedical Engineering).
Chapel Hill 2016
ABSTRACT
Peter Joseph Attayek: Automation of the Microraft Array Platform for the Selection of Cytotoxic T Lymphocytes
(Under the Direction of Nancy L. Allbritton)
Adoptive cellular therapy (ACT) is an emerging immunotherapy having significant promise in the treatment of a variety diseases, including cancer and chronic infections. ACT involves the infusion of cytotoxic T lymphocytes (CTLs) that recognize viral protein epitopes or, in the case of cancer, a mutated or overexpressed protein epitope present on the surface of diseased cells. While ACT has led to some outstanding clinical results, it is currently very difficult to identify and isolate highly active antigen-specific CTLs, hindering the study and adoption of ACT. The work described in this dissertation is focused on the automation and further development of the microraft array platform for the identification and isolation of CTLs based on cytotoxicity.
potential of the platform. Furthermore, the microraft array platform was only amenable to adherent cell types which would not enable the isolation of non-adherent CTLs.
ACKNOWLEDGEMENTS
There are many people I would like to thank for providing assistance, guidance and support during the duration of my graduate studies. I would especially like to thank my advisor, Nancy Allbritton, for offering me a position in her lab and guiding me throughout my graduate career. I would also especially like to think Chris Sims for assistance in the lab and with life. I would like to thank Paul Armistead; without his support and guidance, this work would not have been possible. I am grateful to my other committee members, Shawn Gomez, Anne Taylor and Glenn Walker. I have also been extremely lucky to work with Yuli Wang in the Allbritton lab who has offered tons of advice and could always help come up with a solution when I had all but given up hope.
I want to thank all past and present members of the Allbritton lab. Every member of the lab has been a pleasure to work with. I feel particularly grateful to have worked with Emilie Mainz and Asad Ahmad, who have become lifelong friends. I also want to specifically mention Pavak Shah, Matt DiSalvo, Angie Proctor, Michelle Kovarik, Nick Dobes, Jazz Dickinson, Phil Gach, Ryan Phillips, and Dulan Gunasekara for great discussions about research and life. I want to thank Sally Hunsucker and Jen Waugh in the Armistead lab for help with all of my research, especially with T cell culture and immunology questions.
TABLE OF CONTENTS
LIST OF FIGURES ... xiii
LIST OF TABLES ... xv
LIST OF ABBREVIATIONS AND SYMBOLS ... xvi
CHAPTER 1: INTRODUCTION ... 1
1.1 Adoptive Cellular Therapy ... 1
1.1.1 Introduction to ACT ... 1
1.1.2 T cell products for ACT ... 1
1.1.3 Current standards for identification, isolation and expansion of CTLs ... 2
1.1.4 Microtechnologies for the identification and isolation of CTLs ... 4
1.2 Microraft Arrays ... 5
1.2.1 Fabrication of microraft arrays ... 5
1.2.2 Release and collection of cells on microraft arrays ... 6
1.2.3 Microraft automated isolation considerations ... 7
1.3 Imaging and Image analysis ... 8
1.3.1 Imaging hardware considerations ... 8
1.3.2 Image processing and analysis ... 9
1.4 Overview of this dissertation ... 12
1.5 Figures ... 13
CHAPTER 2: ARRAY-BASED PLATFORM TO SELECT,
RELEASE, AND CAPTURE EPSTEIN–BARR VIRUS-INFECTED
CELLS BASED ON INTERCELLULAR ADHESION ... 26
2.1 Introduction ... 26
2.2 Materials and Methods ... 30
2.2.1 Materials ... 30
2.2.2 Fabrication of microraft arrays ... 31
2.2.3 Microscopy ... 32
2.2.4 Motorized microraft release system ... 32
2.2.5 Motorized microraft release system controller ... 32
2.2.6 Fabrication of a magnetic microraft collection device ... 33
2.2.7 Cell lines, cell culture ... 33
2.2.8 Cell staining ... 33
2.2.9 Gelatin encapsulation and fluorescent gelatin ... 34
2.2.10 Release and collection of microrafts ... 34
2.2.11 Growth rate determination ... 35
2.2.12 Single-cell cloning efficiency ... 35
2.2.13 Quantitative RT-PCR ... 35
2.2.14 Statistical Analysis ... 37
2.3 Results and Discussion ... 37
2.3.1 Overview of hydrogel-based encapsulation and collection of cells on an array ... 37
2.3.2 Impact of gelatin encapsulation on cells ... 38
2.3.3 Motorized microraft release system ... 39
2.3.5 Optimization of gelatin concentration for combined release,
capture and deposition of cells ... 42
2.3.6 Isolation of clumping EBV-LCL cells ... 43
2.3.7 PCR of EBV-LCL colonies and single cells ... 43
2.4 Conclusions ... 45
2.5 Figures ... 46
2.6 Tables ... 58
2.7 REFERENCES ... 59
CHAPTER 3: GENERATION OF A CRISPR-CAS9 EDITED CELL LINE BY AN AUTOMATED MICRORAFT ISOLATION SYSTEM ... 63
3.1 Introduction ... 63
3.2 Materials and Methods ... 67
3.2.1 Materials ... 67
3.2.2 Fabrication of microraft arrays ... 67
3.2.3 Microscopy ... 68
3.2.4 Cell culture and staining ... 68
3.2.5 CRISPR-Cas9 transfection ... 69
3.2.6 Image acquisition... 70
3.2.7 Image processing and analysis ... 70
3.2.8 Microraft release system ... 71
3.2.9 Microraft collection wand and mount ... 72
3.2.10 Gelatin encapsulation ... 72
3.2.11 Automated microraft isolation ... 72
3.2.13 Statistical analysis ... 74
3.3 Results and Discussion ... 74
3.3.1 Image acquisition and analysis ... 75
3.3.2 Microraft release system ... 76
3.3.3 Microraft collection system ... 77
3.3.4 Integrated platform performance ... 78
3.3.5 Selection of EGFP-expressing K562 cells ... 78
3.4 Conclusions ... 80
3.5 Figures ... 81
3.6 Tables ... 92
3.7 REFERENCES ... 95
CHAPTER 4: IDENTIFICATION AND ISOLATION OF ANTIGEN-SPECIFIC CYTOTOXIC T LYMPHOCYTES WITH AN AUTOMATED MICRORAFT SORTING SYSTEM ... 99
4.1 Introduction ... 99
4.2 Materials and Methods ... 101
4.2.1 Materials ... 101
4.2.2 Fabrication of microraft arrays ... 102
4.2.3 Microscopy setup... 103
4.2.4 Preparation of microraft arrays for the cytotoxicity assays ... 104
4.2.5 Generation of dendritic cells (DCs) from CD34+ progenitors ... 104
4.2.6 Generation of cytotoxic T lymphocytes (CTLs) ... 105
4.2.7 Tetramer analysis ... 106
4.2.9 Restimulation of CTLs and isolation of CD8+ cells prior to
plating on the microraft arrays ... 108
4.2.10 Single T cell cytotoxicity assay ... 108
4.2.11 Image acquisition ... 109
4.2.12 Image processing and analysis ... 109
4.2.13 Selection of cells for release ... 110
4.2.14 Microraft/cell release transfer to a 96-well plate ... 110
4.2.15 Preparation of feeder cells for T cell expansion ... 111
4.2.16 Limiting dilution ... 111
4.2.17 T cell expansion ... 111
4.2.18 Analysis of TCR α- and β-chain CDR3 sequencing... 112
4.2.19 Statistics ... 114
4.3 Results and Discussion ... 114
4.3.1 Microraft arrays for selection of non-adherent cells ... 114
4.3.2 Design of T cell mediated cytotoxicity assay ... 115
4.3.3 M1p specific T cell culture ... 115
4.3.4 Overall analysis of cytotoxicity on microraft arrays ... 116
4.3.5 Isolation and expansion of T cells based upon cytotoxicity ... 119
4.4 Conclusions ... 120
4.5 Figures ... 126
4.6 Tables ... 132
LIST OF FIGURES
Figure 1.1 Cytotoxic T lymphocyte ... 13
Figure 1.2 Microraft array fabrication ... 14
Figure 2.1 Gelatin encapsulation ... 46
Figure 2.2 Microraft array ... 48
Figure 2.3 Growth rate of K562 cells ... 49
Figure 2.4 Motorized microraft release ... 50
Figure 2.5 Magnetic transfer system ... 51
Figure 2.6 Efficiency of the magnetic collection device ... 52
Figure 2.7 Collected microrafts ... 53
Figure 2.8 EBV-LCL collection ... 54
Figure 2.9 Flow diagram of the process used to isolate EBV-LCL colonies and single cells for PCR analysis ... 55
Figure 2.10 Separation of blasting from non-blasting EBV-LCLs ... 56
Figure 3.1 Overview of the microraft array assay used to identify CRISPR-Cas9 transfected cells ... 81
Figure 3.2 Flow diagram of automated microraft array platform used to generate a gene-engineered U2AF1 K562 cell line ... 82
Figure 3.3 Microraft image processing and analysis overview ... 83
Figure 3.4 Graphical user interface (GUI) used to identify, release and collect microrafts ... 86
Figure 3.5 Microraft image processing and analysis overview ... 87
Figure 3.6 CRISPR-Cas9 genome editing and selection of edited cells ... 88
Figure 3.8 K562 transfection results ... 91
Figure 4.1 Microraft based selection of cells ... 126
Figure 4.2 Design of T cell mediated cytotoxicity assay ... 127
Figure 4.3 M1p specific T cell culture ... 128
Figure 4.4 Overall analysis of cytotoxicity on microraft arrays ... 129
LIST OF TABLES
Table 2.1 qRT-PCR of blasting vs. non-blasting EBV-LCLs ... 58
Table 3.1 Advantages of automated microraft analysis and isolation
compared to manual analysis and isolation ... 92
Table 3.2 Comparison of 2X, 4X and 6.3X magnification ... 93
Table 3.3 Mean microraft isolation time for each well of a 96-well
plate ... 94
LIST OF ABBREVIATIONS AND SYMBOLS
°C Degrees Celsius
ACT Adoptive cellular therapy
AIDS Acquired immunodeficiency syndrome AM Acetoxymethyl
AML Acute myelogenous leukemia ANOVA Analysis of variance
B Magnetic field gradient bp Base pair
CAD Computer-aided design
CAM Computer-aided manufacturing CAR Chimeric antigen receptor Cas9 CRISPR-associated protein 9 CD Cluster of differentiation
cDNA Complimentary deoxyribonucleic acid CDR Complimentary determining region
CM Complete medium
CMOS Complimentary metal-oxide semiconductor CNC Computerized numerical control
CO2 Carbon dioxide
CRISPR Clustered regularly-interspaced short palindromic repeats
CT Cycle threshold
DAPI 4’,6-diamidino-2-phenylindole dihydrochloride
DC Dendritic cell
DEP Dielecrophoresis DMSO Dimethyl sulfoxide DNA Deoxyribonucleic acid DPBS Dulbecco’s phosphate buffered saline DSB Double stranded break
dsDNA Double stranded DNA E. coli Escherichia coli
EBNA-2 Epstein-Barr virus nuclear antigen 2
EBV Epstein-Barr virus
EBV-LCL Epstein-Barr virus transfected lymphoblastoid cell line EDTA Ethylenediaminetetraacetic acid
EGFP Enhanced green fluorescence protein FACS Fluorescence activated cell sorting FBS Fetal bovine serum
fps Frames per second
FSC Front-scattered light
g Standard acceleration due to gravity at the Earth's surface GAPDH Glyceraldehyde-3-phosphate dehydrogenase
GBL Gamma-butyrolactone
GUI Graphical user interface h Hour
HDR Homology directed repair HLA Human leukocyte antigen IFN-α Interferon alpha IL Interleukin
K562 Myelogenous leukemia cell line LCM Laser-capture microdissection m Meter
M1p Influenza M1 peptide
MACS Magnetic activated cell sorting MDS Myelodysplastic syndrome mg Milligram
MHC Major histocompatibility complex min Minute
mL Milliliter mm Millimeter mM Millimolar ms Millisecond MSC Mesenchymal stem cells
NA Numerical aperture
NAD Non-adherent cell
ng Nanogram
NK Natural killer
nm Nanometer nM Nanomolar
PBMC Peripheral blood mononuclear cell PBS Phosphate buffered saline
PCR Polymerase chain reaction PDMS Polydimethylsiloxane PS-AA Poly(styrene-co-acrylic acid)
qRT-PCR Quantitative reverse transcriptase polymerase chain reaction
RNA Ribonucleic acid
RPMI Roswell Park Memorial Institute culture medium RT-PCR Reverse transcriptase polymerase chain reaction RVD Repeat variable diresidues
s Second SCF Stem cell factor
sgRNA Single guide ribonucleic acid SSC Side-scattered light
ssODN single-stranded oligodeoxynucleotide T Tesla
TALEN Transcription-activator like effector nucleases
TNF-α Tumor necrosis factor alpha Treg T regulatory cell
U Units
U2AF1 U2 small nuclear RNA auxiliary factor 1 UNC University of North Carolina
UV Ultraviolet
wt% Percent by weight
ZFN Zinc-finger nuclease
α Alpha
β Beta
γ Gamma
γFe2O3 Gamma-iron(III) oxide
μg Microgram
μL Microliter
μM Micromolar
CHAPTER 1: INTRODUCTION 1.1 Adoptive Cellular Therapy
1.1.1 Introduction to ACT
Adoptive cellular therapy (ACT) is an emerging immunotherapy having significant promise in the treatment of a variety diseases, including cancer and chronic infections.1-33 ACT
involves the infusion of cytotoxic T lymphocytes (CTLs) that recognize viral protein epitopes or, in the case of cancer, a mutated or overexpressed protein epitope present on the surface of diseased cells (Figure 1.1).32, 34-36 When these CTLs are infused into a patient, current evidence
suggests that the CTLs kill the diseased cells, and ideally continue to survive to provide long-term immunological surveillance.28 Clinical trials utilizing ACT have led to outstanding results
in some instances and a number of pharmaceutical companies are commercializing ACT.16, 36
Although ACT has shown great promise, there are number of obstacles facing its clinical adoption. One such obstacle is the ability to identify and potentially expand highly active antigen-specific CTLs.18, 19, 22-24, 26, 37-41
1.1.2 T cell products for ACT
CTL populations used for ACT can be comprised of native T cells or engineered T cells, such as those engineered to express a particular T cell receptor (TCR) or a chimeric antigen receptor (CAR).36, 42 For all varieties of T cell populations, there is a necessity to first
(1) High cytotoxicity toward antigen-presenting cells (2) High specificity for that antigen
(3) The ability to persist after infusion
The focus of this dissertation is to identify CTLs and their TCR based directly on cytotoxicity, which will help satisfy criterion (1) stated above. Criterion (2) can be satisfied in the future by screening the identified candidate pool of TCRs against normal or self-antigens to determine the TCR with the highest specificity. Much research is currently underway to look for the ideal subtype of CTL that will persist in vivo to satisfy criterion (3). All of this research combined will help clinicians engineer and expand a highly cytotoxic, highly specific CTL population that is able to persist in vivo.
A major drawback in the current standards for CTL identification is that the cells are not selected and cloned based directly on killing efficiency or cytotoxicity. Rather, a variety of surrogate markers of killing efficiency are used to isolate a mixed population of cells for treatment. These surrogate measures include cell proliferation in the presence of antigen-presenting cells, the ability of a cell to produce cytokines, and the expression of a high-avidity TCR against an antigen on a cell’s surface.3, 15, 23, 39, 44, 45 However, recent evidence
demonstrates that these surrogate measures are not predictive of a T cell’s cytotoxic potential. Indeed cytokine expression appears to be inversely correlated with tumor-cell killing, and TCR avidity binding is at best weakly correlated with killing ability.46-48
1.1.3 Current standards for identification, isolation and expansion of CTLs
Current methods to identify and isolate antigen-specific CTLs can be divided into the general categories of “cultivation” or “direct isolation.”49 Cultivation methods involve the
cells (PBMCs) with a cell lysate, peptide fragments, or antigen-presenting cells for many weeks.50-55 The cytotoxicity of the resulting enriched population can be measured by many
techniques including chromium-51 release or flow cytometric assays; however, it is not possible to examine single cell cytotoxicity in order to isolate individual CTLs for expansion or genetic analysis. For cancer and chronic infections, enrichment can last over 10-14 weeks. Even after this substantial enrichment, antigen-specific CTLs typically comprise less than 1% of the expanded cell population, and, not uncommonly, an effective CTL population is not generated at all.18, 19, 23, 26, 28, 39 Additionally, this long enrichment period requires much hands
on time and expensive reagents as the T cells are repeatedly stimulated over the weeks of expansion.
Direct isolation methods utilize either human leukocyte antigen (HLA)-peptide multimers56, 57 or cytokine-secretion capture58-60 to label CTLs based on antigen binding
avidity or cytokine release in response to stimulation, respectively. Subsequently, the labeled CTLs are isolated by fluorescence activated cell sorting (FACS) or magnetic activated cell sorting (MACS). These labeling and isolation techniques can be used to quickly identify and isolate single CTLs based on specificity or cytokine secretion; however, each has distinct disadvantages. Identification based on HLA-peptide multimers requires prior knowledge of the desired antigen and testing of a unique multimer for each antigen; this can be prohibitively expensive. The cytokine-secretion capture labeling method is also costly and does not reliably produce a high-purity CTL product.58-60 Most importantly, neither labeling technique directly
modalities, FACS can be inefficient in directing individual cells into culture wells, and cell viability is greatly diminished, whereas MACS is only an “enrichment” technique with a relatively low-purity post-sort product.61, 62 Additionally, the flow-based sorting techniques of
FACS and MACS cannot observe the spatiotemporal characteristics needed to identify single cells by cytotoxicity.
1.1.4 Microtechnologies for the identification and isolation of CTLs
Microtechnologies possess a number of well-described advantages for cytotoxicity-based CTL assays, including highly parallel performance, reduction in sample size and reagent volumes, efficient sample handling, and rapid assay performance.63-67 Several microdevices
have been developed to screen lymphocyte function, particularly for cytokine secretion or enumeration of CD4+ and CD8+ lymphocytes.68-84 Devices have been developed for screening
cytokines related to cytotoxicity, such as interferon-γ, and have been validated with both CTLs and natural killer (NK) cells.47, 85, 86 Unfortunately, secretion of interferon-γ and other
cytokines are poor predictors of lymphocyte cytotoxic capacity.46-48 Direct assay of cell killing
provides a much more stringent selection criterion to identify highly effective CTLs. Assays on microwell arrays have been described to characterize target cell killing by CTLs or NK cells, including kinetics and other parameters of cytotoxicity.46, 68-79, 87-91 These studies have
tracked cells over time to assess heterogeneity in killing characteristics of NK and CTLs co-cultured with their target cells.68, 87, 90-95 However, these devices were not designed for efficient
retrieval of CTLs which is essential for ACT.
endeavors have commenced to develop an automated aspiration system to isolate cells; however, cell damage during vacuum aspiration and the potential for cross-contamination from aspirating non-target cells are concerns affecting the post-sort viability and purity.96 An
alternative microwell array-based sorting method is the microraft array platform that utilizes the manipulation of individual superparamagnetic cell carriers by a small needle and a magnet to isolate individual cells or cell clusters.97-99 This sorting method does not require vacuum
aspiration or expensive equipment and exhibits very high post-sort purity and viability; however, to date it has been demonstrated only for the isolation of adherent cell types.
1.2 Microraft Arrays
1.2.1 Fabrication of microraft arrays
Microraft arrays were designed to be a low-cost platform for analyzing cells in a microwell format with the added functionality of easy and efficient retrieval of the content from each well.97, 98 Microraft arrays were fabricated by first producing a template via
photolithography (Figure 1.2 A-E). A glass slide coated with a layer of SU-8 photoresist was exposed to ultraviolet (UV) light through a patterned chrome mask. The chrome mask consisted of an array of squares with a variety of geometries (i.e. variable width of square, width of gap between squares and total number of elements). After UV exposure, the un-polymerized photoresist was reacted away to leave an array of square pillars of un-polymerized SU-8 on glass. Once a template was generated, soft lithography was employed to generate a polydimethylsiloxane (PDMS) microwell array (Figure 1.2 F-G). The PDMS microwell array was then submerged in a solution of poly(styrene-co-acrylic acid) (PS-AA) in γ-butyrolactone (GBL) containing γFe2O3 nanoparticles. The PDMS microwell array was then pulled out
all solution off the walls of the microwell array while leaving a droplet within each microwell. The GBL solvent was evaporated at 95°C so that a hard concave PS-AA element containing γFe2O3 nanoparticles was left within each microwell (Figure 1.2 H-J). These elements are
called “microrafts.” The microraft array was then glued to a polystyrene cassette with PDMS (Figure 1.2 K-L).
1.2.2 Release and collection of cells on microraft arrays
The advantage of the microraft platform over other microwell platforms is the innate ability to release and collect individual microrafts and therefore the cellular content within the microraft. Individual microrafts were released from an array by puncturing the soft PDMS microwell array with a small needle (10-17.5 μm tip) and pushing out the hard microraft. Once the needle is retracted, the elastomeric PDMS reseals, preventing medium leakage. The γFe2O3
nanoparticles contained within the microrafts render them superparamagnetic, facilitating collection of individual microrafts by an external magnetic force. Prior to this dissertation, the microraft platform required much user interaction and was not ideal for isolating multiple microrafts to individual collection vessels in a single experiment. The microraft release needle was attached directly to the objective of an inverted microscope, and the microscope user manually focused the objective upwards to eject a microraft. Additionally, each microraft was collected by a large magnet into the lid of a Petri dish placed on top of the microraft array.98 A
1.2.3 Microraft automated isolation considerations
Automation of the microraft release and collection can potentially increase throughput drastically, while reducing user error. The main consideration for all hardware required to automate the microraft isolation process was the ability to easily interface with a PC running MATLAB software. The microscopy equipment, including camera, motorized XY stage and Z-focus module, were used where applicable within the automation process. MATLAB can easily interface with this microscopy equipment using the open source software μManager.100, 101 An Arduino Uno was chosen as the hub for all other automation hardware, due to its low
cost and ability to interface easily with MATLAB. All parts for automation were designed with reliability and repeatability as a main focus and speed as a secondary focus.
The motors chosen for the microraft release and collection designs were either servomotors or stepper motors. A servomotor uses positional feedback to create a close-looped system in order to control its motion and final position. Servomotors generally have a limited range of motion, limited by having the output shaft directly coupled to the positional feedback mechanism, such as a potentiometer. Conversely, a stepper motor is an open-loop system without positional feedback but does not suffer from limited range of motion. Servomotors were chosen when only a limited range of motion was required and/or accurate positional feedback was required. Alternatively, stepper motors were utilized whenever larger range of motion was needed and/or positional feedback was not necessary or acquired in other ways.
complete. All parts were designed using SolidWorks computer-aided design (CAD) software and converted into g-code for the CNC mill using the HSMXpress computer-aided manufacturing (CAM) plugin for SolidWorks.
1.3 Imaging and Image analysis
1.3.1 Imaging hardware considerations
The ideal system for examining cytotoxicity should be able to image large fields of views with high fluorescence sensitivity for high throughput analysis, while maintaining enough resolution to identify individual cells. The Olympus MVX10 Macroview epi-fluorescence microscope was designed for low resolution imaging with high epi-fluorescence sensitivity. The microscope is equipped with 1X and 2X objectives having a high numerical apertures (NA) of 0.25 and 0.5, respectively. Additionally, the microscope is equipped with a magnification collar ranging from 0.63X to 6.3X, allowing for an effective magnification of 0.63X-12.6X. Equation 1.1 shows the light gathering power of an epi-fluorescence microscope, where F is the light gathering power, M is the magnification and NA is the numerical aperture.
1.1 10
The low magnification, high NA objectives of the MVX10 Macroview microscope give it excellent epi-fluorescence light gathering power. Additionally, resolution is inversely proportional to NA, giving the objectives excellent resolution compared to other low magnification objectives.
have a high quantum efficiency and low noise to take advantage of the excellent light gathering power of the MVX10 Macroview. The Hamamatsu ORCA-Flash4.0 boasts a 4 megapixel sensor with an effective area of 13.3 × 13.3 mm. The large pixel size (6.5 × 6.5 μm), peak quantum efficiency (82%) and median readout noise (1.0 electrons) give the ORCA-Flash4.0 excellent sensitivity for fluorescence microscopy. Additionally, the ORCA-Flash4.0 has a maximum framerate of 100 fps, making it ideal for time lapse microscopy. Coupled with bright fluorescent dyes, the MVX10 Macroview microscope and ORCA-Flash4.0 offer excellent speed and sensitivity for examining CTL cytotoxicity by epi-fluorescence microscopy.
1.3.2 Image processing and analysis
The development of novel methods for image processing and analysis is not a focus of this dissertation; however, a number of commonly used image processing and analysis methods are used and warrant discussion. Unless otherwise noted, the methods used in this dissertation are included in the MATLAB Image Processing Toolbox. In general, the image analysis included in this dissertation consisted of segmenting individual microrafts within an image prior to segmenting and analyzing cells within each microraft. Both segmentation pathways first consist of some type of background correction, followed by thresholding and finally a de-clumping algorithm.
Due to uniquely large field of view inherent to the MVX10 Macroview microscope coupled with the ORCA-Flash4.0 camera, many acquired images suffer from uneven illumination. A well-established method for correcting uneven illumination, flat-field correction, was used on all bright field images prior to any type of thresholding procedure.102
multiplied by the mean of the flat-field image to produce a corrected image as shown in equation 1.2 below, where C is the corrected image, R is the raw image, F is the flat-field image and m is the mean of the flat-field image.
1.2
To correct for uneven illumination in fluorescence images, a different method was employed, known as top-hat filtering.103, 104 Top-hat filtering consists of subtracting a morphologically
opened image from the raw image. A morphological opening is a method to remove all objects brighter than their surrounds that are smaller than a defined structuring element. A structuring element larger than the nominal size of a cell for the morphological opening is chosen so that when the top-hat filter is applied, most light in the image is removed other than any fluorescing cells.
Many automatic or unsupervised thresholding algorithms have been devised, each with their own advantages and disadvantages.105, 106 Otsu’s method, which attempts to cluster the
pixels in an image into two or three classes by minimizing the variance of the pixel distributions within each class, was primarily used throughout this dissertation.107 In a bright field image,
image without undersegmenting, or merging cells in close proximity. In these cases, an additional step is necessary to separate cells in close proximity.
The algorithm used throughout this dissertation to separate touching cells is the watershed algorithm, which identifies maxima in an image data that surround local minima. 108-110 The watershed transform can be implemented in a variety of ways. Within this dissertation,
the transform is applied to either the first or second order gradient of the raw fluorescence image or the distance transform of the thresholded image. The first order gradient watershed is utilized when there is a difference in image intensity at the boundary between adjacent cells, the second order gradient is used when the intensity of each cell decreases as it approaches the cell boundary and the distance transform is utilized when fluorescent objects are of uniform shape and are sufficiently sparse enough so that curvature of the cell boundaries is observable in the thresholded image.
1.4 Overview of this dissertation
The work presented in this dissertation focuses on the development of an automated microraft platform for the identification and isolation of antigen-specific CTLs. Chapter 2 describes the adaptation of the microraft array platform for the isolation of non-adherent cell types. Additionally, it describes the development of alternative microraft release and collection methods that greatly increased speed and reliability and were amenable to automation. The work in Chapter 2 has been published in the journal Lab on a Chip.122 Chapter 3 describes the
process of automating the microraft platform for the identification, release and collection of non-adherent cells. A combination of MATLAB and μManager100, 101 were used to write the
1.5 Figures
Figure 1.2 Microraft array fabrication. (A-B) A glass slide is coated with SU-8 photoresist. (C) The photoresist is selectively exposed to ultraviolet light through a chrome patterned mask. (D-E) The unexposed SU-8 is reacted away to leave SU-8 pillars on a glass substrate. (F-G) Soft lithography is used to create a polydimethylsiloxane microwell array. (H) The PDMS microwell array is dip coated in to a solution of poly(styrene-co-acrylic acid) in γ -butyrolactone containing γFe2O3 nanoparticles. (I-J) The GBL solvent is evaporated, leaving
1.7 REFERENCES
1. A. L. VAN DE VELDE, S. ANGUILLE AND Z. N. BERNEMAN, ACTA CLIN BELG, 2012, 67, 399-402.
2. J. B. BRAYER AND J. PINILLA-IBARZ, CANCER CONTROL, 2013, 49-59.
3. A. J. BARRETT AND K. LE BLANC, CLINICAL AND EXPERIMENTAL IMMUNOLOGY, 2010, 161, 223-232.
4. D. T. LE AND E. M. JAFFEE, J NATL COMPR CANC NETW, 2013, 11, 766-772.
5. J. COUZIN-FRANKEL, SCIENCE, 2013, 340, 1514-1518.
6. J. COUZIN-FRANKEL, SCIENCE, 2013, 342, 1432-1433.
7. M. BLEAKLEY, C. J. TURTLE AND S. R. RIDDELL, EXPERT REVIEW OF HEMATOLOGY, 2012, 5, 409-425.
8. S. A. ROSENBERG, NATURE REVIEWS CLINICAL ONCOLOGY, 2011, 8, 577-585.
9. S. A. ROSENBERG AND M. E. DUDLEY, CURRENT OPINION IN IMMUNOLOGY, 2009, 21, 233-240.
10. S. A. ROSENBERG, B. S. PACKARD, P. M. AEBERSOLD, D. SOLOMON, S. L. TOPALIAN, S. T. TOY, P. SIMON, M. T. LOTZE, J. C. YANG, C. A. SEIPP, C. SIMPSON, C. CARTER, S. BOCK, D. SCHWARTZENTRUBER, J. P. WEI AND D. E. WHITE, NEJM, 1988, 319, 1676-1680.
11. S. A. ROSENBERG, N. P. RESTIFO, J. C. YANG, R. A. MORGAN AND M. E. DUDLEY, NATURE REVIEWS CANCER, 2008, 8, 299-308.
13. M. E. DUDLEY, J. R. WUNDERLICH, P. F. ROBBINS, J. C. YANG, P. HWU, D. J. SCHWARTZENTRUBER, S. L. TOPALIAN, R. SHERRY, N. P. RESTIFO, A. M. HUBICKI, M. R. ROBINSON, M. RAFFELD, P. DURAY, C. A. SEIPP, L. ROGERS-FREEZER, K. E. MORTON, S. A. MAVROUKAKIS, D. E. WHITE AND S. A. ROSENBERG, SCIENCE, 2002, 298, 850-854.
14. K. M. FRIEDMAN, L. E. DEVILLIER, S. A. FELDMAN, S. A. ROSENBERG AND M. E. DUDLEY, JOURNAL OF IMMUNOTHERAPY, 2011, 34, 651-661.
15. L. GATTINONI, D. J. POWELL, S. A. ROSENBERG AND N. P. RESTIFO, NATURE REVIEWS IMMUNOLOGY, 2006, 6, 383-393.
16. C. H. JUNE, JOURNAL OF CLINICAL INVESTIGATION, 2007, 117, 1466-1476.
17. J. WEBER, M. ATKINS, P. HWU, L. RADVANYI, M. SZNOL, C. YEE AND N. C. I. IMMUNOTHERAPY TASK FORCE, CLINICAL CANCER RESEARCH, 2011, 17, 1664-1673.
18. M. KAPP, S. STEVANOVIC, K. FICK, S. M. TAN, J. LOEFFLER, A. OPITZ, T. TONN, G. STUHLER, H. EINSELE AND G. U. GRIGOLEIT, BONE MARROW TRANSPLANTATION, 2009, 43, 399-410.
19. E. MARIJT, A. WAFELMAN, M. VAN DER HOORN, C. VAN BERGEN, R. BONGAERTS, S. VAN LUXEMBURG-HEIJS, J. VAN DEN MUIJSENBERG, J. O. WOLBERS, N. VAN DER WERFF, R. WILLEMZE AND F. FALKENBURG, HAEMATOLOGICA-THE HEMATOLOGY JOURNAL, 2007, 92, 72-80.
20. D. L. PORTER, M. S. ROTH, S. J. LEE, C. MCGARIGLE, J. L. M. FERRARA AND J. H. ANTIN, BONE MARROW TRANSPLANTATION, 1996, 18, 975-980.
21. N. P. RESTIFO, M. E. DUDLEY AND S. A. ROSENBERG, NATURE REVIEWS IMMUNOLOGY, 2012, 12, 269-281.
22. E. SMITS, Z. N. BERNEMAN AND V. F. I. VAN TENDELOO, ONCOLOGIST, 2009, 14, 240-252.
24. T. OCHI, H. FUJIWARA AND A. YASUKAWA, JOURNAL OF BIOMEDICINE AND BIOTECHNOLOGY, 2010.
25. E. L. J. SMITS, C. LEE, N. HARDWICK, S. BROOKS, V. F. I. VAN TENDELOO, K. ORCHARD AND B. A. GUINN, CANCER IMMUNOLOGY IMMUNOTHERAPY, 2011, 60, 757-769.
26. G. WEBER, J. KARBACH, S. KUCI, H. KREYENBERG, A. WILLASCH, E. KOSCIELNIAK, T. TONN, T. KLINGEBIEL, W. S. WELS, E. JAGER AND P. BADER, LEUKEMIA, 2009, 23, 1634-1642.
27. R. J. BRENTJENS, M. L. DAVILA, I. RIVIERE, J. PARK, X. WANG, L. G. COWELL, S. BARTIDO, J. STEFANSKI, C. TAYLOR, M. OLSZEWSKA, O. BORQUEZ-OJEDA, J. QU, T. WASIELEWSKA, Q. HE, Y. BERNAL, I. V. RIJO, C. HEDVAT, R. KOBOS, K. CURRAN, P. STEINHERZ, J. JURCIC, T. ROSENBLAT, P. MASLAK, M. FRATTINI AND M. SADELAIN, SCI TRANSL MED, 2013, 5, 177RA138.
28. A. G. CHAPUIS, G. B. RAGNARSSON, H. N. NGUYEN, C. N. CHANEY, J. S. PUFNOCK, T. M. SCHMITT, N. DUERKOPP, I. M. ROBERTS, G. L. POGOSOV, W. Y. HO, S. OCHSENREITHER, M. WOLFL, M. BAR, J. P. RADICH, C. YEE AND P. D. GREENBERG, SCI TRANSL MED, 2013, 5, 174RA127.
29. S. A. GRUPP, M. KALOS, D. BARRETT, R. APLENC, D. L. PORTER, S. R. RHEINGOLD, D. T. TEACHEY, A. CHEW, B. HAUCK, J. F. WRIGHT, M. C. MILONE, B. L. LEVINE AND C. H. JUNE, THE NEW ENGLAND JOURNAL OF MEDICINE, 2013, 368, 1509-1518.
30. J. N. KOCHENDERFER, W. H. WILSON, J. E. JANIK, M. E. DUDLEY, M. STETLER-STEVENSON, S. A. FELDMAN, I. MARIC, M. RAFFELD, D. A. NATHAN, B. J. LANIER, R. A. MORGAN AND S. A. ROSENBERG, BLOOD, 2010, 116, 4099-4102.
31. A. J. KUMAR, E. O. HEXNER, N. V. FREY, S. M. LUGER, A. W. LOREN, R. RESHEF, J. BOYER, J. SMITH, E. A. STADTMAUER, B. L. LEVINE, C. H. JUNE, D. L. PORTER AND S. C. GOLDSTEIN, BIOL BLOOD MARROW TRANSPLANT, 2013, 19, 1094-1101.
33. S. L. MAUDE, N. FREY, P. A. SHAW, R. APLENC, D. M. BARRETT, N. J. BUNIN, A. CHEW, V. E. GONZALEZ, Z. ZHENG, S. F. LACEY, Y. D. MAHNKE, J. J. MELENHORST, S. R. RHEINGOLD, A. SHEN, D. T. TEACHEY, B. L. LEVINE, C. H. JUNE, D. L. PORTER AND S. A. GRUPP, THE NEW ENGLAND JOURNAL OF MEDICINE, 2014, 371, 1507-1517.
34. O. ITZHAKI, D. LEVY, D. ZIKICH, A. J. TREVES, G. MARKEL, J. SCHACHTER AND M. J. BESSER, IMMUNOTHERAPY, 2013, 5, 79-90.
35. S. GILL AND M. KALOS, TRANSL RES, 2013, 161, 365-379.
36. C. H. JUNE, S. R. RIDDELL AND T. N. SCHUMACHER, SCIENCE TRANSLATIONAL MEDICINE, 2015, 7, 280PS287-280PS287.
37. T. OCHI, H. FUJIWARA, S. OKAMOTO, J. AN, K. NAGAI, T. SHIRAKATA, J. MINENO, K. KUZUSHIMA, H. SHIKU AND M. YASUKAWA, BLOOD, 2011, 118, 1495-1503.
38. C. SMITH AND R. KHANNA, AMERICAN JOURNAL OF TRANSPLANTATION, 2013, 13, 9-23.
39. M. ZHANG, P. SUKHUMALCHANDRA, A. A. ENYENIHI, L. S. ST JOHN, S. A. HUNSUCKER, E. A. MITTENDORF, A. SERGEEVA, K. RUISAARD, Z. AL-ATRACHE, P. A. ROPP, H. JAKHER, T. RODRIGUEZ-CRUZ, G. LIZEE, K. CLISE-DWYER, S. J. LU, J. J. MOLLDREM, G. L. GLISH, P. M. ARMISTEAD AND G. ALATRASH, CLINICAL CANCER RESEARCH, 2013, 19, 247-257.
40. A. J. BARRETT, BRITISH JOURNAL OF HAEMATOLOGY, 2008, 142, 877-888.
41. M. ZHANG, P. SUKHUMALCHANDRA, A. A. ENYENIHI, L. S. ST JOHN, S. A. HUNSUCKER, E. A. MITTENDORF, A. SERGEEVA, K. RUISAARD, Z. AL-ATRACHE, P. A. ROPP, H. JAKHER, T. RODRIGUEZ-CRUZ, G. LIZEE, K. CLISE-DWYER, S. LU, J. J. MOLLDREM, G. L. GLISH, P. M. ARMISTEAD AND G. ALATRASH, CLIN CANCER RES, 2013, 19, 247-257.
43. S. ANGUILLE, V. F. VAN TENDELOO AND Z. N. BERNEMAN, LEUKEMIA, 2012, 26, 2186-2196.
44. B. J. UTTENTHAL, I. CHUA, E. C. MORRIS AND H. J. STAUSS, J GENE MED, 2012, 14, 386-399.
45. L. BAITSCH, S. A. FUERTES-MARRACO, A. LEGAT, C. MEYER AND D. E. SPEISER, TRENDS IMMUNOL, 2012, 33, 364-372.
46. N. VARADARAJAN, B. JULG, Y. J. YAMANAKA, H. CHEN, A. O. OGUNNIYI, E. MCANDREW, L. C. PORTER, A. PIECHOCKA-TROCHA, B. J. HILL, D. C. DOUEK, F. PEREYRA, B. D. WALKER AND J. C. LOVE, J CLIN INVEST, 2011, 121, 4322-4331.
47. Y. J. YAMANAKA, C. T. BERGER, M. SIPS, P. C. CHENEY, G. ALTER AND J. C. LOVE, INTEGR BIOL (CAMB), 2012, 4, 1175-1184.
48. S. ZHONG, K. MALECEK, L. A. JOHNSON, Z. YU, E. VEGA-SAENZ DE MIERA, F. DARVISHIAN, K. MCGARY, K. HUANG, J. BOYER, E. CORSE, Y. SHAO, S. A. ROSENBERG, N. P. RESTIFO, I. OSMAN AND M. KROGSGAARD, PROC NATL ACAD SCI U S A, 2013, 110, 6973-6978.
49. A. MOOSMANN, W. HAMMERSCHMIDT AND H. J. KOLB, EUROPEAN JOURNAL OF CELL BIOLOGY, 2012, 91, 97-101.
50. J. J. MELENHORST, S. R. SOLOMON, A. SHENOY, N. F. HENSEL, J. P. MCCOY, K. KEYVANFAR AND A. J. BARRETT, JOURNAL OF IMMUNOTHERAPY, 2006, 29, 436-443.
51. L. BAO, Q. SUN AND K. G. LUCAS, JOURNAL OF IMMUNOTHERAPY, 2007, 30, 557-561.
52. H. EINSELE, E. ROOSNEK, N. RUFER, C. SINZGER, S. RIEGLER, J. LOFFLER, U. GRIGOLEIT, A. MORIS, H. G. RAMMENSEE, L. KANZ, A. KLEIHAUER, F. FRANK, G. JAHN AND H. HEBART, BLOOD, 2002, 99, 3916-3922.
54. A. KLEIHAUER, U. GRIGOLEIT, H. HEBART, A. MORIS, P. BROSSART, A. MUHM, S. STEVANOVIC, H. G. RAMMENSEE, C. SINZGER, S. RIEGLER, G. JAHN, L. KANZ AND H. EINSELE, BRITISH JOURNAL OF HAEMATOLOGY, 2001, 113, 231-239.
55. K. PEGGS, S. VERFUERTH AND S. MACKINNON, BLOOD, 2001, 97, 994-1000.
56. M. COBBOLD, N. KHAN, B. POURGHEYSARI, S. TAURO, D. MCDONALD, H. OSMAN, M. ASSENMACHER, L. BILLINGHAM, C. STEWARD, C. CRAWLEY, E. OLAVARRIA, J. GOLDMAN, R. CHAKRAVERTY, P. MAHENDRA, C. CRADDOCK AND P. A. H. MOSS, JOURNAL OF EXPERIMENTAL MEDICINE, 2005, 202, 379-386.
57. A. SCHMITT, T. TONN, D. H. BUSCH, G. U. GRIGOLEIT, H. EINSELE, M. ODENDAHL, L. GERMEROTH, M. RINGHOFFER, S. RINGHOFFER, M. WIESNETH, J. GREINER, D. MICHEL, T. MERTENS, M. ROJEWSKI, M. MARX, S. VON HARSDORF, H. DOHNER, E. SEIFRIED, D. BUNJES AND M. SCHMITT, TRANSFUSION, 2011, 51, 591-599.
58. K. S. PEGGS, K. THOMSON, E. SAMUEL, G. DYER, J. ARMOOGUM, R. CHAKRAVERTY, K. PANG, S. MACKINNON AND M. W. LOWDELL, CLINICAL INFECTIOUS DISEASES, 2011, 52, 49-57.
59. P. MEIJ, I. JEDEMA, M. L. ZANDVLIET, P. L. J. VAN DER HEIDEN, M. VAN DE MEENT, H. M. E. VAN EGMOND, E. VAN LIEMPT, C. HOOGSTRATEN, S. KRUITHOF, S. VELD, E. W. A. MARIJT, P. A. VON DEM BORNE, A. C. LANKESTER, C. J. M. HALKES AND J. H. F. FALKENBURG, JOURNAL OF IMMUNOTHERAPY, 2012, 35, 621-628.
60. T. FEUCHTINGER, K. OPHERK, W. A. BETHGE, M. S. TOPP, F. R. SCHUSTER, E. M. WEISSINGER, M. MOHTY, R. OR, M. MASCHAN, M. SCHUMM, K. HAMPRECHT, R. HANDGRETINGER, P. LANG AND H. EINSELE, BLOOD, 2010, 116, 4360-4367.
61. P. GUILLAUME, D. F. LEGLER, N. BOUCHERON, M. A. DOUCEY, J. C. CEROTTINI AND I. F. LUESCHER, J BIOL CHEM, 2003, 278, 4500-4509.
63. F. LAUTENSCHLÄGER AND M. PIEL, CURR OPIN CELL BIOL, 2013, 25, 116-124.
64. G. H. UNDERHILL, P. GALIE, C. S. CHEN AND S. N. BHATIA, ANNU REV CELL DEV BIOL, 2012, 28, 385-341.
65. J. AUTEBERT, B. COUDERT, F. C. BIDARD, J. Y. PIERGA, S. DESCROIX, L. MALAQUIN AND J. L. VIOVY, METHODS, 2012, 57, 297-307.
66. X. J. LI, A. V. VALADEZ, P. ZUO AND Z. NIE, BIOANALYSIS, 2012, 4, 1509-1525.
67. M. L. KOVARIK, P. C. GACH, D. M. ORNOFF, Y. WANG, J. BALOWSKI, L. FARRAG AND N. L. ALLBRITTON, ANAL CHEM, 2012, 84, 516-540.
68. E. FORSLUND, K. GULDEVALL, P. E. OLOFSSON, T. FRISK, A. E. CHRISTAKOU, M. WIKLUND AND B. ONFELT, FRONT IMMUNOL, 2012, 3, 300.
69. J.-H. CHOI, INTERDISCIPLINARY BIO CENTRAL, 2010, 2, 1.1-1.8.
70. E. S. DOUGLAS, S. C. HSIAO, H. ONOE, C. R. BERTOZZI, M. B. FRANCIS AND R. A. MATHIES, LAB CHIP, 2009, 9, 2010-2015.
71. A. M. HIRSCH, C. A. RIVET, B. ZHANG, M. L. KEMP AND H. LU, LAB CHIP, 2009, 9, 536-544.
72. B. MA, G. ZHANG, J. QIN AND B. LIN, LAB CHIP, 2009, 9, 232-238.
73. R. D. REIF, M. M. MARTINEZ, K. WANG AND D. PAPPAS, ANAL BIOANAL CHEM, 2009, 395, 787-795.
74. Y. CHOI, C. YUEN, S. N. MAITI, S. OLIVARES, H. GIBBONS, H. HULS, R. RAPHAEL, T. C. KILLIAN, D. J. STARK, D. A. LEE, H. TORIKAI, D. MONTICELLO, S. S. KELLY, P. KEBRIAEI, R. E. CHAMPLIN, S. L. BISWAL AND L. J. COOPER, BIOMED MICRODEVICES, 2010, 12, 855-863.
76. Y. QIAO AND L. MA, ANAL CHEM, 2013, 85, 6953-6957.
77. R. D. REIF, C. AGUAS, M. M. MARTINEZ AND D. PAPPAS, ANAL BIOANAL CHEM, 2010, 397, 3387-3396.
78. T. XU, W. YUE, C. W. LI, X. YAO AND M. YANG, LAB CHIP, 2013, 13, 1060-1069.
79. S. CHANDRASEKARAN, M. J. MCGUIRE AND M. R. KING, LAB CHIP, 2014, 14, 118-127.
80. X. CHENG, D. IRIMIA, M. DIXON, K. SEKINE, U. DEMIRCI, L. ZAMIR, R. G. TOMPKINS, W. RODRIGUEZ AND M. TONER, LAB CHIP, 2007, 7, 170-178.
81. J. T. GOHRING AND X. FAN, PROC SPIE 2009, 7322, 12.818255.
82. D. GAO, H.-F. LI, G.-S. GUO AND J. M. LIN, TALANTA, 2010, 82, 528-533.
83. M. FRANKOWSKI, J. THEISEN, A. KUMMROW, P. SIMON, H. RAGUSCH, N. BOCK, M. SCHMIDT AND J. NEUKAMMER, SENSORS (BASEL), 2013, 13, 4674-4693.
84. M. POLONSKY, I. ZARETSKY AND N. FRIEDMAN, BRIEFINGS FUNCTIONAL GENOMICS, 2013, 12, 99-108.
85. Y. LIU, J. YAN, M. C. HOWLAND, T. KWA AND A. REVZIN, ANAL CHEM, 2011, 83, 8286-8292.
86. H. ZHU, G. STYBAYEVA, M. MACAL, E. RAMANCULOV, M. D. GEORGE, S. DANDEKAR AND A. REVZIN, LAB CHIP, 2008, 8, 2197-2205.
87. K. GULDEVALL, B. VANHERBERGHEN, T. FRISK, J. HURTIG, A. E. CHRISTAKOU, O. MANNEBERG, S. LINDSTROM, H. ANDERSSON-SVAHN, M. WIKLUND AND B. ONFELT, PLOS ONE, 2010, 5, E15453.
89. Q. HAN, N. BAGHERI, E. M. BRADSHAW, D. A. HAFLER, D. A. LAUFFENBURGER AND J. C. LOVE, PROC NATL ACAD SCI U S A, 2012, 109, 1607-1612.
90. A. MEROUANE, N. REY-VILLAMIZAR, Y. LU, I. LIADI, G. ROMAIN, J. LU, H. SINGH, L. J. COOPER, N. VARADARAJAN AND B. ROYSAM, BIOINFORMATICS, 2015, BTV355.
91. I. LIADI, H. SINGH, G. ROMAIN, N. REY-VILLAMIZAR, A. MEROUANE, J. R. ADOLACION, P. KEBRIAEI, H. HULS, P. QIU AND B. ROYSAM, CANCER IMMUNOLOGY RESEARCH, 2015, 3, 473-482.
92. F. L. LAI, Y. H. WANG, Y. W. CHUNG, S. M. HWANG AND L. S. HUANG, SENSORS (BASEL), 2011, 11, 9613-9627.
93. A. E. CHRISTAKOU, M. OHLIN, B. VANHERBERGHEN, M. A. KHORSHIDI, N. KADRI, T. FRISK, M. WIKLUND AND B. ONFELT, INTEGR BIOL (CAMB), 2013, 5, 712-719.
94. M. A. KHORSHIDI, B. VANHERBERGHEN, J. M. KOWALEWSKI, K. R. GARROD, S. LINDSTROM, H. ANDERSSON-SVAHN, H. BRISMAR, M. D. CAHALAN AND B. ONFELT, INTEGR BIOL (CAMB), 2011, 3, 770-778.
95. B. VANHERBERGHEN, P. E. OLOFSSON, E. FORSLUND, M. STERNBERG-SIMON, M. A. KHORSHIDI, S. PACOURET, K. GULDEVALL, M. ENQVIST, K. J. MALMBERG, R. MEHR AND B. ONFELT, BLOOD, 2013, 121, 1326-1334.
96. N. VARADARAJAN, D. S. KWON, K. M. LAW, A. O. OGUNNIYI, M. N. ANAHTAR, J. M. RICHTER, B. D. WALKER AND J. C. LOVE, PROCEEDINGS OF THE NATIONAL ACADEMY OF SCIENCES OF THE UNITED STATES OF AMERICA, 2012, 109, 3885-3890.
97. Y. L. WANG, C. PHILLIPS, W. XU, J. H. PAI, R. DHOPESHWARKAR, C. E. SIMS AND N. ALLBRITTON, LAB ON A CHIP, 2010, 10, 2917-2924.
99. A. D. GRACZ, I. A. WILLIAMSON, K. C. ROCHE, M. J. JOHNSTON, F. WANG, Y. WANG, P. J. ATTAYEK, J. BALOWSKI, X. F. LIU AND R. J. LAURENZA, NATURE CELL BIOLOGY, 2015, 17, 340-349.
100. A. EDELSTEIN, N. AMODAJ, K. HOOVER, R. VALE AND N. STUURMAN, CURRENT PROTOCOLS IN MOLECULAR BIOLOGY, 2010, 14.20. 11-14.20. 17.
101. A. D. EDELSTEIN, M. A. TSUCHIDA, N. AMODAJ, H. PINKARD, R. D. VALE AND N. STUURMAN, JOURNAL OF BIOLOGICAL METHODS, 2014, 1.
102. F. W. LEONG, M. BRADY AND J. O. D. MCGEE, JOURNAL OF CLINICAL PATHOLOGY, 2003, 56, 619-621.
103. J. SERRA, IMAGE ANALYSIS AND MATHEMATICAL MORPHOLOGY, V. 1, ACADEMIC PRESS, 1982.
104. P. SOILLE, MORPHOLOGICAL IMAGE ANALYSIS: PRINCIPLES AND APPLICATIONS, SPRINGER SCIENCE & BUSINESS MEDIA, 2013.
105. M. SEZGIN AND B. SANKUR, JOURNAL OF ELECTRONIC IMAGING, 2004, 13, 146-168.
106. H. ZHANG, J. E. FRITTS AND S. A. GOLDMAN, COMPUTER VISION AND IMAGE UNDERSTANDING, 2008, 110, 260-280.
107. N. OTSU, AUTOMATICA, 1975, 11, 23-27.
108. F. MEYER, SIGNAL PROCESSING, 1994, 38, 113-125.
109. N. MALPICA, C. DE SOLÓRZANO, J. VAQUERO, A. SANTOS, I. VALLCORBA, J. GARCÍA-SAGREDO AND F. DEL POZO, CYTOMETRY, 1997, 28, 289-297.
110. H. NG, S. ONG, K. FOONG, P. GOH AND W. NOWINSKI, 2006.
112. E. BENGTSSON, C. WAHLBY AND J. LINDBLAD, PATTERN RECOGNITION AND IMAGE ANALYSIS., 2004, 14, 157-167.
113. N. BOUKALA, E. FAVIER, B. LAGET AND P. RADEVA, 2004.
114. A. GARRIDO AND N. P. DE LA BLANCA, PATTERN RECOGNITION, 2000, 33, 821-832.
115. N. HAMILTON, TRAFFIC, 2009, 10, 951-961.
116. K. Z. MAO, P. ZHAO AND P.-H. TAN, BIOMEDICAL ENGINEERING, IEEE TRANSACTIONS ON, 2006, 53, 1153-1163.
117. E. MEIJERING, SIGNAL PROCESSING MAGAZINE, IEEE, 2012, 29, 140-145.
118. J. RITTSCHER, ANNUAL REVIEW OF BIOMEDICAL ENGINEERING, VOL 12, 2010, 12, 315-344.
119. P. RUUSUVUORI, T. AIJO, S. CHOWDHURY, C. GARMENDIA-TORRES, J. SELINUMMI, M. BIRBAUMER, A. M. DUDLEY, L. PELKMANS AND O. YLI-HARJA, BMC BIOINFORMATICS, 2010, 11.
120. K. WU, D. GAUTHIER AND M. D. LEVINE, BIOMEDICAL ENGINEERING, IEEE TRANSACTIONS ON, 1995, 42, 1-12.
121. Y. J. ZHANG, PATTERN RECOGNITION, 1996, 29, 1335-1346.
CHAPTER 2: ARRAY-BASED PLATFORM TO SELECT, RELEASE, AND CAPTURE EPSTEIN–BARR VIRUS-INFECTED CELLS BASED ON
INTERCELLULAR ADHESION
2.1 Introduction
By virtue of the ubiquitous requirement to isolate living cells for cloning, genetic analysis, and other assays, there is a need for improved techniques to collect cells displaying properties not amenable to selection criteria using common cell sorting techniques, for example, growth characteristics or cell-cell interactions. Retrieval of cells infected by the Epstein-Barr virus (EBV) is one such example. EBV causes infectious mononucleosis and is associated with a variety of tumors including nasopharyngeal carcinoma, Burkitt’s lymphoma, T cell lymphomas and Hodgkin’s lymphoma.1-5 The virus is highly prevalent among the human
population, with 90% of adults having been infected at some point in their life. After initial infection and the establishment of an immune response, the virus enters a latent state and persists within the host’s cells without causing obvious host damage. There are at least 4 different modes of EBV latency, each associated with expression of a different pattern of viral genes and linked to various lymphomas and lymphoproliferative disorders.3-5 Latent EBV can
EBV infects both epithelial cells and B lymphocytes. B lymphocytes infected with EBV in vitro become immortalized and are often used as a model system to study EBV infection and virus-driven tumorigenesis.1 These EBV-immortalized lymphoblastoid cell lines
(EBV-LCL) recapitulate some of the behaviors of EBV-infected immune cells, including demonstration of features suggestive of early stage progression to "lymphoma-like" cell clusters.5 These clusters or groupings of cells with weak intercellular adhesion, more
commonly known as clumps in the biology literature, are thought to arise from a single EBV-LCL, display rapid proliferation and maintain cell-cell contact as opposed to other types of EBV-infected cells which lack cell-cell adhesion and clumping behavior.5-8 Clumping
behavior characterizes these blast-like cells which display increased surface expression of CD23, CD39, CD40 and class II MHC, but a decrease in CD10 expression. The clumped cells also exhibit increased villous projections and vimentin expression.5 These characteristics
suggest that EBV latency programs can modulate cell cycle as well as cellular adhesion. It is also thought that EBV-LCLs spontaneously undergo latency program switching, altering the proliferation, surface marker expression and intercellular adhesion of the cells in culture. However, the relationship between EBV gene expression, morphology and the clumping phenotype is not fully understood. Technologies to separate EBV-infected cells based on their clustering behavior would enable a pure sample of cells for analytical study to provide a better molecular understanding of the signaling pathways contributing to these events.
sorted based on the presence or absence of an antigens on or within the cell.9-15 FACS and
MACS are high-throughput sorting techniques; however, both require prior knowledge of the antigens present to create fluorescently labelled antibodies against the desired cell subpopulation. Furthermore, FACS suffers from low post-sort viability while MACS suffers from low purity.16, 17 Microfabricated traps relying on flow for isolation, including
mechanical18-20, optical21, 22, dielectrophoretic (DEP)23, 24 and acoustic traps25 are able to
separate individual cells based on size, deformability or membrane capacitance. These methods forgo the reliance on prior knowledge of antigens and separate cells based on morphological characteristics; however, they are unable to segregate cell clusters from singlets. With all of the technologies discussed above, the pre-processing of the sample, as well as the flow forces inherent to each, will split apart weakly adherent cell clusters before they can be isolated. Furthermore, optical, acoustic and DEP-based manipulation24 require complicated and
expensive equipment and the mechanical or electrical forces placed on the cell during manipulation can have a negative effect on post-sort viability.24, 26
In recent years, technologies have been specifically designed to pick cell colonies grown in agar or the surface of plastic dishes by suction aspiration, e.g. Clonepix (Genetix, Hampshire, UK) and CellCelector (ALS Automated Lab Solutions, Jena, Germany). These colony picking platforms generally rely on microscopy techniques to identify individual colonies exhibiting a particular fluorescence signature, morphology or temporal characteristic before the identified cells are isolated, but are most often used for bacterial and yeast colonies.27-33 Another approach is laser-capture microdissection (LCM) which uses a laser to
cell colonies because of issues with cell viability.34, 35 Arrays of microfabricated wells to trap
non-adherent cells followed by an analysis and pipet aspiration have been implemented by a number of groups to identify and isolate cells of interest.27-31 Automation of the aspiration step
has been implemented to reduce the manpower needed for the isolation step, but cell damage during vacuum aspiration and the potential for cross-contamination from aspirating non-target cells are concerns. An alternative microwell array-based sorting method is the microraft array platform that utilizes the manipulation of individual superparamagnetic cell carriers by a small needle and a magnet to isolate individual cells or cell clusters.36-38 This sorting method does
not require vacuum aspiration or expensive equipment and exhibits very high post-sort purity and viability; however, to date it has been demonstrated only for the isolation of adherent cell types.
In the current work, a technique utilizing the microraft array platform is developed to address the need to pick single non-adherent cells or clonal clusters of non- or weakly adherent cells. The microraft array was originally developed by the Allbritton group as a cost effective means to sort cells or colonies that readily adhere to the surface of a carrier during culture on the array.36, 37 The microraft technology also provides an approach to track cells over time,
(microraft) at the base of the microwell to allow collection upon release of the microraft. A temperature-sensitive hydrogel formulation was optimized, and collection efficiency and cell viability were characterized. To efficiently release microrafts, a motorized, computer-controlled microneedle assembly mounted on a microscope objective was developed. A small cylindrical device containing a movable magnet was designed to efficiently capture and deposit rafts into a collection vessel. This system was then used to identify and collect single and clumping EBV-LCLs. The utility of the method was demonstrated by assaying the expression of a latency-associated gene, EBV nuclear antigen 2 (EBNA2), in cells that displayed clumping (blasting) and non-clumping (non-blasting) behavior.
2.2 Materials and Methods
2.2.1 Materials
(Grade N52) permanent magnets were obtained from K&J Magnetics, Inc. (Plumsteadville, PA). Ethanol was purchased from Decon Labs (King of Prussia, PA). T4 Gene 32 Protein was obtained from New England Biolabs, Inc. (Ipswich, MA). PCR primers were acquired from Integrated DNA Technologies, Inc. (Coralville, IA). Buffer RLT, RNeasy Micro Kit and Carrier RNA were received from Qiagen (Hilden, Germany). All other reagents were from Thermo Fisher Scientific (Waltham, MA).
2.2.2 Fabrication of microraft arrays
PDMS microwells containing superparamagnetic, releasable polystyrene elements were fabricated using previously described protocols.36, 37 Briefly, a template comprised of an
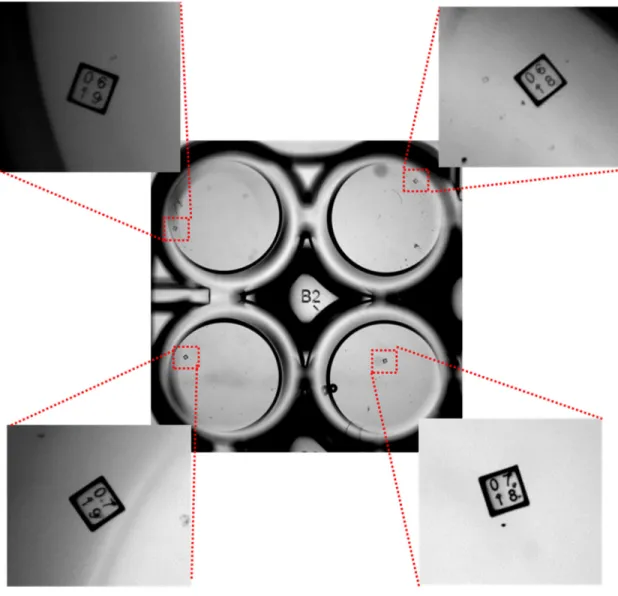
array of SU-8 pillars (200×200×200 µm, spaced 100 µm apart) on a glass slide was generated by standard photolithography and used to create a PDMS microwell array. A unique 4-digit identifier was transcribed in every 5th pillar that when transferred to the PDMS microwell
enabled addressing of individual microrafts based on their position relative to the identifier. Each array contained a total of 4900 microwells (70×70 array). The PDMS microwell array was covered with a solution of poly(styrene-co-acrylic acid) (PS-AA) in GBL co-mixed with γFe2O3 nanoparticles and degassed under vacuum to remove air bubbles.37 The array was then
2.2.3 Microscopy
An Eclipse TE2000-U microscope (Nikon Instruments Inc., Melville, NY) equipped with Nikon CFI Plan Fluor Series objectives was used for all experiments. A CoolSNAP HQ2 CCD camera (Photometrics, Tucson, AZ) was used for all imaging.
2.2.4 Motorized microraft release system
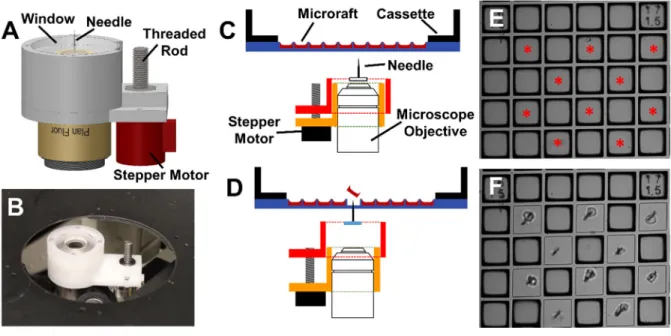
The release system consisted of two pieces of Delrin machined on a CNC mill (MicroMill DSLS 3000; MicroProto Systems, Chandler, AZ). One piece was designed to fit on to a CFI Plan Fluor 4× objective (Nikon Instruments Inc., Melville, NY) and housed a small stepper motor (20M020D1B; Portescap, West Chester, PA). The second Delrin component contained a clear polycarbonate disc with a 5 mm-long needle (150 µm base, 17.5 µm tip) secured to the center. The stepper motor rotated a threaded rod to translate the Delrin piece containing the needle linearly along the vertical axis of the objective. The clear polycarbonate disc permitted bright field and fluorescence microscopy with minimal distortion when the release system was in place. The tip of the needle was located 8.7 mm above the top surface of the objective.
2.2.5 Motorized microraft release system controller
2.2.6 Fabrication of a magnetic microraft collection device
A hollow polycarbonate cylinder (4.76 mm diameter, 63.5 mm length) with a 3.18 mm blind-end hole was machined through the center of its long axis leaving 1 mm of material at the blind end. The open end was tapped and closed with a nylon screw after a cylindrical NdFeB magnet (3.175 mm diameter, 25.4 mm length) was inserted into the cylinder. The magnet was able to move freely along the long axis of the cylinder as described below. The collection device was either held by hand or secured to a micromanipulator attached to the microscope stage for microraft retrieval.
2.2.7 Cell lines, cell culture
K562 cells, a myelogenous leukemia cell line, and EBV-infected lymphoblastoid cells were cultured in RPMI 1640 supplemented with 10% FBS, 100 U/mL penicillin and 100 µg/mL streptomycin. Prior to cell culture on the microraft array, the array was oxidized in a plasma cleaner (Harrick Plasma, Ithaca, NY) for 5 min. The array was then rinsed once with 100% ethanol and subsequently rinsed ×5 with PBS. The array was coated in a 0.1 wt% bovine gelatin in PBS and incubated at 37°C for 1 h. Before plating cells, the gelatin solution was aspirated and the array was rinsed ×3 with PBS. A suspension of K562 cells or EBV-LCLs were plated on the microraft array at various densities and the array was centrifuged at 400×g for 3 min. The array was then rinsed gently ×2 with medium to remove any cells that did not settle on to a microraft. Cells were cultured in a 37°C incubator with 5% CO2.
2.2.8 Cell staining
2.2.9 Gelatin encapsulation and fluorescent gelatin
In those experiments isolating cells encapsulated in a hydrogel, the culture medium was aspirated after plating cells on microraft arrays coated with 0.1 wt% bovine gelatin, and bovine gelatin in PBS varying in concentration between 0 wt% and 10 wt% was added. The array was then incubated for 10 min at 37°C. The gelatin solution was then aspirated from the arrays which were placed at 4°C for 5 min to solidify the gelatin remaining within the microwells. Cold (4°C) culture medium was added to the arrays, which were then subjected to the cell isolation procedure (see below). For those experiments using fluorescent gelatin, 0.1% Oregon Green 488 conjugated gelatin (Life Technologies, Carlsbad, CA, 505 µL) was mixed with a 10 wt% gelatin solution (495 µL) to generate a 5 wt% gelatin solution, which was added to the cell array as above.
2.2.10 Release and collection of microrafts
Targeted release and collection of microrafts was performed in a manner similar to that described previously.37 Briefly, after plating and culturing cells on an array, a microwell
into the collection well as described in the Results. In some experiments, a magnetometer (AlphaLab Inc., Salt Lake City, UT) was used to measure the magnetic field of each magnet and the magnetic field gradient (B) was calculated in MATLAB. In gelatin encapsulation experiments, the array was immersed in cold (4°C) media to maintain the hydrogel in the gelled state while the gelatin encapsulated cells on the microrafts were being released and collected on the stage of a microscope at room temperature (23°C). Released microrafts were transferred into warm (37°C) medium in the collection wells to melt the gelatin and release the cells. 2.2.11 Growth rate determination
K562 cells were seeded onto microraft arrays at a density of 0.33 cells/microraft. The array was either left in media or subjected to the gelatin encapsulation protocol as described above. Both sets of arrays were subsequently incubated at 23°C for 1 h to simulate the period where release and collection would take place. The arrays were then placed in a humidified, 5% CO2 incubator at 37°C for 48 h and imaged periodically. The cell number was counted at
each time point and the data were fit to an exponential curve to determine the doubling time of the cells on each array.
2.2.12 Single-cell cloning efficiency
The single-cell cloning efficiency of K562 cells was evaluated after successful collection of single cells. After collection, the single cells were cultured 3 days in culture medium at 37°C in a 5% CO2 incubator. The cells were imaged after the 3 day culture period
to assess how many cells successfully proliferated. 2.2.13 Quantitative RT-PCR
weak intercellular adhesion divided more rapidly with >20 cells per microraft at the time of analysis. For this reason microrafts with cells were collected and pooled until approximately 20-25 cells were present for each cell phenotype for each time point for the RT-PCR experiments. RNA was isolated using Qiagen’s RNAeasy Micro Kit. Microrafts containing encapsulated cells were released and transferred to Eppendorf tubes containing 75 µL Buffer RLT. Carrier RNA (20 ng) was added, the samples were heated at 37°C for 1 min to melt the gelatin then vortexed for 1 min to homogenize the cells. The Superscript III First-Strand Synthesis System for RT-PCR was used to synthesize cDNA with oligo(dT) as the primer. The manufacturer’s protocol was followed, except that 4 µL of T4 Gene 32 Protein was added to each 20 µL reaction. cDNA synthesis was performed on a Veriti 96 Well Thermal Cycler (Applied Biosystems, Thermo Fisher Scientific, Inc., Waltham, MA). Expression of glyceraldehyde-3-phosphate dehydrogenase (GAPDH) was quantified using a predesigned assay reagent containing a 6-FAM/MGB-NFQ labeled probe (Single Tube TaqMan Gene Expression Assay). EBV nuclear antigen 2 (EBNA-2) was quantified by TaqMan PCR using forward GCTTAGCCAGTAACCCAGCACT-3’) and reverse (5’-TGCTTAGAAGGTTGTTGGCATG-3’) primers and a TaqMan probe (5’-FAM-CCCAACCACAGGTTCAGGCAAAACTTT-TAMRA-3’) designed by Bell et al.39 The PCR
reactions contained 300 nM of each EBNA-2 primer and 250 nM of the EBNA-2 probe. PCR reactions were prepared in a final volume of 20 µL using TaqMan Universal PCR Mastermix II, and quantitative PCR was performed on an Applied Biosystems 7300 Real Time PCR System with the following thermocycling conditions: 50°C for 2 minutes to activate uracil-N glycosylase and 95oC for 10 min to activate AmpliTaq Gold, followed by 55 cycles of
performed in triplicate, and no-template controls were used. Fluorescence was measured during the 60°C incubation in each cycle. Data was analyzed using DataAssist v3.01 Software (Applied Biosystems), with the maximum allowable CT set at 40 and included in the
calculations.
2.2.14 Statistical Analysis
MATLAB was used for all statistical analyses. A one-way ANOVA test was performed to determine statistical significance between collection efficiencies and viabilities of K562 cells isolated with the gelatin encapsulation technique. The Tukey-Kramer method was used to determine which groups were statistically different if the one-way ANOVA indicated a group was different.
2.3 Results and Discussion
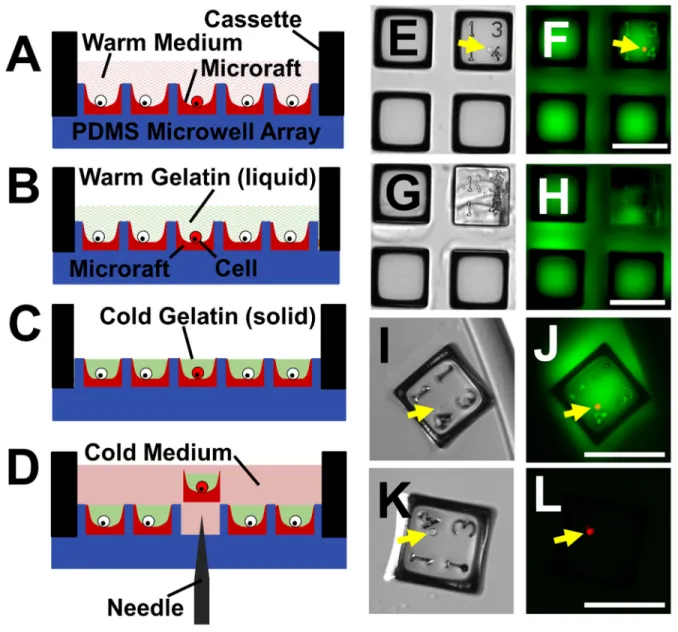
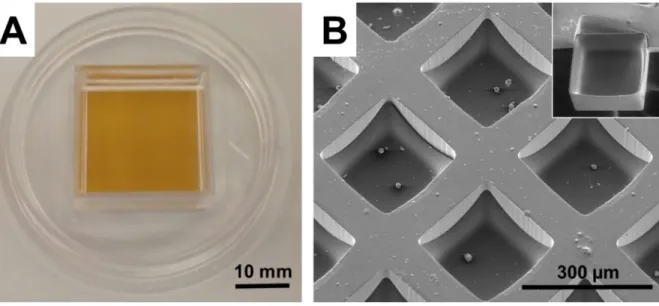
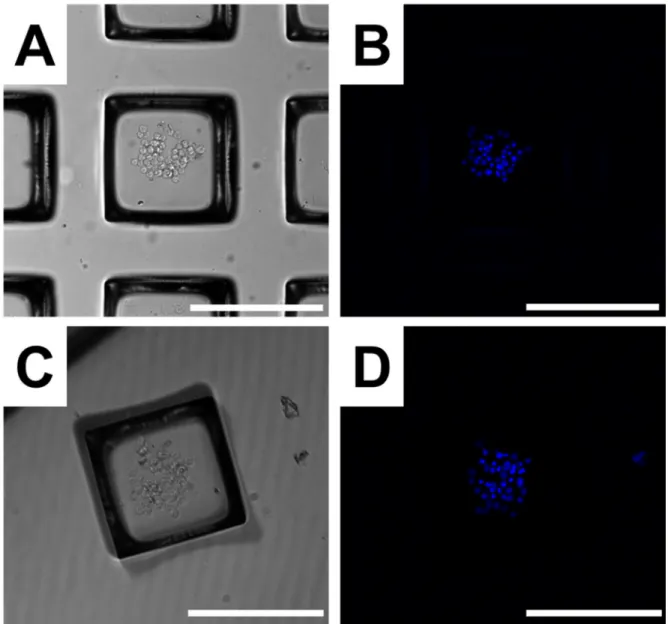
2.3.1 Overview of hydrogel-based encapsulation and collection of cells on an array Initially, a strategy to screen and sort individual cells without the need for cell adhesion to the array elements was identified and each step optimized (Figure 2.1). Briefly, K562 cells (a non-adherent leukemic cell line), were cultured on an array containing superparamagnetic, concave microrafts (Figure 2.2) and overlaid with a liquid gelatin (Figure 2.1A-B). After aspiration of excess liquid from the array, the residual liquid pockets were solidified (Figure 2.1C,E,F).
Microrafts with cell(s) encapsulated in hydrogel were released using a motorized microneedle assembly (Figure 2.1D,G-J) and transferred to a multiwell plate using a magnetic transfer device.37 Dissolution of the gelatin then released the targeted cell(s) from the microraft
2.3.2 Impact of gelatin encapsulation on cells
Gelatin was tested as a potential hydrogel since it is biocompatible, optically transparent, commonly used in cell culture, and undergoes a reversible, temperature-dependent, liquid (4°C)-to-gel (37°C) transition. To determine if the encapsulation process displaced the cells during the procedure or had an untoward impact on cell viability, K562 cells were cultured at a density of 0.33 cells/microraft on an array so that <1 cell was present on the majority of microrafts. The arrays with cells were imaged, the positions of microrafts containing cells were recorded, and then the array was overlaid with liquid gelatin (5 wt%, 37°C) and incubated for 10 min. Excess gelatin was aspirated and the arrays were placed at 4°C (5 min) followed by addition of cold (4°C) medium. The microrafts were then re-imaged and the cell number for each microraft counted (n=405 microrafts). The majority of microrafts (97.8±1.1%) possessed the same number of cells before and after gelatin encapsulation, demonstrating that most cells remained in place during the encapsulation and gelation steps. Only 1.6±1.0% of microrafts had an additional cell after gelatin encapsulation. Since cells were seeded on the microraft array at a density of 0.33 cells/microraft, there was a 0.5±0.3% chance that a microraft containing a cell prior to gelatin encapsulation would be contaminated with another cell during encapsulation. Thus gelatin encapsulation was effective in maintaining the cell's location on the array.
simulate a release and collection period. The arrays were then placed at 37°C, whereupon the hydrogel on the encapsulated array dissolved. The arrays were imaged at multiple time points over the next 48 h and the number of cells at specific sites were counted to determine the average doubling time of the cells under the two conditions (Figure 2.3). The data was fit to an exponential curve and the doubling time of the cells on each array was determined. The doubling time for K562 cells grown on an array after gelatin encapsulation was 18.34±0.04 h, which was not statistically different (p=0.28) from that on arrays not exposed to gelatin (19.15±0.65 h). Based on these data, encapsulation with gelatin for up to 1 h did not alter the subsequent growth rate of K562 cells.
2.3.3 Motorized microraft release system
Microrafts have previously been released by manually puncturing the PDMS microwell array with a needle to dislodge an individual microraft.36, 37 This method, while effective, is
release, including upward and downward travel of the needle, using the manual release was 9.5±0.4 s while the motorized microraft release system set to the maximum travel speed of 10 mm/s was 1.9±0.0 s. The motorized release system was then evaluated on a microraft array with gelatin-filled wells to access the impact of encapsulation on microraft release. At all velocities, microrafts were released with 100±0% efficiency and none (0±0%) showed physical damage. The motorized microraft release system was significantly faster than manual release (p<<0.01) and was highly efficient irrespective of the presence of a gelatin pocket above the raft. For all further experiments, the release system was set to a travel speed of 10 mm/s. 2.3.4 Magnetic microraft collection device
Microrafts containing superparamagnetic γFe2O3 nanoparticles have been collected
manually using an external magnet after release from the array.37 This method has been ideal
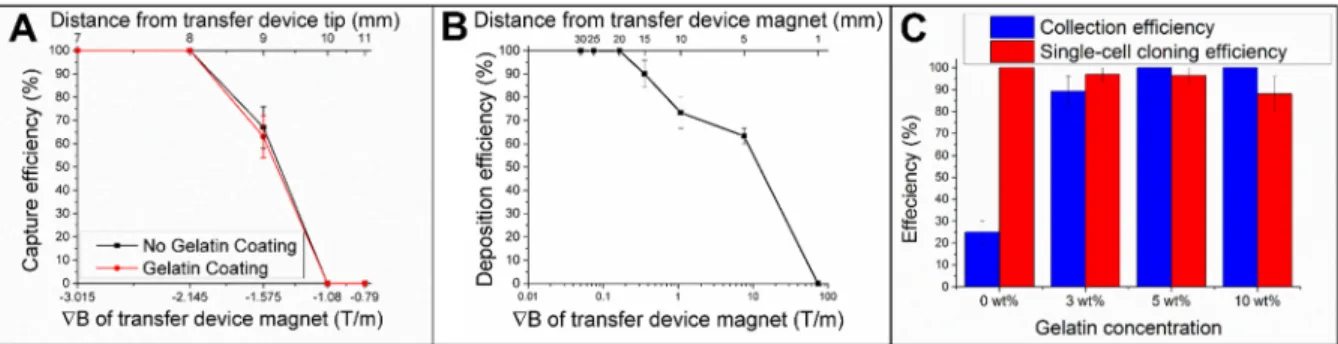
and without gelatin encapsulation was assessed (3 trials, n=10 microrafts/trial). For distances of ≤8 mm between the surface of the array and the magnet (B ≥ 2.1 T/m), 100% capture efficiency of released microrafts was attained irrespective of gelatin encapsulation. Thus, the magnetic collection device did not need to be in extremely close proximity to the released microraft to effect capture. It is expected that a stronger magnet would enable even greater capture distances.
was used for all further experiments. This magnetic microraft collection device also reduced the labor and reagents needed to isolate many microrafts into individual containers compared to the previous method of collection into a relatively large Petri dish lid.37
2.3.5 Optimization of gelatin concentration for combined release, capture and deposition of cells