Design for Additive Manufacturing
Final Design Report
JP Purdom [email protected]
Leonardo Franco-Muñoz [email protected]
Sam Noble [email protected]
Michael Charonnat [email protected]
Mechanical Engineering Department
California Polytechnic State University
San Luis Obispo
Spring 2020
Prepared For:
Jorge Hernandez
Statement of Disclaimer
Abstract
Table of Contents
1. Introduction ... 1
2. Background ... 3
2.1 Design for Laser Powder Bed Fusion Research...3
2.2 Why AM?...4
3. Design for Mass Reduction ... 6
3.1 Objectives...6
3.1.1 Needs and Wants Table ... 7
3.1.2 QFD House of Quality ... 8
3.1.3 Specifications Table ... 8
3.1.3 Methodology ...9
3.1.4 Fit, Form, & Function ... 9
3.1.5 Benchmarking ... 10
3.2 Structural Optimization & Shape Studies ... 12
3.3 Topology Optimization ... 13
3.3.1 Generative Design ... 13
3.4 Design for Additive Manufacturing ... 14
3.4.1 Principles of Design for AM ... 14
3.4.2 Design Direction ... 15
3.5 Final Design ... 15
3.5.1 Final Design Concept ... 15
3.5.2 Final Design Validation ... 16
3.5.3 Final Part Printing ... 17
3.5.4 PLA Test Print ... 19
3.6 Metal Printed Part ... 20
3.6.1 Metal Print ... 20
3.6.2 Final Validation & Future Work... 21
4. Design for Warpage Compensation in Thin-Walled Members ... 24
4.1 Background & Objectives ... 24
4.1.1 Residual Stress & Warpage ... 24
4.1.2 Objectives ... 25
4.1.3 Splash Plate Case Study... 25
4.1.4 State of the Art (Prior Sponsor Work) ... 27
4.2 Methodology ... 28
4.3 Netfabb Simulation ... 30
4.3.1 Netfabb Simulation Utility... 30
4.3.2 Netfabb Simulation Process ... 30
4.3.3 Netfabb Simulation Results ... 36
4.5 Future Work ... 46
5. Software Comparison ... 47
5.1 Netfabb ... 47
5.2 ANSYS... 48
5.3 3DXpert ... 52
5.4 Results and Recommendation ... 59
6. Project Management ... 64
7. Conclusion ... 65
8. References ... 66
Appendix A: QFD House of Quality ... A
Appendix B: Gantt Chart ... B
Appendix C: Bracket Drawing ... C
Appendix D: Benchmark FEA ... D
Appendix E: Benchmark Hand Calculations ... F
Appendix F: Modal Analysis Constraints ... H
Appendix G: Generative Design ... J
Appendix H: Topology Optimization of Original Part ...K
Appendix I: Autodesk Netfabb Detailed Simulation Procedure ... M
Appendix J: Autodesk Netfabb Online Resources ... U
Appendix K: 3DXpert AM Simulation Details ... V
1. Introduction
Additive manufacturing is the official industry standard term (ASTM F2792) to describe all applications of the various technologies that build 3D objects using a process of adding layer-upon-layer of materials. There exists a multitude of processes and material combinations throughout industry; however, this project will be focusing solely on metal additive manufacturing, specifically laser-powder bed fusion (L-PBF). L-PBF, as the name suggests, is the process by which a laser is used to melt and fuse powder material together. All L-PBF processes involve spreading a thin layer of metal powder, scanning specific areas with a high-energy laser, and fusing or sintering this layer to the previous layer. This process is continuously repeated until the final part is completed. This layer-by-layer method of construction allows for the manufacturing of complex shapes, intricate lattice structures, and functional assemblies that are not possible with traditional manufacturing processes. These capabilities allow for optimizations in design as well as production.
The team’s sponsor, Solar Turbines (ST), designs and manufactures industrial gas turbines for power generation and oil and gas industries. The project will be specifically receiving support and guidance from Jorge Hernandez, Dr. Peter Schuster, and Dr. Xuan Wang throughout its entirety. Jorge Hernandez, a Design Engineer at ST, will be the team’s main point of contact with the company while Dr. Peter Schuster, a mechanical engineering professor, will serve as the main internal team advisor. Dr. Wang, a manufacturing professor with a specialty in additive technologies, will be an additional team advisor.
ST currently uses many traditional forms of manufacturing such as near net-shape and subtractive methods to create most of their components. They have, however, been recently exploring the implementation of additive manufacturing in the production of lower-risk parts. Due to the relatively low-volume production of these components, ST aims to incorporate AM with the goal of potentially decreasing lead times and manufacturing costs, while also exploring the unique design space provided by additive manufacturing.
This senior project team has been specifically tasked with redesigning two of ST’s cast parts for additive manufacturing. This redesign process will involve technical and manufacturing analysis. The desired result is a part that meets the engineering requirements associated with the corresponding cast part while being less costly, minimizing lead time, and removing mass to decrease weight. Not only will this redesign aid in the production of two ST parts using additive manufacturing, but the process will also provide ST with a valuable benchmark upon which to base further part redesigns for additive manufacturing and provide valuable guidelines for Design for Additive Manufacturing.
2. Background
The first few weeks of this project were spent gathering information about the project presented by ST with the intent of further understanding the issues ST is having with their current casting process. Through weekly meetings and extensive online research, a solid grasp of the task at hand was achieved.
Die casting is one of the most common manufacturing styles for complex metal shapes in the modern day, due to its simplicity and reliability. In order to create a part, ST must create a model of the part and send it to a manufacturer, who will use the model to create a mold for the part. Once the mold is made, a gating system must be designed to allow all parts of the mold to be filled before the metal cools in order to ensure homogeneity. Once the molten metal has been poured, and has hardened, the part must then be machined to bring its contact points into the specified tolerance. The overarching theme in the casting process is that the method requires much very expensive tooling and long, drawn out lead times to produce a part [1]. This long lead time obstructs new product development, while additive manufacturing provides a much faster iteration cycle. These complications with castings are the central issues that Solar Turbines is currently facing.
The alternative Solar Turbines has proposed is a two-part study on AM. The first part, a bracket arm will be redesigned and optimized for weight reduction, while maintaining stability and structure. The second part, a fuel injector splash plate, will be redesigned to optimize for minimum deflection.
Due to the global pandemic, COVID-19, the final part of this project was changed to a software comparison for the design of thin parts for AM. This is still a relevant and useful final project outcome because it will allow Solar Turbines to make an informed decision on what software package to use for simulating and performing prints in AM. The software used for this process is important because an ineffective program can cause a lot of wasted time, money, and resources in failed prints. For thin parts, proper distortion prediction is crucial in the design process. More accurately predicting distortion allows for a compensated design and less post processing on parts.
2.1 Design for Laser Powder Bed Fusion Research
The team has read through many journal articles and various other sources in order to further understanding the method of metal AM used by Solar Turbines as well as by Cal Poly’s IME department—the main goal being to identify the steps of the L-PBF process and to pinpoint all precautions that need to be taken in order to create the most uniform, quality part. This section gives a broad overview of the AM process while more specialized, in-depth explanations and design techniques will be discussed later in this report.
The first step in the L-PBF process is selecting the correct size, shape, and distribution of powder, which determines packing density and sintering rate [5].
strength curves which can cause premature part failure, or simply cause the part to combust while printing [4]. Improper orientation can also cause incorrect surface finish, warping, long build time, and excessive support structures, leading to more post processing, which translates to increased part cost. Another orientation concern is part overhang angle. Overhang refers to material that extend outwards beyond the previous layer of print. Because AM is a layer-by-layer process, overhang angles less than 45° will require excess support structure. The team will also need to consider lattice structures and surface thickness; Netfabb additive manufacturing software will likely be used to help make these decisions, along with input from Dr. Wang.
In addition to part orientation, the printing process takes hours of valuable time. If a part fails that is wasted time so ensuring the proper printer setup and part orientation is critical in making the best use of AM technology. Optimizing the part for printability includes considering the amount of material used in the print and how much post processing that will need to occur in order to finish the part. This is usually a trade off because usually when designing a part for minimal post processing, the print time will be longer because of tighter tolerances required. Inversely, one can design the part to have looser tolerances, which will then be cleaned up in the post processing. An example of this could be not printing a hole in a part to be cleaned up by a mill or lathe instead of printing that hole with tight tolerances to minimize the amount of finishing needed in the hole. After printing the part, the final step is post processing. In most cases, heat treatment is needed to increase ductility and further homogenize the part [1]. In addition, the support structures that were used during the printing process will need to be removed, and the surface finish will require examination.
The team has conducted research and met with Professor Wang in order to decide the best orientation for the parts provided from Solar Turbines.
2.2 Why AM?
“The unique capabilities of AM technologies enable new opportunities for customization, very significant improvements in product performance, multifunctionality, and lower overall manufacturing costs.” [2]
From a design perspective, AM offers the following capabilities:
• Shape Complexity: the ability to build virtually any shape or geometry
• Hierarchical Complexity: the ability to control and manipulate structures on multiple size scales (microns up to centimeters)
• Material Complexity: ability to process material one point or layer at a time
• Functional Complexity: ability to consolidate assemblies, reduce components, and minimize assembly costs
Although the cost of a die casted part is difficult to estimate based on the team’s current knowledge, general tooling for cast parts tends to be very expensive, not to mention the post machining necessary to bring contact points into the correct tolerance that requires labor cost and additional tooling cost [2]. The team estimates that the overall cost of AM parts may be higher than the cost of traditionally casted parts. However, this issue is offset by the weight savings and the speed of production that makes AM so attractive, specifically in new product development where geometry is constantly changing, and quick iterations are desired.
One downside to AM is its limited mass-production rate, especially for large parts such as the bracket arm. Smaller parts can be stacked or oriented in such a way that many can be printed at once, but in general, AM is not a good choice for mass production.
Solar Turbines has informed the team that their average lead time for the current part of interest is 130 days. The team conservatively estimates that the same part could be printed and ready to be installed in several weeks. This lead time decrease would be of significant benefit to ST.
Furthermore, the quality of AM parts is much higher than that of cast parts. Most contact points are in tolerance after printing, minimizing the need for post machining in that aspect. In general, L-PBF parts will have a higher yield strength and hardness than traditionally cast parts. However, they are often much less ductile (more brittle) due to rapid heating and cooling, which causes porosity and impurity within the part [6]. Adapting the design to reflect these differences is the key focus of this project.
3. Design for Mass Reduction
The following section details the design for mass reduction objectives, design methodology, final prototype, and printing.
3.1 Objectives
Solar Turbines traditionally utilizes casting to manufacture a large portion of their metal parts. While casting is an effective method for mass-producing parts, casting processes often involve long lead times, require expensive tooling, and can be cost prohibitive in low volume productions. Thus, Solar Turbines would like us to perform in-depth analysis exploring the affordability & feasibility of 3D printing their cast parts and investigating how the utilization of additive manufacturing can reduce material, cost, and lead time while maintaining crucial mechanical properties.
The overall design process for this project consists of two major phases, consisting of redesigning a bracket and a splash plate. Given this two-phase nature, this preliminary design report will focus solely on the first phase involving the redesign of the bracket part. A revised scope of work and a design report will be provided at a later date outlining the second phase of the project involving the redesign of the splash plate part.
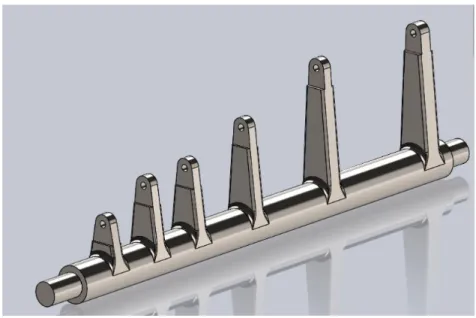
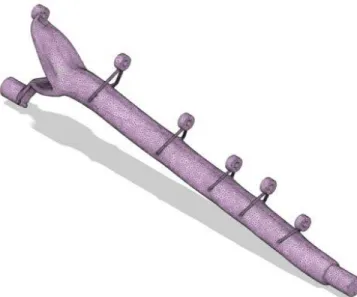
The bracket being redesigned in the first phase of the project is shown in Figure 1 below.
Figure 1. Original part provided by Solar Turbines
research, calculations, analysis, and 3D printing are performed which results in the final product: a lighter, cheaper, and equally strong part.
Figure 2. Boundary diagram used to define scope of problem 3.1.1 Needs and Wants Table
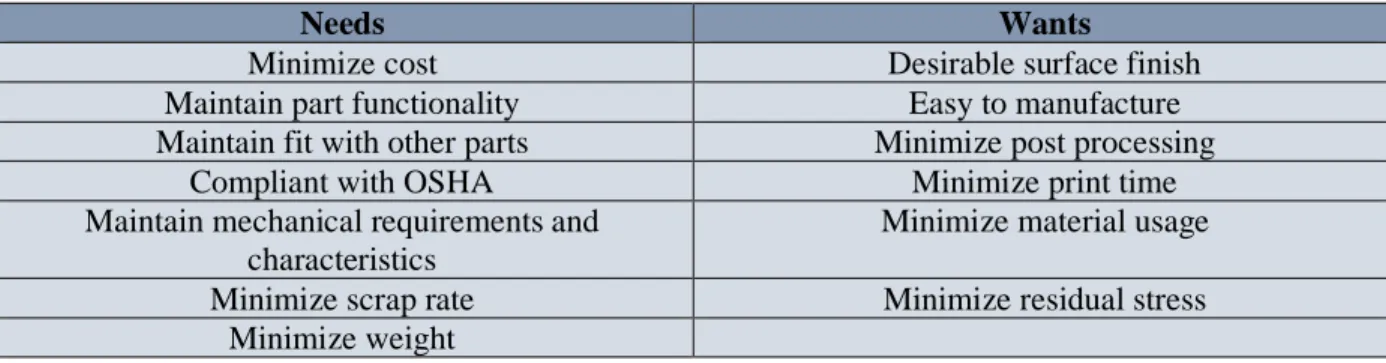
Through sponsor meetings and background research, the team made a collaborative effort to identify Solar Turbines’ specific wants and needs for the project. These specifications are depicted below in Table 1.
Table 1. Needs and wants of Solar Turbines
Needs Wants
Minimize cost Desirable surface finish
Maintain part functionality Easy to manufacture
Maintain fit with other parts Minimize post processing
Compliant with OSHA Minimize print time
Maintain mechanical requirements and characteristics
Minimize material usage
Minimize scrap rate Minimize residual stress
Minimize weight
want can bring to the final part. The items in this list are not ordered in a specific structure. For a prioritized list, see the Quality Function Deployment (QFD) in Appendix A.
3.1.2 QFD House of Quality
The purpose of using a QFD is to properly understand and define the problem being solved. By separating multiple categories and relating them to each other, one can get both a small and large picture for understanding of the process. A QFD is created by first determining the customers. This project’s customers include Solar Turbines and various technicians involved in the manufacturing, installation, and maintenance of Solar Turbine’s part. In the next step, one lists out the needs and wants of the project’s customers and gives those items a weighting to determine importance of each need or want. Next, one defines how the needs or wants will be achieved. This process includes a specific characteristic or goal to go along with the specifications. The next section to be completed is the “Now” section. This section examines the current products on the market and evaluates them against the needs and wants previously listed. This is a way to benchmark goals against other current products to see if your solution will improve upon the existing solutions. For this project, the current solution is the current cast part. At the bottom of the chart are some target values that give some of the specifications as more tangible and defined goals. For example, the weight specification has a target value of 18 lbs. Lastly, there is a roof structure on the top of the chart that relates the different specifications and determines whether there is a positive or negative relationship between the two. The team’s QFD can be found in Appendix A.
3.1.3 Specifications Table
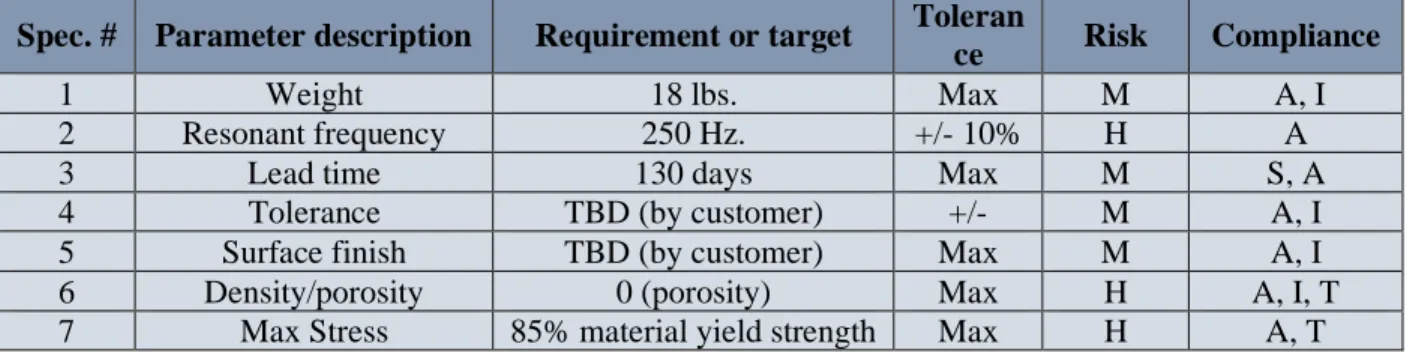
The desired specifications (taken from the QFD) for the final part can be found below in Table 2. In the compliance column, “A” stands for analysis, “T” stands for testing, “S” stands for similarity, and “I” stands for inspection. The specifications are listed below in greater detail.
Table 2. Table of desired specifications
Spec. # Parameter description Requirement or target Toleran
ce Risk Compliance
1 Weight 18 lbs. Max M A, I
2 Resonant frequency 250 Hz. +/- 10% H A
3 Lead time 130 days Max M S, A
4 Tolerance TBD (by customer) +/- M A, I
5 Surface finish TBD (by customer) Max M A, I
6 Density/porosity 0 (porosity) Max H A, I, T
1. The first specification is the desired weight of the final product. The part’s weight will be determined both in the CAD software and on a scale once it has been printed.
2. The second specification is a restriction on the resonant frequency of the final part. To be specific, the part cannot have a resonant frequency of 250 Hz. The part will be analyzed in software to determine its first modal frequency.
3. Specification 3 is the lead time required to manufacture the part. This specification will be measured using similarities to other 3D printed parts and a test run of this specific printed part.
4. Specification 4 is final dimensional tolerance the part should have. The tolerance will be measured as part of inspection.
5. Specification 5 is the final surface finish the part should have. The surface finish will be measured as part of inspection.
6. Specification 6 is the final porosity the printed part should have. Porosity will be verified with inspection, testing, and analysis based on research.
7. Specification 7 is the final amount of tolerable stress desired by the redesigned part.
3.1.3 Methodology
The team crafted an organized approach to the problem which is listed below and then explained in greater detail in the sections to come.
• Understand fit, form, & function of the bracket • Benchmark current design
• Conduct shape studies
• Investigate principles of design for AM • Generate initial design concepts
3.1.4 Fit, Form, & Function
Before proceeding with any design work, the team gained a comprehensive understanding of the fit, form, and function of the proposed part. This process allowed the team, as designers, to identify as well as maintain the appropriate design constraints and requirements throughout iterations of the new designs.
bracket arms must be preserved. In order to preserve part interfacing, these features must not be altered.
Form refers to the existing shape, geometry, and composition of the part itself. While the team is tasked with preserving the original material (i.e. 316L Stainless Steel), the shape and geometry are free to change in order to accommodate metal additive manufacturing with a target mass reduction of 50%.
Function refers to the use, purpose, and requirements of this part. The bracket must maintain its original form and function of adjusting the compressor veins’ angle to adjust airflow as the turbine ramps up during the startup process. This process involves a 500 lb load applied to one arm of the bracket which is then distributed to the other bracket arms as the bracket is actuated. Thus, any and all proposed designs must be able to serve the same purpose as the original. 3.1.5 Benchmarking
With a comprehensive understanding of the bracket’s critical features as well as general function, the team proceeded to benchmark and analyze the mechanical performance of the current cast part. This procedure was a crucial step in the team’s process as it enabled the team to appropriately compare proposed designs to the original design using quantitative metrics. Given the static loading, operating frequency, and operating temperature the bracket experiences within its assembly, the mechanical performance criteria used in this analysis were the minimum Safety Factor (SF) as well as the first natural frequency.
The team first began constructing a 3D model of the current part in SolidWorks, a CAD software, using dimensions provided by Jorge Hernandez. Following this step, static finite element analysis (FEA, in Fusion360) and modal analysis (in ANSYS Workbench) were conducted using a variety of geometric constraints and loading conditions. Results were gathered, interpreted, and tabulated in the following sections. Hand calculations using mechanics of materials fundamentals were also conducted for further validation. The results depicted large safety factors, predictable stress concentrations, and satisfactory first natural frequencies. The team’s process of FEA and modal analysis are documented in detail in the following sections.
3.1.5.1 Static FEA
The team dealt with a variety of constrains and conditions in order to attain the most representative model of the part in loading. Two end constraint conditions were identified that could model the part. Both models are subjected to an operating temperature of 800ºF, and the temperature affect is included in both cases. The team felt that the optimal conditions that best represented the part were described by Case 1. Case 2 will be documented in Appendix C. Hand calculations for Case 1 are also documented in Appendix D.
Figure 3. Case 1 FEA
Table 3. Benchmark Max Stress Conditions
Max stress 9.1 ksi
Max surface stress 3.9 ksi
Factor of Safety 3.2
The maximum stress was found to be 9.1 ksi at the base of the largest bracket arm. The surface stress on the surface of the cylinder was 3.9 ksi.
The ends show a higher than normal stress concentration due to thermal loading, but this condition is not alarming because the constraints on the physical model will have expanded due to the operating temperature as well. Both max stress and surface stress are significantly below the material’s yield stress, leaving plenty of room for material removal and cost reduction.
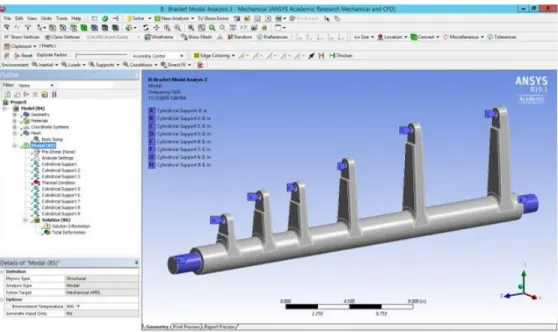
3.1.5.2 Modal Analysis
Figure 4. Modal Analysis Constraints
The results of the study are documented below in Table 4. Table 4. Modal Analysis Results
Mode Frequency (Hz)
1 550.7
2 1180.1
3 2086.3
4 2330.9
5 2741.0
6 2942.9
3.2 Structural Optimization & Shape Studies
optimized structurally while maximizing stiffness and minimizing mass. The team’s procedure for these two methods is documented in detail in the following sections.
3.3 Topology Optimization
Topology optimization uses a computer algorithmic process to reveal the most efficient design based on a given set of constraints and criteria, both physical and geometric. Given the team’s mass reduction of 50% and the design freedom of AM, the use of this study was a critical step in understanding where mass could potentially be removed from the current part. By removing excess material that is not critical to the performance requirements of the current design, the topology optimization software eventually guided the team’s design direction and final design concept.
The team used the topology optimization feature found in Autodesk Fusion 360. Using the same constraints and loading conditions depicted in the Benchmarking section of this report (4.2.1 Static FEA), the team began adding additional targets and constraints within the software. One of the most critical constraints incorporated in this study was the definition of preserve geometry. The team clearly defined regions that were crucial in maintaining part fit and function. The team also set a desired target mass of 60% or below that would enable the software to qualitatively highlight the importance of certain mass regions.
After compiling this study, the team was able to visualize and understand where mass could be removed from the current part and therefore, optimize for AM. The setup and results of this study are depicted in Appendix G.
3.3.1 Generative Design
Figure 5. Generative design model
The generative software gave the team an idea of how to eliminate stress concentrations by orienting the shaft more horizontally, decreasing the length of the protruding brackets. Unfortunately, orienting the shaft in this way would require additional support structures and possibly require printing in a different orientation. Changing print orientation significantly decreased the printability of the part and would require excessive post processing. With these factors in mind, the team opted not to follow the generative design path. While generative design was not ultimately used for the part, it was a helpful tool in the preliminary design process.
3.4 Design for Additive Manufacturing
3.4.1 Principles of Design for AM
Throughout the entirety of the preliminary design process, the team conducted extensive research into the specific principles governing Design for AM. These principles were fundamental in defining a clear and logical design direction. Summarized below are some key insights. Design for AM Principles:
• Build Orientation (most critical)
o Affects part accuracy, build time, and surface finish
• Support Structure Generation & Removal
o Minimizing support material reduces part cleanup and post-processing
o Too little support material can lead to part distortion/warpage and ultimate failure
• Hollowing Out Parts
o Reduces build time, mass, and material cost
• Interlocking Features
o Understand that there is a finite build volume
3.4.2 Design Direction
With new direction in mind regarding orientation and printability, the team decided that the safest, most reliable print orientation was horizontally along the shaft with the brackets protruding vertically. The next step was to optimize the part for weight. There was a noticeable over-designing of the original part, which was validated by our benchmark FEA. The team opted to hollow out the main shaft and replace it with a lattice structure during printing. In addition, material was removed from the brackets. While this decision was based on engineering knowledge and experience, a topology study was conducted in order to validate these ideas. The results of this study validated the team’s material removal decisions and can be found in Appendix G. Solidworks estimated a weight reduction of about 44%, bringing the parts weight down to an estimated 19.7 lbs.
3.5 Final Design
3.5.1 Final Design Concept
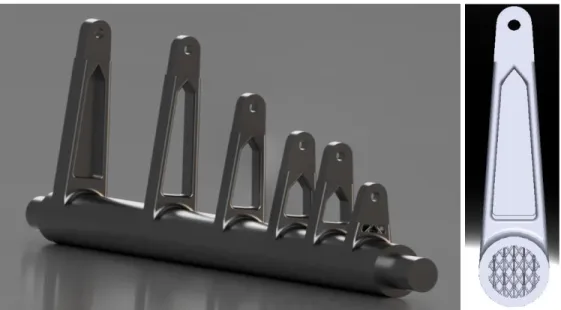
Through iteration and analysis, the team eventually reached a final product that both optimized weight and retained strength within tolerance. The final product, shown in Figure 6, was one the team hoped would be both easily printable and post-machinable. The team decided on a part that optimized weight, ensured structural stability, and could be easily post processed.
3.5.2 Final Design Validation
After deciding on the most practical part, the team ran the same tests as during the benchmarking process to ensure the part maintained its structure and stability under fully loaded conditions. The FEA and modal analysis results are shown below.
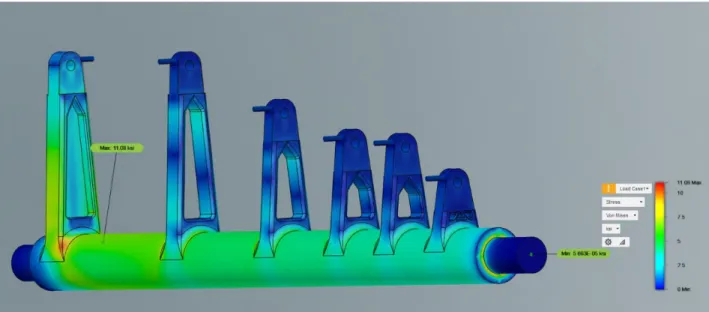
Figure 7. FEA on final part showing max stress of 11.08 ksi
Validation FEA was conducted with the same constraints as Case 1 in the Benchmark FEA process to ensure consistency and credibility. Validation FEA results are tabulated below and compared to material Yield Strength.
Table 5. Validation FEA Results
Max Stress 11.1 ksi
Yield Strength 24 ksi
Factor of Safety 2.2
Below are the results of modal analysis conducted on the bracket part.
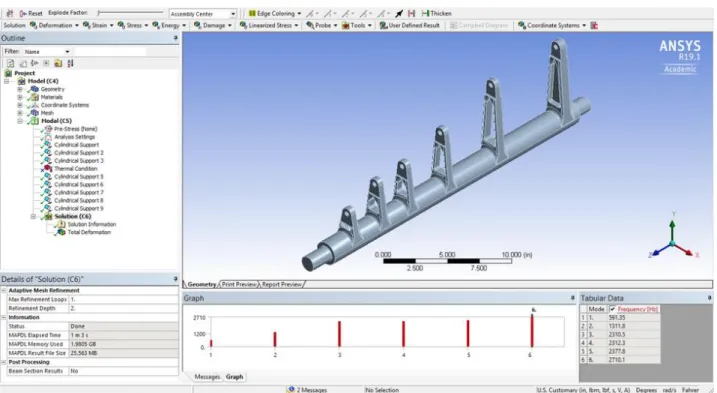
Figure 8. Final Part Modal Analysis
Table 6. Final Part Modal Analysis Results
Mode Frequency (Hz)
1 591.35
2 1311.8
3 2310.5
4 2312.3
5 2377.8
6 2710.1
The Modal Analysis results confirm that the final part will be well away from the operating frequency of the turbine and will not cause any vibratory issues during operation.
3.5.3 Final Part Printing
3.5.3.1 Part Orientation
The first step was deciding on build orientation. After a visit to Solar Turbines, the group gained insight from manufacturing engineers that suggested the part be printed in the way that it is shown in Figure 6: horizontally with all brackets oriented vertically. This would allow the part to be cut directly off the printing plate and eliminate the need for support structures on the outside of the part.
3.5.3.2 Part Latticing
The next step was to lattice the part in an additive manufacturing software called Netfabb to prepare the part for printing. This process proved to be quite challenging and required the team to change the structure of the part from a singular part to an assembly of smaller parts, which would make the latticing process much easier and more effective. The team wanted to design the part to be almost completely free of support structures, so choosing a lattice that did not exceed overhang angles was essential. After investigating many lattice structure options in Netfabb, the team eventually found a lattice structure that would not require any additional support structures and would enable the lattice to act as the support structure for the printing of the shaft. Lack of overhand angles in the lattice was an essential part of this lattice selection process. The team determined that the lattice structure would only add around 1 pound to the overall part and would not require removal. Furthermore, the lattice would also add stiffness to the shaft, compared to a completely hollow shaft, and thus have a higher first modal frequency than a hollow part. The lattice structure is depicted in Figures 7 and 8.
Figure 10. Internal Lattice Structure
3.5.4 PLA Test Print
The team decided to test print a section of the part on campus to ensure the latticing would not cause any issues. One concern with the latticing was the print orientation and over-hang angle. Printability was a concern but by making sure the over-hang angle of the latticing never
exceeded 45 degrees, the test print verified the presumption that this orientation would result in a successful print. The results were reassuring, as the part printed successfully, as shown in Figure 9.
3.6 Metal Printed Part
3.6.1 Metal Print
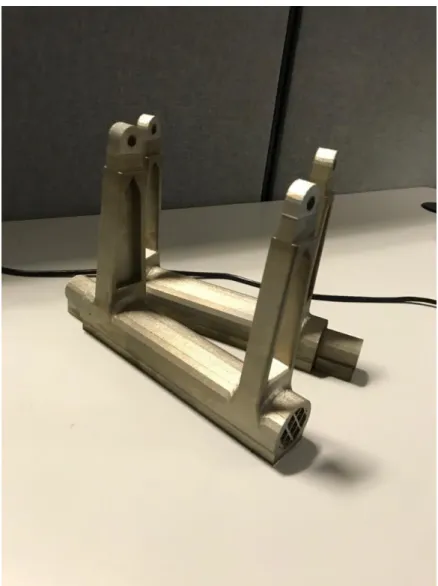
Following a successful test print using PLA and approval from Solar Turbines, the team went forward with printing a section of the part in stainless steel 316L. The team generated the appropriate mesh files for printing and these files were sent to Solar Turbines to be printed in-house using their Concept Laser M2 machine. In late January 2020, Solar Turbines informed the team that two copies of the part were printed successfully without any complications. The two copies are depicted in the figures below.
As can be seen on the cylindrical portions of the parts, the resolution of the STL files was coarse and produced rough surfaces instead of smooth contours. While large STL file sizes will be a challenge, future printing of the bracket should involve higher resolution STL files for optimal results.
Figure 12b. Brackets Printed in 316L Stainless Steel 3.6.2 Final Validation & Future Work
In late February, the team received the final printed metal brackets from Solar Turbines. Upon initial inspection, the print was successful although a low mesh resolution was evident in the printing of the main cylindrical shaft. Had the team been able to provide a higher resolution meshed file, these results would have improved. However, the print does still serve as the culmination of the team’s proof of concept.
1. Post Processing – Post-machining or electrical discharge machining (EDM) and a finishing process (such as filing or sanding) would need to be used in order to remove the support material supporting the underside of the cylindrical bracket base and smooth the curved surface. This material is identified in Figure 11b below.
Figure 12c. Support Structure Needing Removal
2. Shake Table – In order to verify the results of the modal analysis conducted in section 3.2.2 Benchmarking, the bracket section would need to be tested on a shake table. An ANSYS modal simulation on the bracket section would need to be run first to obtain a predicted resonant frequency. Then, this testing would be carried out by constructing a fixture which would be used to securely attach the bracket to the shake table. The table would then be shaken at the operating frequency of 250 Hz and at a +/- 10% range around that frequency to ensure that the bracket section does not have a modal frequency in this range. Lastly, when the bracket is completely assembled, more complete shake table test should be conducted on the entire assembled bracket.
3. Metrology – The final last method of form verification will be measurement based. The first step is to use either a laser scan or cameras to generate a point cloud which can then be overlaid on top of the original 3D model on a computer to observe any distortion or differences between the printed part and the designed model. Significant distortion in the print is not expected since it does not have thin members, but distortion should be checked for. Secondly, the horizontal distances between the bracket arms should be measured to
4. Design for Warpage Compensation in Thin-Walled Members
4.1 Background & Objectives
This section details the background and objectives for the section of the project focusing on design for warpage compensation in thin-walled parts.
4.1.1 Residual Stress & Warpage
Thermal stress is one of the most unfortunate consequences of the metal additive manufacturing process. These thermal stresses are often unavoidable as they are caused by the extreme temperatures created by the large amount of energy deposited to rapidly melt or sinter the fine metal powders. When these metals are heated, the kinetic energy of their atoms and molecules increases causing them to move at much higher rates. This causes the average distance between the atoms to increase. This physical phenomenon is known as thermal expansion. When certain areas or sections of a print are exposed to these high temperatures as the energy source traverses the build area, the metal powder melts and expands forming a melt pool. As this melt pool cools, temperature gradients between different areas of the print volume are created. Uneven cooling in these different areas forces some regions to contract and others to expand. This ultimately results in the development of thermal stress, distortion, and warpage.
4.1.2 Objectives
The goal of this portion of the project was to accurately simulate the warpage of a thin-walled AM part and develop a warpage factor for the deflection. This warpage factor could then be used to compensate for the distortion caused by the printing process.
To research and analyze this subject, ST recommended that a case study be carried out on a curved, thin-walled part, called a splash plate. Given its thin-walled design and curved geometry, the splash plate was prone to warpage when printing and was expected to provide relevant results when analyzed.
Two design paths were originally considered for the splash plate. The first path was to develop a geometrical compensation for the splash plate warpage and pre-warp the geometry file prior to printing. Then, the compensated part would deflect into its proper shape while printing. The second option was to add additional structural support members, such as ribs running along the part, to help increase part stiffness.
4.1.3 Splash Plate Case Study
The splash plate part is housed in the combustion chamber of one of ST’s gas turbines. A ring of splash plates encircles the entrance to the combustion chamber and facilitates fuel injection. A fuel injector is seated on a grommet inside of the inner rim of each splash plate and introduces fuel into the combustion chamber, as can be seen in the two figures below. It is essential that each splash plate be manufactured carefully so that the plate fits correctly into the assembly and interfaces smoothly with the surrounding plates. The splash plate has traditionally been manufactured using nickel alloys due their superior performance and oxidation resistance at high temperatures. The figures below show the splash plate and its location in the gas turbine assembly.
Front View Rear View
The figure below details the dimensions required for the splash plate part.
Figure 16. Dimensions for Splash Plate Part 4.1.4 State of the Art (Prior Sponsor Work)
Prior to the team’s work on the splash plate, Solar Turbines preformed research into the printability and distortion of a similar splash plate. Solar Turbines was able to simulate the printing process of the splash plate in various orientations to determine the most optimal configuration that would minimize warpage. Once this iterative process was finalized and a print orientation was specified, Solar Turbines proceeded to print this part.
Following printing, Solar Turbines was able to qualitatively match the simulated distortion with the actual printed part distortion. Despite the regions of warpage being similar in location, the deflection magnitudes did not match.
4.2 Methodology
The team’s initial methodology and process was comprised of two phases:
1. to design for compensation of deflection of the thin-walled splash plate part
2. to develop a general design approach for thin-walled parts manufactured with AM.
This process development would aid Solar Turbines in both the current splash plate and future thin-walled part design. In order to accomplish these objectives, Autodesk Netfabb Simulation 2020 software was used to run simulations of prints with specific materials, printing machines, and print settings to predict deflection results in parts.
Netfabb software offers promising simulation and compensation capabilities that are able, post-simulation, to generate an essentially pre-deflected STL file that will deflect to the desired geometry. Ideally, ST would be able to use Netfabb software to simulate printing deflection results and print compensated STLs to solve deflection issues. While Netfabb software claims the previously mentioned abilities, verification of the software’s accuracy and documentation of simulation processes were needed for ST to have confidence in the software and achieve accurate printing results.
The team planned to first run numerous simulations using Netfabb to determine the optimal print orientation. With a print orientation selected, a physical part would be printed in 316L stainless steel using an SLM 125 printer in Cal Poly’s additive manufacturing lab. The dimensional accuracy of the printed part would then be quantitatively compared to the deflection predictions of the Netfabb simulation. Ideally, these results would then be used to determine a compensation factor that can be applied to the part geometry prior to printing to guarantee that certain geometric and dimensional tolerances are met. Using this compensation factor, a compensated STL can then be generated, physically printed, and assessed to determine effectiveness of the factor as well as the simulation capabilities of Netfabb. These results would guide further investigation into developing a process by which deflection could be accurately predicted using Netfabb and properly compensated for.
Front View Rear View Figure 17. Simplified, Half-Scale Splash Plate Part
The team used the thesis of a Cal Poly’s masters student, Sebastian Pohl, as a guideline to determine the methodology described in this section. Pohl’s depiction of his workflow when dealing with part compensation is shown below.
4.3 Netfabb Simulation
Netfabb Simulation is a thermo-mechanical simulation software for powder bed fusion processes to predict distortions due to internal stresses. To reduce the runtime of each simulation, it was developed as a multi-scale simulation, meaning parameters are first simulated on a detailed small fine-scale and the results are later applied on the final geometry (Autodesk, 2018).
Machine process parameters, such as laser power, and material properties, such as thermal conductivity, are used in conjunction to produce a Process Parameter File (PRM) which is
unique to the specific material and process parameter combination. This PRM file, along with the part geometry, are first inputted into a heat transfer analysis to determine the temperature history of the part at any given location and time. These temperature predications are then fed into a mechanical response calculation to calculate the deformation, stress, and cracking of the part during the entire build process. These results allow for engineers to simulate, validate, and iterate the print process to prevent print failure, warpage, or lack of fusion. The described software workflow is illustrated in the figure below.
Figure 19. Netfabb Simulation workflow [Autodesk, 2020]
4.3.1 Netfabb Simulation Utility
After discussion with Dr. Wang, Netfabb Simulation software was selected for running real-time deflection printing simulations. The team originally began with Netfabb Premium 2020 but ultimately found that Netfabb Local Simulation Utility was the correct software for running the simulations
4.3.2 Netfabb Simulation Process
The process began with the team investigating the operation of Netfabb’s Additive Manufacturing Simulation Utility. The simulation interface is shown in Figure 19 below.
Figure 20. Netfabb Additive Simulation Interface
Figure 21. Adding New Material Properties
Figure 22. PRM File Generation from: Autodesk
To generate a PRM file, a Local Simulation license is required. A figure of the PRM generation menu is shown below, accessed in “Processing Parameters.”
Figure 23. PRM File Generation
After generating a PRM file, remaining printing parameters can be entered—the machine type, build plate information, and operating conditions, under the Machine, Build Plate, and Operating Conditions menus, respectively. The Machine menu takes machine model and PRM file inputs, the Build Plate menu takes thermal and mechanical boundary conditions and heating inputs, and the Operating Conditions menu takes heat loss and ambient temperature inputs.
The next step in the simulation setup is to configure the solver settings and parameters. Important settings are the analysis type and recoater tolerance. The recoater tolerance percentage represents the amount of the new layer that the previous layer deflects up into. For example, 80% recoater tolerance means that a warning will be produced if the previous layer deflects into more than 20% of the current new layer (more details on recoater tolerance are given in Appendix H).
After all the settings are inputted, the mesh can be generated. Two mesh approaches can be used— “Wall Thickness” and “Layer Based.” The team chose to use “Wall Thickness” because the mesh accuracy could be controlled more precisely. Netfabb gives four mesh accuracy options, ranging from coarse (“Fastest”) to fine (“Most Accurate”). The team tested the “Accurate” mesh but found that the computer running Netfabb did not have the available processing power to run this mesh, so a “Fast” mesh was chosen. For simulation runs where more computing power is available, testing simulations with the both the lower and higher mesh densities and comparing the results is highly recommended.
Figure 25. Mesh Settings
After inputting mesh settings, a mesh preview can be generated to perform a visual check before running the simulation. After verifying the mesh preview, clicking the “Solve” button starts the simulation. The Job Manager displays the tasks that are running. Once the simulation is completed, the “Results” tab can be used to view the simulation outcomes.
4.3.3 Netfabb Simulation Results
4.3.3.1 Orientation
Simulations were run at three different angles from the vertical with the intention of assessing how the warpage varied with orientation and determining the optimal orientation for the splash plate on the build plate. The three orientations are shown below.
0° Orientation 5° Orientation 15° Orientation
Figure 26. Splash Plate Print Orientations
The three orientations were chosen based on several factors. Firstly, the orientations use minimal support structures compared to other orientations, such as laying the part face-down on the build plate or laying a curved edge of the part on the build plate. Furthermore, the orientations help to preserve the surface finish of the part, which is important to its function in the combustion chamber of the turbine. Lastly, orienting the parts vertically or semi-vertically allows for a higher number of parts to be manufactured in a single print on a build plate. This ultimately allows for faster production by increasing the volume of each batch.
4.3.3.2 Simulation Results Interface
Netfabb simulation results can be viewed by selecting the light bulb next to a particular parameter in the sidebar. The original geometry can also be hidden with the same method so viewing the simulation results is more feasible. In addition, the real-time printing process of the part can be viewed by clicking on the play button on the top menu bar. For any quantitative parameter, selecting the “Maximum” option on the far right of the top menu bar will display the location of the maximum value of that parameter on the part.
As an additional feature, Netfabb can pre-warp an STL file, such that, when the part prints, the part will warp into its correct shape. The option for generating this compensated STL file is located on the right-side extension of the top menu bar.
4.3.3.3 Deflection Results
Below can be seen the deflection results for each orientation tested by the team. As it was difficult to obtain clear images of the deflection results and there was no option to remove the solver mesh, the location of maximum deflection is identified on each result with the callout box.
Figure 28. 0° Orientation Maximum Deflection
Figure 30. 15° Orientation Maximum Deflection
From the result diagrams, it can be seen from the location of the max deflection callouts that the lower of the two upper corners of the splash plate was the area of the part most affected by deflection.
The maximum deflection results are summarized in the table below. Table 7. Simulation Deflection Results
Orientation Maximum Deflection (mm) Maximum Deflection (in)
0° 4.03 0.159
5° 4.78 0.189
15° 4.45 0.175
From the results, the 0° orientation clearly produces the least deflection.
4.3.3.4 Recoater Clearance Results
In addition to deflection, another important result obtained from the simulation was the predicted recoater clearance. This parameter indicates whether or not the recoater blade that spreads new powder for each coat will clear the part. Recoater clearance is of particular interest when a thin-walled part, like the splash plate, can undergo significant deflection and possibly deflect into the path of moving printer components.
The figures below show the recoater interference locations predicted for each orientation angle. Netfabb marks recoater interference with faint red lines. As it is very difficult to see these red lines without zooming very closely, red arrows indicating the locations of Netfabb’s predicted recoater interference have been added for increased clarity.
Figure 33. 15° Recoater Interference
4.4 Printing
Based on the simulation results presented in section 4.3.3, the 0° orientation was selected for printing, given its lower deflection and recoater interference. The existence of recoater interference on the 0° orientation was discussed with those operating the printer at Cal Poly and deemed small enough for a test print to be run.
The test print ran smoothly with no recoater issues. The printed splash plates can be seen in the figures below. The support on the lower top corner of the part in the front was intended to minimize warpage of the corner.
Figure 34c. Approximate Height of Printed Splash Plates
As expected, the printed parts were visibly warped after printing. Removing the parts from the build plate and removing support structures would ultimately reveal the parts’ final shape. Post-processing of the part is discussed in the next section.
4.5 Future Work
Unfortunately, the global health concerns caused by COVID-19 interrupted the team’s plans to perform measurements on the splash plate for comparison to Netfabb’s predictions. Because of the virus, all campus facilities were closed to students for the spring quarter. Below is a detailed summary of future work the team had planned to perform on the printed splash plates.
After successfully printing the scaled-down part, the team planned to utilize a coordinate-measuring machine (CMM) to create a model of the distorted part. With this model, the team could compare the part’s experimental warpage with the NetFabb prediction. During the background research stage, the team learned that NetFabb is often incorrect when predicting magnitude of warpage; however, the prediction is often correct in location and direction. The team planned to use the results from the CMM to find a scaling factor that could be applied to the full-scale part. The team would collect two separate sets of geometry data. One set would be measurements taken with the splash plate still on the build plate and then another set of measurements after it is removed. Netfabb’s simulation software can predict warpage in both scenarios and would be helpful for comparing Netfabb’s ability to predict the effect of residual stresses in warping.
In order the remove the part from the build plate, the team considered a few options. Sometimes parts can be stripped of their support structures and removed from the build plate with pliers and a band saw. However, with this extremely thin part, the risk of altering the geometry in bending or shearing could ruin the team’s data. Thus, the team planned to utilize an Electric Discharge Machine (EDM) cutter to remove the support structure. EDMs provide a precise, clean cut and would mitigate the risk of damaging the part.
5. Software Comparison
The use of software is crucial when designing for additive manufacturing. The team’s goal for this section was to compare three software packages and give a recommendation to Solar Turbines on which of the three packages is most intuitive to use and effective. Due to COVID-19, the team was not able to verify the accuracy of the print simulations with physical prints. However, a comparison between simulation results and software interface was conducted and is summarized below. The focus is centered on general simulation prediction trends and software interfaces since the team did not have time to refine all of the software settings and obtain reliable, quantitative deflection values.
When performing simulations, the team went through a typical workflow an engineer would be likely to use if they were running an AM simulation. This process included importing a part, choosing a printer type, adjusting the positioning of the part on the build plate, generating supports, running a simulation, and generating a compensated model. The process has been outlined below and unique and useful features of the softwares have been highlighted. The team decided to use the 0° part orientation in the software simulations.
An important note for the reader to keep in mind is that the 3DXpert and Netfabb simulation packages used in this analysis are commercial licenses, whereas the ANSYS packaged used was an academic license. Since the ANSYS license is not commercial, there may be differences in software interface and performance between the ANSYS software used at Cal Poly San Luis Obispo and the ANSYS software used at Solar Turbines.
5.1 Netfabb
The Netfabb simulation results from the Design for Warpage stage of the project (presented in section 4 of this report) were used for the software comparison, since the same simulation process was used for the Design for Warpage Netfabb simulation as was used for the simulations run in the software comparison stage of the project.
Figure 35. Netfabb Simulation Deflection Prediction
5.2 ANSYS
Figure 36. ANSYS AM Material Selection
Once desired materials are specified, the part geometry and a build plate model are imported or modeled using SpaceClaim. The part geometry must be manually positioned on the build plate in SpaceClaim. More details on this step are explained in Appendix I.
Figure 37. ANSYS Additive Wizard Geometry Selection
Over the next few steps of the wizard, mesh size, overhang angle, and material type are specified, as shown in the following figure. This allows for precise control of mesh size and easy assignment of material type to each part in the simulation.
After these settings are defined, the wizard asks for a detailed set print parameters, including layer thickness, laser speed, and hatch spacing. Once these parameters are entered, and thermal and mechanical boundary conditions are set on the build plate, the part is ready for simulation. The thermal simulation, followed by the mechanical simulation, can be run.
Figure 39. ANSYS AM Wizard Print Parameters Menu
After the simulation has finished, ANSYS can display a “heat map” of the part deflection and can generate a geometry file that is warped according to the simulation’s prediction. More details on viewing the results are explained in Appendix I.
Figure 40. ANSYS AM Simulation Deflection Prediction
5.3 3DXpert
Figure 41. Auto Position Priority Configurator and Results
Figure 42. Critical Areas for Support Structure Defined by 3DXpert
After the part is positioned, the next step is to generate support structures. The figure above shows the software determining what areas are critical to support (shown in red) which is defined by the maximum allowable overhang angle specified by the printer that was selected previously as well as areas that may benefit from support (shown in yellow). These settings can be changed manually as well if it is desirable.
Figure 43. Support Structure Regions
new regions, and the list of icons at the bottom show the various togglable overlays available. When the user selects a region, they are then given the option of what type of support to generate and a list of modifiable support parameters which can be seen in Figure 47. below.
Figure 44. Generated Cone Supports with Parameter Window
Figure 45. Defining Manual Support Regions
Figure 46. Simulation Results Options Window
Figure 47. Inner/Outer Displacement View
Figure 48. Compensated Model
The final step of this simulation was to have 3DXpert generate a compensated model based on the results from the simulation. Figure 52. above shows the results of this compensated geometry. The differences between the original model and the compensated model are subtle but if one examines Figure 52., one can see slight distortions in the upper right corner. When looking at the full simulation results in Appendix J., one can see that that is where the maximum deflection occurs.
5.4 Results and Recommendation
Figure 49. Netfabb Simulation Prediction
Based on the experience with the three software packages, the team has constructed the following table that outlines the positive and negative aspects of the software packages over a range of features.
Table 8. AM Software Package’s Important Features
Feature Netfabb 3DXpert ANSYS AM
Importing and Setting Up
Geometry
• Ability to modify parts through cutting and Boolean operations
• Not designed for modeling
• Can import a variety of file types
• Offers suggestions for part orientation
• Full CAD functionality
• Integration with Solidworks (3DExpert toolbar is added in Solidworks)
• Can import large variety of file types.
• Can auto orient part based on desired parameters (print time, least supports, etc.)
• Easy to import a large variety of file types
• SpaceClaim basic CAD functionality, but not as extensive as SolidWorks
• Part must be manually oriented
Printer selection and
settings
• Includes a large range of pre-defined printers
• Can generate new print parameter files
• Downloadable printer files
• Editable print parameters
• No Concept Laser option yet
• No printer selection option
• Must manually model build plate in SpaceClaim
• Confusing print parameter setup Material
properties
• Limited material property data
• New data can be easily imported in a formatted text document
• Confusing using material properties database
• Limited range of predefined materials
• Extensive material property database, including special set of AM materials
Generating support structures
• Straightforward support structure generation
• Supports can be
generated automatically or manually inserted
• Manual and automatic support generation
• Can manually add or edit generated regions with sketch tools
• Straightforward process for
generating support structure
• Can only generate one type of support structure
Simulation • Runs one simulation
• Meshing density can only be set with four vague options (fastest, fast, accurate, most accurate)
• Manually or
automatically defined element and layer size.
• Easily adjustable mesh settings
• Four options for
determining simulation
• Requires two simulations
Compensated model generation
• Generates compensated STL file
• Compensated model can be generated
• Model can be directly edited in CAD software.
• No compensated model generator, only a warped model
Technical Support
• Many useful community videos online explaining procedures
• Helpful instructions database on Autodesk website
• Very helpful technical support team that was ready to answer all the team’s questions
• Limited instructions on ANSYS website and no community support
• Technical support varies based on license type Learning
curve
Medium Medium High
General user interface
Simple & Clean Intuitive Difficult
Based on the team’s overall experience with Netfabb, ANSYS AM, and 3DXpert, the team recommends 3DXpert to Solar Turbines as the optimal software choice for running AM simulations. The Netfabb software package was simple, clean, and mostly straightforward but lacked the more extensive options presented by 3DXpert. The ANSYS AM software presents a convenient option for Solar Turbines to add an add-on package to their current ANSYS software. However, the ANSYS AM Wizard is still in early stages of development and lacks many of the intuitive and convenient features included in 3DXpert. The team concludes that, of the three software packages, 3DXpert has the most comprehensive set of capabilities, presents the most intuitive user interface, and has the most helpful technical support available to the user. While 3DXpert does not currently have a printer setting for Solar Turbine’s Concept Laser printers, 3DXpert plans to add support for more printers in the near future. The use of 3DXpert for Solar Turbine’s developing AM program would enable intuitive and powerful simulation capabilities to aid in the successful redesign and prototyping of AM parts.
6. Project Management
This section outlines the essential project milestones set and achieved over the course of the project.
The first step in this project was conducting background research and creating a problem definition. Subsequently, a detailed scope of work was outlined, and a comprehensive benchmarking process was completed for the bracket part. Next, a redesign of the bracket was completed, which included topology optimization, generative design, hand calculations, and discussions with Jorge Hernandez and Professor Schuster. The design concepts from this process were then summarized in a preliminary design review (PDR). With Jorge Hernandez’s feedback, a final design was configured and printed. These efforts on the bracket part spanned Fall Quarter 2019 and several weeks in Winter Quarter 2020.
During winter quarter, the work on the second part, the splash plate, commenced. After working through several significant software complications, simulations were run successfully with a simplified, half-scale splash plate with Netfabb, and the team began acquiring deflection results to compare with physically printed parts. While the simulations were being completed, two simplified splash plates were printed. Unfortunately, at the end of winter quarter, due to the effects of COVID-19, the team was not able to continue their proposed plan of measurements and validation between the printed parts and Netfabb.
At the beginning of Spring Quarter 2020, in creating a viable solution for remote project work, the team shifted focus away from validating Netfabb software performance. The team decided to instead concentrate on assessing a variety of additive manufacturing software packages that run printing simulations and comparing these software packages using a common set of criteria. The end goal was to advise Solar Turbines as to the strengths and weaknesses of each software to guide ST in selecting the best software for their applications. Clearly, quantitative assessments of the software performance were not possible. However, qualitative assessments of the additive software packages were very feasible and still of use to Solar Turbines.
Table 3 provides the project’s major milestones, while the Gantt chart found in Appendix B outlines the year-long project schedule.
Table 9. Overview of project timeline
Deliverable
Description
Quarter
PDR Delivered report and presentation
detailing final prototype concept for bracket part
Fall
CDR Delivered report detailing the findings
and results from Netfabb simulations and printing of the splash plate
Spring
FDR Compiled final report discussing
assessments of three software packages
7. Conclusion
This FDR document outlines the essential details and timeline for the Design for Additive Manufacturing Senior Project with Solar Turbines, Inc. The goal of this project was to redesign two of Solar Turbine’s cast parts for additive manufacturing in order to minimize the lead time, cost, and weight of the parts, as well as aid Solar Turbines in expanding their knowledge of Design for Additive Manufacturing principles and enable them to further incorporate the use of additive manufacturing into their production.
8. References
[1]: Attaran, Mohsen. The rise of 3-D printing: The advantages of additive manufacturing over traditional manufacturing. 28 June 2017
[2]: Gibson, Ian, et al. 3D Printing, Rapid Prototyping, and Direct Digital Manufacturing. [3]: Lewandowski, John J. Metal Additive Manufacturing: A Review of Mechanical Properties.
2016
[4]: Khairallah, Saad A. Laser Powder-bed Fusion Additive Manufacturing: Physics of Complex Melt Flow and Formation Mechanisms of Pores, Spatter, and Denudation Zones. 2016 [5]: Thompson, Mary K. Design for Additive Manufacturing: Trends, Opportunities,
Considerations, and Constraints. 2016
[6]: Garlea, Elena. Variation of elastic mechanical properties with texture, porosity, and defect characteristics in laser powder bed fusion 316L stainless steel. 2019
[7]: Stevenson, Kerry. “Discovered: How To Eliminate Metal 3D Print Warping.” Fabbaloo, Fabbaloo, 5 July 2019, www.fabbaloo.com/blog/2019/7/5/discovered-how-to-eliminate-metal-3d-print-warping.
[8]: Swartz, Paul. “EVALUATION OF TENSILE PROPERTIES FOR SELECTIVE LASER
MELTED 316L STAINLESS STEEL AND THE INFLUENCE OF INHERENT
PROCESS FEATURES ON STATIC PERFORMANCE .” California Polytechnic State University San Luis Obispo, 2019.
[9]: Yamanaka , Hajime. “THE EFFECTS OF WELD THERMAL CYCLES ON ADDITIVELY MANUFACTURED 316L STAINLESS STEEL .” California Polytechnic State
University San Luis Obispo, 2019.
[10]: Wang, Xuan. Warpage and Shape Distortion in Laser Metal Sintering . Warpage and Shape Distortion in Laser Metal Sintering .
[11]: Schmutzler, Christoph, et al. “Compensating Warpage of 3D Printed Parts Using Free Form Deformation.” Procedia CIRP, Elsevier, 19 Feb. 2016,
www.sciencedirect.com/science/article/pii/S2212827115011579.