Girish Keshav Palshikar, Amrit Lal Ahuja, and Harrick M. Vin
Tata Research Development and Design Centre (TRDDC) Tata Consultancy Services Limited,
54B, Hadapsar Industrial Estate, Pune 411013, India {gk.palshikar,amrit.ahuja,harrick.vin}@tcs.com
http://www.tcs-trddc.com
Abstract. Adata centreis a large centralized collection of IT infrastruc-ture (servers, databases, application software etc.) for business functions. Analysis of the servers in a data centre with respect to their utilization characteristics is important for effective management the IT infrastruc-ture - e.g., for reducing costs, improving reliability of business operations and capacity planning. Already saturated servers can crash with even a slight increase in workload and better usage of underutilized servers can save money and power. In this paper, we formalize several business ques-tions related to utilization of servers in a data centre: already saturated, near saturation, under-utilized and interesting utilization patterns. We provide algorithms that use rigorous statistical techniques to automati-cally identify servers that satisfy such conditions. We present the results of utilization analysis of a real data centre.
Keywords: Data centre, Performance Monitoring, Server utilization, Capacity planning, Saturation, Wilcoxson signed rank sum test.
1
Introduction
Facilitated by fast and cheap computers and data storage devices, IT is now an integral part of the business functions in most large organizations. The bulk of the IT infrastructure for business functions is provided by the data centres. A data centre (or server farm) is a centralized collection of computing, data storage, communication and software infrastructure. A data centre runs a vari-ety of software consisting of system software, operating systems, databases and business-specific applications. A data centre can be viewed as a loosely intercon-nected collection of communicating servers. Eachserveris a high-end computer equipped with data storage and appropriate software (applications, databases etc.). A data centre is often located in a single physical location such as a build-ing. It is not uncommon for a data centre to include 10,000 or more servers. As an example, a data centre for a bank stores all the transactional data for all of its branches and works as the “back-end” of the application programs to provide the required services to its customers and employees. A large organization may also have multiple data centres, e.g., organized according to regions. Since a data
R. Kannan and F. Andres (Eds.): ICDEM 2010, LNCS 6411, pp. 173–180, 2011. c
centre is an expensive and critical resource, effective management and utilization of the IT infrastructure in it is important for smooth working of the business.
It is often the case that the IT infrastructure in a data centre grows in a ratherad hoc manner. Whenever a new business need arises (e.g., a new office is opened, a new business application system is added etc.), a number of servers are added to the data centre, without an adequate understanding of the current capacity and utilization of the already available servers. This is often done out of caution (“don’t disturb what is working fine”) and also for technical reasons such as compatibility of software versions. As a result, the workload is often non-uniformly distributed across the servers. Further, the utilization of a server may vary over time within a day, because of the complex and non-uniform temporal patterns of workload arrival. Also, some servers are often dedicated to handle a specific type of workload from a specific source. For example, a server dedicated to handle a cheque related service may remain heavily underutilized for most of the day, except for one hour in the evening when a burst of requests arrives, at which time it is saturated. Analysis of the servers in a data centre with respect to their utilization characteristics is important for effective management -e.g., for reducing costs, improving reliability of business operations and capacity planning. Following business questions need to be answered by analyzing the server performance data in a statistically rigorous manner:
1. Identify servers which are already saturated. 2. Identify servers which are near saturation.
3. Identify servers which exhibitinterestingsaturation patterns. 4. Identify servers which are very under-utilized.
Already saturated servers are prone to crash or can drastically reduce the re-sponse time of business functionality, even with a slight increase in workload, thereby adversely affecting the quality of service. Severely under-utilised servers can be used to host additional functionality (either new or transferred from al-ready saturated servers) thereby improving utilization and reducing operational cots and capital investment costs for adding new infrastructure.
approaches to solve them. Section 3 discusses the case study of a real-life data centre where these techniques were applied. Section 4 discusses related work. Section 5 provides conclusions and points out some further work.
2
Problem Formalization and Solution
Each server is monitored for parameters such as CPU and memory utilization, disk usage, data communication etc. For simplicity, we consider only one aspect of server utilization viz., CPU utilization. Thus there is a univariate time-series for each server, which measures CPU utilization (as a real number between 0% to 100%) at some regular time interval (say every 5 seconds). For servers having multiple CPUs, this number is the average of the utilizations of the individual CPUs in that period. We first formalize the notions of already saturated, near saturation and under-utilized servers, based on the CPU utilization time-series. Throughout the paper, given time-series for a serverS is denoted byXS =< (t1, x1),(t2, x2), . . . ,(tN, xN) > where xi denotes the CPU utilization of S at theithtime instantt
i. For a uniformly sampled time-series, the differenceti+1−
ti is constant. But in practice this difference varies somewhat and for some time instants, the observations may be missing altogether. We pre-process the given time-series using techniques such as imputations and outlier detection and removal, so that the given time-series can be considered uniformly sampled.
Let 0< M <100 be a user-specifiedsaturation level. In generalxi ≥M for saykamong the N values in XS andxi < M for the remainingN −k values. ServerSis said to benear saturationifkis “sufficiently large” i.e., if “sufficiently many” points in XS out of N are aboveM. Next two subsection propose two solutions to formalize this concept.
2.1 Near Saturation: A Simple Approach
A simple approach would classify a server as near saturation if the fraction of the points above the given utilization threshold value M is above some user-specified threshold value 0 < h < 1 i.e., if k/N > h, where k is the number of points aboveM. For example, ifh= 0.25 then a server is near saturation if 25% points in the CPU utilization time-series are above the utilization levelM. While it may be adequate for a high-level view, there are several difficulties with this simple approach. First, automatically determining the correct value for the thresholdhis difficult. The approach totally ignores the temporal nature of the data. For example, a server heavily used for one particular hour every day and lightly loaded for the rest of the day is interesting because any workload increase will likely crash or severely slow down the server in that critical one hour period. Such scenarios are not detected by the simple approach.
2.2 Approach Using Wilcoxson Signed Rank Sum Test
data. We then apply the one-sample Wilcoxson signed rank sum test to the data points in a given window and classify whether the server is near saturation in that window or not. The idea is to examine how many of the points in the given window are above (and below) the given saturation level M. The one-sample Wilcoxson signed rank sum test is positive if the median of the data points in the window is≥M i.e., “close to” 50% points in the window are aboveM.
The one-sample Wilcoxson signed rank sum test is a non-parametric test to check the null hypothesis that the median of the data is equal to the given value M. The test is carried out as follows. Letndenote the number of data points in the given window. First remove all observations which are exactly equal toMand adjustnaccordingly. Compute the signed differencedi =xi−M for each data point in the window. Rank thedis, ignoring the signs (i.e. assign rank 1 to the smallest|di|, rank 2 to the next etc.). For each group having an equal value for 2 or more observations/differences, average the rank between them. For example, suppose we have ranked first 4 data points and suppose the next twodi values are equal; then assign the rank 5.5 to both the observations (average of ranks 5 and 6). Label each rank as + or−, according to the sign ofdi. ComputeW+and W−, the sums of the ranks of the positive and negativedis respectively. Check thatW++
W−= n(n2+1). Assumingn≥20, we use the normal approximation.
ComputeμW = n(n4+1) and σW =
n(n+1)(2n+1)
24 . Reduce the variance by t
3−t
48
for each group of t tied ranks. For example, if there was a group of 2 equal
values, then 2348−2 = 0.125 and the new value is σW =
n(n+1)(2n+1)
24 −0.125.
Computez = W+−μW
σW . Under Normal approximation, z approximately follows the standard normal distribution. Probability (calledp-value) of observing this particular value of z can be obtained from the standard table. If this p-value is less than the given significance level α (typically, α = 0.05), then the null hypothesis is rejected and the server is not near saturation in this window.
The algorithm near saturation accepts the utilization time-series XS of a serverS as input, divides it into a sequence of overlapping windows (each cover-ing a period ofb seconds) using subroutine divide TS, performs the one-sample Wilcoxson signed rank sum test on each window using subroutine OSWSRS test and returns sequenceFS of Boolean flags (near saturation or not) for each win-dow. Later we analyze this sequence to detectinterestingsaturation patterns.
algorithmnear saturation
inputXS // CPU utilization time-series for serverS
inputb// window duration e.g., 60 minutes inputM // saturation limit
inputα// significance level e.g., 0.05
outputWS,FS; // sequence of windows overXS, a Boolean flag for each window inWS
WS = divide TS(XS,b); //WS containsmwindowsm≈N/b
for(i= 0;i < m;i+ +) // do for each window
FS(i) = OSWSRS test(WS(i),M,α); // 1-sample Wilcoxson signed rank sum test
It is possible to use other tests instead of one-sample Wilcoxson signed rank sum test. For example, one could perform a hypothesis test that the fractionpof points aboveM is greater than some fixed constantp0. Wilcoxson test implicitly
usesp0= 0.5. The test statistic for the null hypothesisH0:p=p0 is ( ˆpp−p0)
0(1−p0)
n ,
where ˆpis the observed fraction of points aboveM. This test statistic follows a standard Normal distribution and hence thep-value (probability) of observing that value of the test statistic can be computed using standard tables. The null hypothesis is rejected if thisp-value is less than the required level of significance (e.g., α = 0.05). This flexible approach allows testing whether the fraction of points aboveM is more than any given constant (p0 need not be 0.5).
2.3 Identifying Already Saturated and Under-Utilized Servers
Let 0< MH, ML<100 be a user-specifiedhighandlow saturation levels. Server S is already saturated (under-utilized) if “sufficiently many” points in XS are aboveMH (belowML). Algorithm near saturation can be re-used for identifying a server which is already saturated (under-utilized), by usingMH (ML) instead ofM. For example,ML= 20%, MH = 80%.
2.4 Identifying Servers with Interesting Utilization Patterns
Identification of temporal regularities and other interesting patterns in the CPU utilization of a server is useful from a practical perspective. In this paper, we consider only one such interesting pattern: is the server getting near saturation (or already saturated) at any particular hour of the day for many days? Al-gorithm int pattern1 identifies the time periods which show near saturation on “significantly many” days. The idea is to create a time series which contains all the data points from the original time series which fall in the same period (e.g., 10:00 AM to 11:00 AM every day) but on different days. The algorithm examines this new time series as a whole (without dividing into windows) using the algorithm near saturation. If the time series is declared as near saturation, then clearly, there are many data points aboveM during this particular time period across days. Hence the server is frequently getting near saturation during this particular time period across days.
We re-use algorithm near saturation to divide the CPU utilization time-series XSfor a server into a sequenceWSof non-overlapping windows (each of duration b). Window wi
d in WS refers to the i-th time period in d-th day. We also get a corresponding sequence of Boolean flags FS where flag fi
d is 1 if the server is near saturation in windowwi
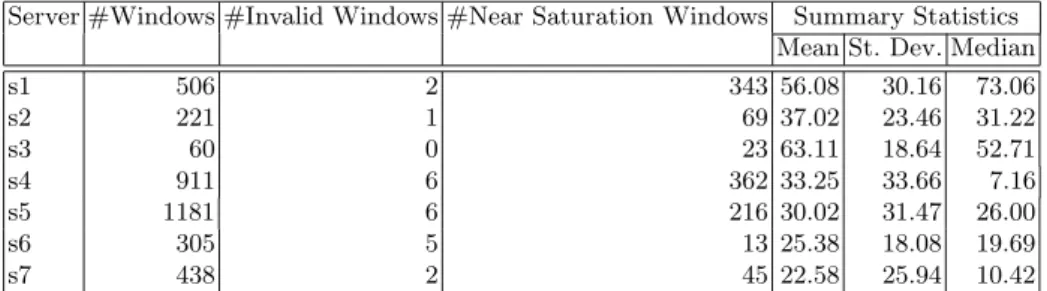
Table 1.Analysis of 7 Servers in a data centre
Server #Windows #Invalid Windows #Near Saturation Windows Summary Statistics Mean St. Dev. Median
s1 506 2 343 56.08 30.16 73.06
s2 221 1 69 37.02 23.46 31.22
s3 60 0 23 63.11 18.64 52.71
s4 911 6 362 33.25 33.66 7.16
s5 1181 6 216 30.02 31.47 26.00
s6 305 5 13 25.38 18.08 19.69
s7 438 2 45 22.58 25.94 10.42
algorithmint pattern1
inputXS // CPU utilization time-series for serverS
inputb// window duration e.g., 60 minutes inputM // saturation limit
inputα// significance level e.g., 0.05
outputWS,FS; // sequence of windows overXS, a Boolean flag for each window inWS
WS, FS = near saturation(XS, b, M, α); for eachtime periodiin a daydo
Yi=wid1•wid2. . .//•denotes concatenation ifOSWSRS test(Yi,M,α) == 1then
print “Near saturation regularity in time periodi” end if
end for
3
Experiments
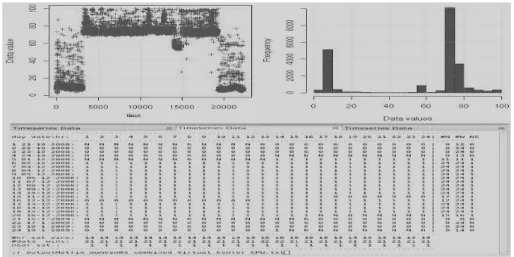
Fig. 1.Time-plot and histogram for CPU utilization of servers1
was near saturation in this period. Wilcoxson test is positive for the set of all data points in these 21 windows taken as a whole. Hences1 is frequently near saturation from 00:00 AM to 01:00 AM on most days.
4
Related Work
Performance monitoring of servers and other resources is a well-developed area. Many tools are available to collect large amounts of performance data. We are focusing onminingthis performance monitoring data to automatically identify opportunities for improving utilization and reducing operational costs of large data centres. A closely related area is that of constructingmodels of the server performance and use them for purposes such as explaining observed performance characteristics, performance forecasting, performance simulations under different workload conditions and identification of bottlenecks. The models are usually analytical [1], structural (e.g., Petri-net based [2]) or statistical (e.g., queuing theoretic [3], [4]; see also [5]). Related to our interesting utilization patterns, [6] proposes a Gini performance coefficient to measure regularity in the performance of a server. As in this paper, the profiling data has been used for various tasks such as capacity planning [7], server consolidation [8], server configuration [9] and performance improvement [10] etc. Unlike most such work, we have not attempted to relate CPU utilization to the workloads.
5
Conclusions and Further Work
for reducing costs, improving reliability of business operations and planning and budgeting for capacity increase. In this paper, we formalized several business questions related to utilization of servers in a data centre: already saturated, near saturation, under-utilized and interesting utilization patterns. We provided algo-rithms that use rigorous statistical techniques to automatically identify servers that satisfy such conditions. We presented the results of using these algorithms for analyzing utilization levels in a real data centre. The techniques are efficient and work well in identifying servers which satisfy any of the utilization condi-tions. Little domain knowledge, statistics expertise or experimentation is needed, so that the end-users (such as data centre engineers and managers) can easily make use of the tool. We are pursuing the following extensions: (a) using multiple aspects of server utilization together; e.g., CPU/memory utilization, disk usage, communication etc.; (b) discovering other interesting patterns of server utiliza-tion; e.g., spikes and their periodicities; (c) dependencies among utilizations of many servers; e.g., when two servers get nearly saturated together.
References
1. Kant, K., Won, Y.: Server Capacity Planning for Web Traffic Workload. IEEE Trans. Knowl. and Data Eng. 11(5), 731–747 (1999)
2. Praphamontripong, U., Gokhale, S., Gokhale, A., Gray, J.: An Analytical Approach to Performance Analysis of an Asynchronous Web Server. Simulation 83(8), 571– 586 (2007)
3. Kant, K., Sundaram, C.R.M.: A Server Performance Model for Static Web Work-loads. In: 2000 IEEE International Symposium on Performance Analysis of Systems and Software (ISPASS 2000), pp. 201–206. IEEE Press, New York (2000)
4. Cao, J., Andersson, M., Nyberg, C., Kihl, M.: Web Server Performance Modeling Using an M/G/1/K*PS Queue. In: 10th International Conference on Telecommu-nications (ICT 2003), pp. 1501–1506 (2003)
5. Hern´andez-Orallo, E., Vila-Carb´o, J.: Web Server Performance Analysis Using His-togram Workload Models. Comput. Netw. 53(15), 2727–2739 (2009)
6. Ling, Y., Chen, S., Lin, X.: On the Performance Regularity of Web Servers. World Wide Web 7(3), 241–258 (2004)
7. Jiang, G., Chen, H., Yoshihira, K.: Profiling Services for Resource Optimization and Capacity Planning in Distributed systems. Cluster Computing 11(4), 313–329 (2008)
8. Spellmann, A., Erickson, K., Reynolds, J.: Server Consolidation Using Performance Modeling. IT Professional 5(5), 31–36 (2003)
9. Arlitt, M., Williamson, C.: Understanding Web Server Configuration Issues. Softw. Pract. Exper. 34(2), 163–186 (2004)