1 2 3 4 5 6 7 8 9 10 11 12 13 14 15 16 17 18 19 20 21 22 23 24 25 26 27 28 29 30 31 32 33 34 35 36 37 38 39 40 41 42 43 44 45 46 47 48 49 50 51 52 53 54 55 56 57
ChemCatChem
Supporting Information
Pd Zn Alloy Nanoparticles Encapsulated into Mesoporous
Silica with Confinement Effect for Highly Selective
Semi-Hydrogenation of Phenylacetylene
Zhenxing Li
+,* Mingliang Hu
+, Bowen Liu, Jiahao Liu, Ping Wang, Jiasai Yao, Xin Zhang,
Miao He, and Weiyu Song*
Wiley VCH Mittwoch, 21.10.2020
Experimental Section
Chemicals:
Na2PdCl4, KI, polyvinylpyrrolidone (PVP) (Mw ~55,000), formamide, acetone,N,N-dimethylformamide, methanol, ethanol, ammonia, Tetraethyl orthosilicate (TEOS, 98%),
hexadecyltrimethylammonium bromide (CTAB), 2-methylimidazole, zinc nitrate hexahydrate.
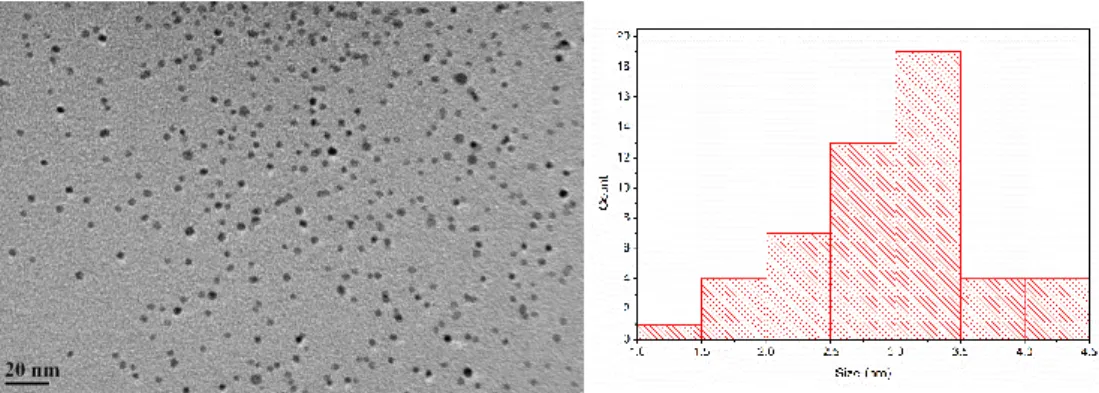
The synthesis of PVP-stabilized Pd-NPs:
We dissolved 34 mg KI and 100 mg PVP (Mw ~55,000) in 10ml formamide and heated the solution at 120 °C. Then, 59 mg Na2PdCl4 powder was added and the temperature was maintained for 10 min with vigorous stirring. After the mixture was cooled down to room temperature, 120 ml acetone was added and the dispersion was collected by centrifugation at 15,000 r.p.m. for 5min. Te obtained Pd nanoparticles were dispersed in 21ml mixed solvent (volume ratio DMF:methanol is 4:1).The synthesis of Pd-NPs@ZIF-8:
1,069 mg Zn(NO3)2·6H2O was dissolved in 15 ml mixed solvent (volume ratio DMF:methanol is 4:1) under ultrasound for 5 min to form a clear solution in flask A. Then 0.5 ml as-prepared Pd nanoparticles dispersed in DMF and methanol solution was added into flask A. 1,161 mg 2-methylimidazole was dissolved in 10ml mixed solvent (DMF:methanol, 4:1.) under ultrasound for 5 min to form a clear solution in flask B. Then, we added the contents of flask B into flask A at room temperature and maintained the temperature for 12 h without stirring. The obtained product was collected by centrifugation at 15,000 r.p.m. for 5 min and washed with methanol three times and finally dried at 70 °C for 5 h.The synthesis of PdZn@MS:
20 mg the obtained Pd NPs@ZIF-8 were dispersed in 8ml deionized water and 20ml ethanol, and then 1ml ammonia and 0.5 g hexadecyl trimethyl ammonium bromide (CTAB) were added to the Pd NPs@ZIF-8 suspension, 50 µl tetraethyl orthosilicate (TEOS) added subsequently until CTAB is completely dissolved, stirred for 12 hours at room temperature. Finally, the white product was obtained after the samples were centrifuged, washed with ethanol three times, and dried at 60 °C in an oven. Next, the dried sample was placed in a porcelain boat and placed in a tube furnace, and calcined at 600 °C for 2 h in a hydrogen atmosphere. Finally, PdZn@MS was obtained.Catalytic test for phenylacetylene hydrogenation:
The selective hydrogenation of phenylacetylene (PA) of the catalysts was tested in a 30 ml pressure bottle with 2.5 mg of the catalyst, 30 mg (0.3 mmol) of PA, and 25 ml ethanol, 1 atm H2 was purged into the sealed reaction kettle with magnetic stirring. The reaction was performed at 100 °C for 2 hours. In control experiment, we replace Pd@MS, pure ZIF-8 as catalysts for experiments. Liquid samples were analyzed by GC (GC 7820A, Agilent Technologies, equipped with a HP5 column and an FID detector). Conversion of phenylacetylene and selectivity to styrene were calculated as follows: Conversion =𝐶𝑓𝑒𝑒𝑑− 𝐶𝑥 𝐶𝑓𝑒𝑒𝑑 × 100% Selectivity = (1 − 𝐶𝑠𝑡𝑦𝑟𝑒𝑛𝑒 𝐶𝑠𝑡𝑦𝑟𝑒𝑛𝑒+ 𝐶𝑒𝑡ℎ𝑦𝑖𝑏𝑒𝑛𝑧𝑒𝑛𝑒 ) × 100%Cfeed is initial concentration of phenylacetylene in the feed. Cx is concentration of phenylacetylene in the
product. Cstyrene and Cethylbenzene is concentration of styrene (ST) and ethylbenzene (EB) in the product.
Catalytic test for 4-nitrophenylacetylene hydrogenation:
The selective hydrogenation of 4-nitrophenylacetylene (4-NPA) of the catalysts was tested in a 30 ml pressure bottle with 2.5 mg of the catalyst, 40 mg (0.27 mmol) of 4-NPA, and 25 ml ethanol, 1atm H2 was purged into the reaction bottle. The reaction was performed at 80 °C for 2 hours. Liquid samples were analyzed by GC (GC 7820A, Agilent Technologies, equipped with a HP-5 column and an FID detector).Catalytic test for diphenylacetylene hydrogenation:
The selective hydrogenation of diphenylacetylene of the catalysts was tested in a 30 ml pressure bottle with 2.5 mg of the catalyst, 54 mg (0.3mmol) of DPA, and 25 ml ethanol, 1 atm H2 was purged into the reaction bottle. The reaction was performed at 80 °C for 3 h. Liquid samples was analyzed by GC (GC 7820A, Agilent Technologies, equipped with a HP5 column and an FID detector).Characterizations:
The scanning electron microscopy (SEM) pictures were obtained through Hitachi SU8010 scanning electron microscopy (SEM, Japan) at 5 kV. The transmission electron microscopy (TEM) were performed on a JEM 2100 LaB6 at an accelerating voltage of 200 kV. The energy-dispersive X-ray spectroscopy (EDS) was recorded on a Hitachi SU8010 scanning electron microscopy under a working voltage of 200 kV. High-resolution transmission electron microscopy (HRTEM) and transmission electron microscopy (TEM) were measured using the Tecnai F20 at 200 kV. The high-angle annular-dark-field scanning transmission electron microscopy (HAADF-STEM) images were recorded by a Titan 80-300 STEM with a probe spherical aberration corrector working at 300 kV. The wide-angle X-ray diffraction (XRD) pattern was collected using the Bruker D8-advance X-ray diffractometer (operating current 40 mA, operating voltage 40 kV) with Cu Kα radiation (λ = 0.15406 nm). Nitrogen sorption isotherms and pore size adsorption curves weredetermined at 77 K with a Micromeritics ASAP 2460 analyzer (USA). Before the measurement, the samples were degassed in a vacuum at 300 °C for 6 hours.
The Brunauer−Emmett−Teller (BET) method was utilized to calculate the specific surface areas. By using the Barrett-Joyner-Halenda (BJH) model and non-local density functional theory (NLDFT), the pore volumes and pore size distributions were derived from the adsorption branches of isotherms. The X-ray photoelectron spectrometers (XPS) were performed at an ion-pumped chamber (evacuated to 2 × 10⁻⁹ Torr of an Escalad5 spectrometer, employing Mg KR radiation (BE) 1253.6 eV). Thermal gravimetric analysis (TGA) was characterized on Mettler Toledo TGA/DSC 3+ thermogravimetric analyzer under argon atmosphere at a heating rate of 5 °C min−1 in the temperature range of 30-800 °C. Raman spectra were collected on a Renishaw in via reflex spectrometer system. FT-IR spectra were collected with a thermo iS50 infrared spectrometer (KBr pellets were prepared) in the range of 400-4000 cm-1. The Pd concentration analysis of the samples were conducted on the inductively coupled plasma atomic emission spectroscopy (ICP-AES). Mass spectra were detected at the gas chromatography-mass spectrometry (GC-MS) with an Agilent 7890B gas chromatograph.
Theoretical and Computational Details:
Calculations were performed using spin-polarized Kohn-Sham density functional theory (DFT). We used the generalized gradient approximation with the Perdew-Burke-Ernzerhof [1] exchange-correlation functional as implemented in the Vienna ab initio simulation package (VASP).The valence orbitals of Pd (4d, 5s), Zn (3d, 4p), C (2s, 2p), and H (1s) were described by plane-wave basis sets with cutoff energies of 400 eV. The Gaussian smearing method with a width of 0.20 eV was used. A unit cell of 1:1 intermetallic PdZn with a space group of P4/mmm was used to model the catalyst structure. Bulk optimization yielded lattice parameters of a =2.93 Å, c=3.37 Å. The PdZn (111) surface was modeled by p(2 × 2) eight-atomic-layer supercells with the bottom four layers fixed, and the vacuum gap was set as 15 Å to avoid the interaction between the periodic images. The Brillouin zone was sampled at (3 × 3 × 1) and the Γ-point for the calculations of PdZn (111) surface. The convergence criteria for the energy and force were set to 10−4 eV and 0.05 eV/Å. For evaluating the energy barriers, all transition states and pathways were computed using the climbing image nudged elastic band (CI-NEB) method.[2] The adsorption energies were calculated according to the equation, Eads = E(adsorbate/substrate) - [E(substrate) + E(adsorbate)], whereE(adsorbate/substrate), E(adsorbate) and E(substrate) are energies of the substrate with the adsorbate, the gas-phase molecule and the clean substrate, respectively. The reaction energy and barrier were calculated by Er = E(FS) - E(IS) and Ea = E(TS) - E(IS), where E(IS), E(FS) and E(TS) are the energies of the corresponding initial state (IS), final state (FS), and transition state (TS), respectively.
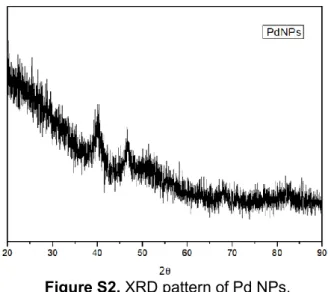
Figure S2. XRD pattern of Pd NPs.
Figure S4. XPS survey of Pd-Zn@MS.
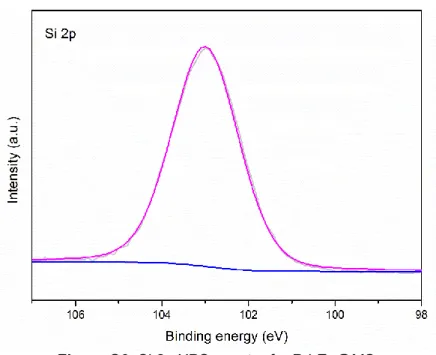
Figure S6. Si 2p XPS spectra for Pd-Zn@MS.
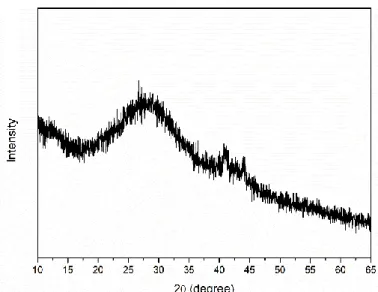
Figure S8. XRD pattern of Pd-Zn@MS after reaction.
[1] J. P. Perdew, K. Burke, M. Ernzerhof, Phys. Rev. Lett.1996, 77, 3865-3868.
[2] aG. Henkelman, B. P. Uberuaga, H. Jónsson, The Journal of Chemical Physics2000, 113, 9901-9904; bG. Henkelman, H.Jónsson, The Journal of Chemical Physics 2000, 113, 9978-9985.