A Spatial and Statistical Analysis of Commuting to Work in the UK: 1991, 2001 and 2011
Thomas Michael Murphy
Submitted in accordance with the requirements of the degree of Doctor in Philosophy
The University of Leeds School of Geography
The candidate confirms that the work submitted is his own and that appropriate credit has been given where reference has been made to the work of others.
This copy has been supplied on the understanding that it is copyright material and that no quotation from the thesis may be published without proper acknowledgement.
Acknowledgements
I would like to thank my Mam, Annette, Dad, Michael, and Brother, Robert, for their unconditional love and support. Completing my PhD, and my previous education, would not have been possible without them.
Much of the credit for this thesis should go to my faultless supervisors, Professor John Stillwell and Doctor Lisa Buckner. Not only have they provided me with untold amounts of help, support and feedback during the course of my research, but they are also responsible for awarding me my Innovations in Quantitative Methods scholarship; allowing me to complete my MSc and PhD degrees in the first place.
I would also like to convey my thanks to Professor Graham Clarke and Doctor Paul Norman for their academic feedback as members of my Research Support Group.
This thesis contains statistical data from the Office for National Statistics which is Crown Copyright.
Abstract
There is a relative lack of academic research related to spatial and sociodemographic variations in commuting propensities, patterns and behaviours. This is surprising given that commuting is carried out, often daily, by the vast majority of individuals in employment. The expenditure of time and money travelling to and from work on a daily basis means that commuting is often a relatively important part of many people’s behaviour, with the nature of an individual’s commute impacting upon their lifestyle, both directly and indirectly.
One of the key sources of information about commuting behaviour and patterns is the population census in the United Kingdom, through which travel to work characteristics are captured resulting in large and complex datasets that are disseminated by the census agencies as aggregate data (i.e. stocks of commuters based on where they live), interaction data (i.e. flows of commuters from where they live to where they work) and microdata (i.e. individual records of commuters).
Spatial and sociodemographic variations in commuting propensities, patterns and behaviours, although often recognised in an everyday sense, have not been the subject of much academic research and are far from fully understood. With this in mind, this research employs spatial and statistical methods on the three aforementioned datasets to analyse spatial and sociodemographic variations in commuting.
Geographical Information Systems have been used to visualise spatial variations in commuting propensities and patterns at both national and regional levels. Simple Linear Regression has been employed to examine the correlations and potential relationships between commuting indicators and important continuous socioeconomic variables. Binary Logistic Regression models have been calculated to demonstrate how commuting behaviours vary according to sex, age group, ethnic group and a host of other important categorical sociodemographic variables.
Amongst other findings, the thesis has found that there was an increase in the national commuting rate between 1991 and 2011, that there was a general increase in very long-distance commuting over the same 20 year period, that there was a general decrease in the prevalence of commuting by public transport between 1991 and 2001 but a general increase between 2001 and 2011 and that substantial changes in commuting propensities and patterns have occurred in the Leeds City Region. The findings from the research have been used to make some recommendations for implementation of policies by national, regional or local governments or any other organisations with a responsibility to supply and maintain transport networks.
Table of Contents
1. Introduction ... 1
1.1 General Introduction: Background and Context ... 1
1.2 Rationale ... 2
1.3 Research Questions ... 4
1.4 Research Aims ... 4
1.5 Research Objectives ... 4
1.6 Spatial and Temporal Scope of Thesis ... 5
1.7 Thesis Structure ... 6
2. Commuting to Work: Definitions, Concepts, Trends and Patterns ... 9
2.1 Introduction ... 9
2.2 Commuting Behaviour: Definitions and Concepts ... 9
2.2.1 Definitions: What is commuting? ... 9
2.2.2 Census questions about commuting ... 12
2.2.3 Other commuting definitions ... 16
2.2.4 Mode of transport, commute distance and homeworking ... 17
2.2.5 The temporal dimension... 20
2.3 Commuting Theory: Explanations and Modelling ... 22
2.3.1 Who commutes to work? ... 22
2.3.2 Why do people commute? Choice or necessity? ... 22
2.3.3 Explaining commuting patterns ... 23
2.3.4 Structure and Agency ... 32
2.3.5 Modelling commuting behaviour ... 33
2.4 Historical and Contemporary Commuting Trends and Patterns ... 37
2.4.1 Historical commuting trends in the UK ... 37
2.4.2 Contemporary spatial commuting patterns in the UK ... 39
2.4.3 Commuting behaviour in other parts of the world ... 40
2.5 Commuting Composition: Sociodemographic Characteristics ... 41
2.5.1 Commuting and personal circumstances: sex, age, ethnicity and health ... 42
2.5.2 Commuting and family circumstances: caring responsibilities and childcare ... 45
2.5.3 Commuting and labour market engagement: occupation, qualifications, employment type and employment sector ... 46
2.5.4 Intersectionality ... 48
2.6 Commuting and the Definition of Local Labour Market Areas ... 49
2.7 UK Transport Policy ... 51
2.8 Conclusions ... 54
3. Data Sources, Spatial Frameworks and Methods ... 57
3.2 Data Sources ... 57
3.2.1 The aggregate data ... 59
3.2.2 The interaction data ... 60
3.2.3 The microdata ... 65
3.2.4 Homeworking data issues ... 68
3.2.5 Alternative data... 71
3.3 Defining Commuting Indicators ... 77
3.3.1 Commuting numerators: The commuters ... 77
3.3.2 Commuting denominators: The population at risk ... 79
3.4 Spatial Frameworks ... 81
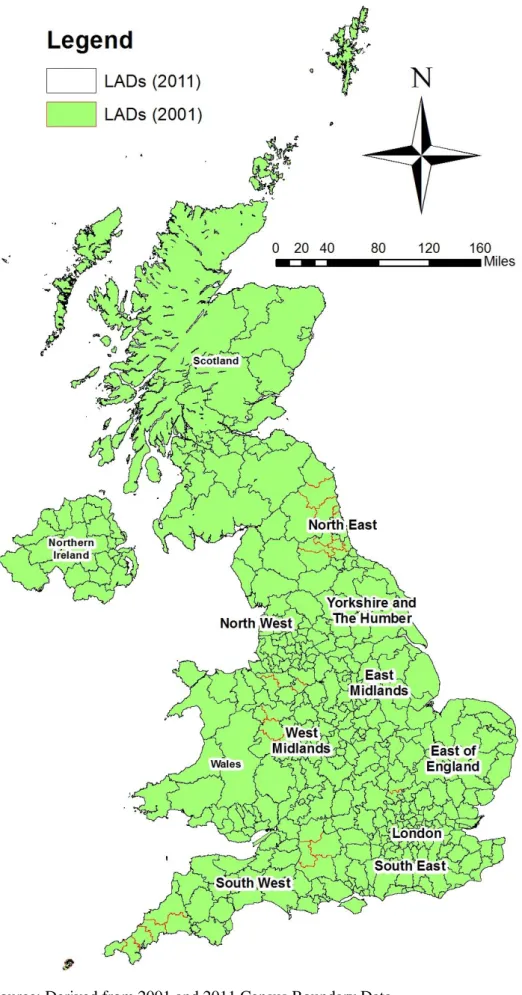
3.4.1 Regions and LADs in the UK ... 83
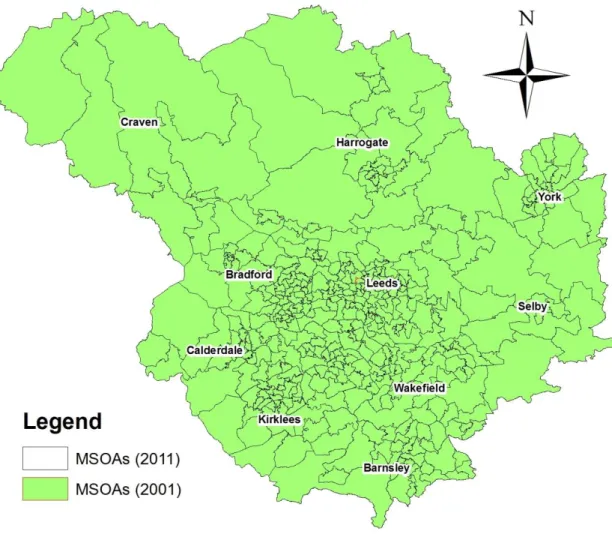
3.4.2 LADs and MSOAs in the Leeds City Region ... 85
3.4.3 MSOAs and OAs in the Leeds LAD ... 87
3.4.4 MSOAs and WPZs in the Leeds LAD ... 89
3.4.5 Alternative spatial frameworks ... 90
3.5 Methods and Methodological Approaches ... 92
3.5.1 Spatial analyses... 93
3.5.2 Statistical analyses ... 93
3.6 Conclusions ... 105
4. Spatial, Sociodemographic and Temporal Commuting Patterns: Local Authority Variations ... 107
4.1 Introduction ... 107
4.2 Commuting in England and Wales ... 108
4.2.1 Regional variations in commuting ... 109
4.2.2 LAD variations in commuting ... 110
4.2.3 Sociodemographic variations in commuting ... 119
4.3 Travel to Work in England and Wales ... 124
4.3.1 Sociodemographic variations in travel to work ... 126
4.3.2 Modelling travel to work ... 127
4.3.3 LAD variations in travel to work ... 130
4.4 Working At or From Home in England and Wales ... 131
4.4.1 Sociodemographic variations in homeworking ... 132
4.4.2 Modelling homeworking ... 134
4.4.3 LAD variations in homeworking ... 136
4.4.4 Working at home and working from home ... 137
4.5 Spatial and Temporal Variations in Modal Split in England and Wales ... 139
4.5.2 LAD variations in road transport ... 144
4.5.3 LAD variations in cycling and walking ... 149
4.6 Policy Implications and Conclusions ... 152
5. A National and Regional Analysis of Sociodemographic Variations and Temporal Changes in Commute Distance and Self-Containment ... 155
5.1 Introduction ... 155
5.2 Sociodemographic Variations in Commute Distance ... 156
5.2.1 Introduction: sociodemographics and commute distance ... 157
5.2.2 Changing commute distances between 1991, 2001 and 2011 ... 158
5.2.3 Changes in very long-distance commuting ... 165
5.2.4 Modelling very long-distance commuting ... 169
5.2.5 Commute distance interaction effects ... 175
5.3 Sociodemographic and Spatial Variations in Commuting Self-containment ... 179
5.3.1 Introduction: commute distance and self-containment ... 180
5.3.2 Changing self-containment between 1991, 2001 and 2011 ... 180
5.3.3 Changes in commuting self-containment ... 181
5.3.4 Modelling commuting self-containment ... 186
5.3.5 Spatial variations in commuting self-containment ... 189
5.4 Policy Implications and Conclusions ... 191
6. A National and Regional Analysis of Sociodemographic Variations and Temporal Changes in Commuters’ Mode of Travel... 193
6.1 Introduction ... 193
6.2 Sociodemographic and Spatial Variations in Modal Split ... 194
6.2.1 Introduction: sociodemographics and mode of transport ... 195
6.2.2 Changing modes of transport between 1991, 2001 and 2011 ... 195
6.2.3 Changing public transport usage ... 203
6.2.4 Modelling the use of public transport ... 209
6.2.5 Mode of transport interaction effects ... 213
6.2.6 Spatial variations in commuting by public transport ... 217
6.3 Policy Implications and Conclusions ... 219
7. Changing Commuting Propensities, Patterns and Behaviours in the Leeds City Region ... 221
7.1 Introduction ... 221
7.2 The Leeds City Region as a TTWA ... 223
7.3 Out-commuting, In-commuting and Commuting Self-containment in the Leeds City Region ... 227
7.3.1 MSOA variations in out-commuting ... 227
7.3.2 MSOA variations in commuting self-containment ... 230
7.4 Commuting in the Leeds City Region ... 237
7.4.1 Sociodemographic variations in commuting ... 237
7.4.2 LAD variations in commuting ... 239
7.4.3 MSOA variations in commuting ... 241
7.4.4 MSOA variations in travel to work ... 243
7.4.5 MSOA variations in homeworking ... 244
7.5 The Urban-Rural Divide in Commuting ... 246
7.6 Spatial and Temporal Variations in Modal Split in the Leeds City Region ... 247
7.6.1 MSOA variations in rail transport ... 249
7.6.2 MSOA variations in road transport... 251
7.6.3 MSOA variations in cycling and walking ... 254
7.7 Commuting Using Public Transport in the Leeds City Region ... 257
7.7.1 Changes in commuting using public transport between 1991 and 2011 ... 257
7.7.2 Sociodemographic variations in commuting using public transport ... 258
7.7.3 Modelling public transport usage ... 262
7.7.4 MSOA variations in public transport usage... 265
7.8 The Urban-Rural Divide in Mode of Transport ... 267
7.9 Policy Implications and Conclusions ... 267
8. Summary, Evaluation and Conclusions ... 270
8.1 Introduction ... 270
8.2 Summary of Research Findings and Policy Implications ... 271
8.3 Research Limitations and Future Potential ... 277
8.3.1 Data ... 277
8.3.2 Spatial frameworks ... 280
8.3.3 Methods ... 281
8.4 Recommendations for Future Work ... 283
8.5 Concluding Remark ... 285
i. List of Tables
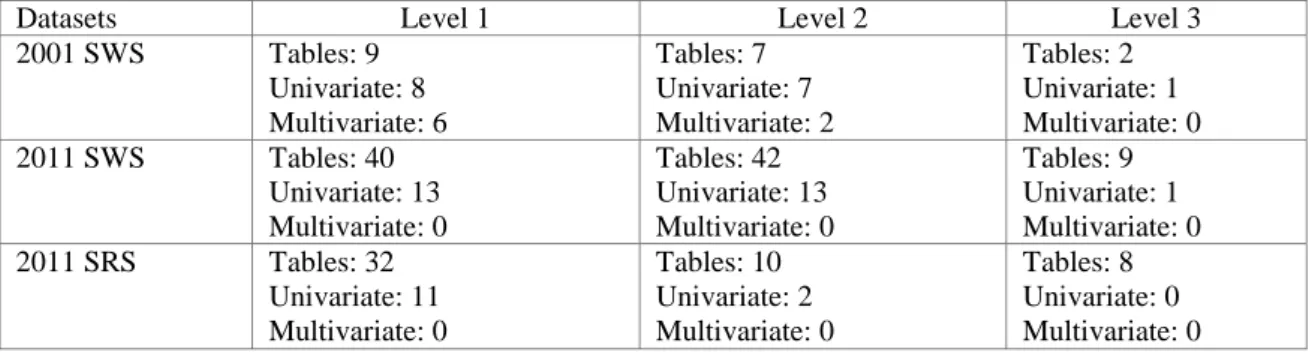
Table 3.1: Table, univariate and multivariate variable counts for the 2001 and 2011 SWS and the 2011 SRS by geographical output level
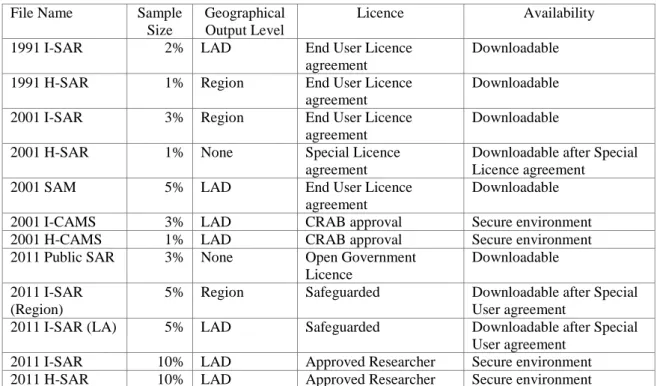
Table 3.2: Size, coverage and availability of 1991, 2001 and 2011 census microdata
Table 3.3: Definitions of homeworkers from different census datasets in 1991, 2001 and 2011
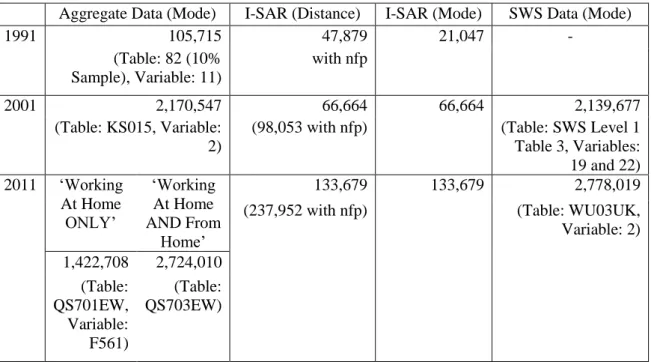
Table 3.4: Number of homeworkers in England and Wales aged 16-74 from different census datasets in 1991, 2001 and 2011
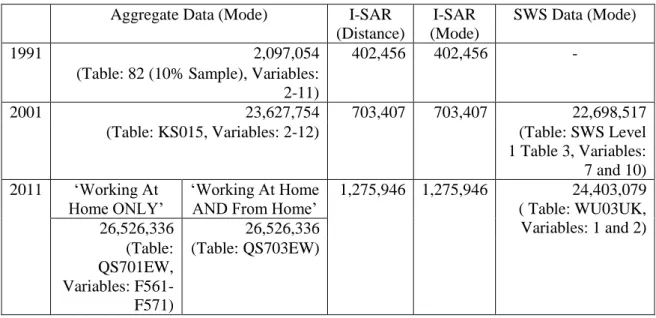
Table 3.5: Number of commuters in England and Wales aged 16-74 from different census datasets in 1991, 2001 and 2011
Table 3.6: Percentage of homeworkers in England and Wales aged 16-74 from different census datasets in 1991, 2001 and 2011
Table 3.7: Different PAR numbers for the Yorkshire and The Humber region in 2001 and 2011
Table 3.8: Different commuting rates for the Yorkshire and The Humber region using different PARs in 2001 and 2011
Table 3.9: UK LADs, MSOAs and OAs in 2001 and 2011
Table 3.10: 2009 structural changes to English local government
Table 4.1: Commuting numbers and rates for all individuals (including homeworkers) in England and Wales aged 16-74 in 2001 and 2011 and the percentage point changes between 2001 and 2011 by sex, age group, ethnic group, LLTI and dependent children (see Chapter 2 for variable choice justification)
Table 4.2: Commuting numbers and rates for all individuals (including homeworkers) in the regions of England and Wales aged 16-74 in 2001 and 2011 and the percentage point changes between 2001 and 2011 by region
Table 4.3: Highest and lowest rates of commuting, economic activity, employment and working age population in 2011 by LAD
Table 4.4: Largest rates of change in commuting, economic activity, employment and working age population between 2001 and 2011 by LAD
Table 4.5: Travel to work numbers and rates for all individuals (excluding homeworkers) in England and Wales aged 16-74 in 2001 and 2011 and the percentage point changes between 2001 and 2011 by region
Table 4.6: Percentages and percentage point changes in travelling to work for all individuals (excluding homeworkers) in England and Wales aged 16-74 in 2001 and 2011 by sociodemographic and geographic characteristics
Table 4.7: BLR model results for individuals travelling to work for all individuals (excluding homeworkers) in England and Wales aged 16-74 in 2001 and 2011 by sociodemographic and geographic characteristics
Table 4.8: Homeworking numbers and rates for all commuters in England and Wales aged 16-74 in 2001 and 2011 and the percentage point changes between 2001 and 2011 by region
Table 4.9: Percentages and percentage point changes in commuters working at or from home for all commuters in England and Wales aged 16-74 in 2001 and 2011 by sociodemographic and geographic characteristics
Table 4.10: BLR model results for commuters working at or from home for all commuters in England and Wales aged 16-74 in 2001 and 2011 by sociodemographic and geographic characteristics
Table 5.1: Percentage of commuters in each distance band by sociodemographic and geographic characteristics for all commuters (excluding homeworkers) in England and Wales aged 16-74 in 2011 (base table)
Table 5.2: Percentage point changes in the percentage of commuters in each distance band by sociodemographic and geographic characteristics for all commuters (excluding homeworkers) in England and Wales aged 16-74, 1991-2001
Table 5.3: Percentage point changes in the percentage of commuters in each distance band by sociodemographic and geographic characteristics for all commuters (excluding homeworkers) in England and Wales aged 16-74, 2001-2011
Table 5.4: Percentages and percentage point changes in very long commutes (≥40km) by sociodemographic and geographic characteristics for all commuters (excluding homeworkers) in England and Wales aged 16-74, 1991, 2001 and 2011
Table 5.5: BLR model results for commuters with very long commutes (≥40km) by sociodemographic and geographic characteristics for all commuters (excluding homeworkers) in England and Wales aged 16-74 in 1991, 2001 and 2011
Table 5.7: PEs and IEs results from BLR model for commuters with very long commutes (≥40km) by sex, occupation and mode of transport for all commuters (excluding homeworkers) in England and Wales aged 16-74 in 1991, 2001 and 2011 (Reference Categories: Male, Professional and Managerial and Bus)
Table 5.8: Variations in commute distance and commuting self-containment for all commuters (excluding homeworkers) in England and Wales aged 16-74 in 1991 and 2011
Table 5.9: Percentages and percentage point changes in commuters commuting inside their LAD of residence by sociodemographic and geographic characteristics for all commuters (excluding homeworkers) in England and Wales aged 16-74 in 1991, 2001 and 2011
Table 5.10: BLR model results for commuters commuting inside their LAD of residence by sociodemographic and geographic characteristics for all commuters (excluding homeworkers) in England and Wales aged 16-74 in 1991, 2001 and 2011
Table 6.1: Mode of transport numbers and rates for all commuters (excluding homeworkers) in England and Wales aged 16-74 in 2001 and 2011 and the percentage point changes between 2001 and 2011
Table 6.2: Percentage of commuters using each mode of transport by sociodemographic and geographic characteristics for all commuters (excluding homeworkers) in England and Wales aged 16-74 in 2011 (base table)
Table 6.3: Percentage point changes in the percentage of commuters using each mode of transport by sociodemographic and geographic characteristics for all commuters (excluding homeworkers) in England and Wales aged 16-74, 1991-2001
Table 6.4: Percentage point changes in the percentage of commuters using each mode of transport by sociodemographic and geographic characteristics for all commuters (excluding homeworkers) in England and Wales aged 16-74, 2001-2011
Table 6.5: Percentages and percentage point changes in commuting using public transport by sociodemographic and geographic characteristics for all commuters (excluding homeworkers) in England and Wales aged 16-74, 1991, 2001 and 2011
Table 6.6: BLR model results for commuters commuting using public transport by sociodemographic and geographic characteristics for all commuters (excluding homeworkers) in England and Wales aged 16-74 in 1991, 2001 and 2011
Table 6.8: PEs and IEs results from BLR model for commuters commuting using public transport by ethnic group, region of usual residence and commute distance for all commuters (excluding homeworkers) in England and Wales aged 16-74 in 1991, 2001 and 2011 (Reference Categories: White, Rest of England and Wales and Short Distance)
Table 6.9: BME and total populations in England and Greater London in 2011
Table 7.1: Sociodemographic variables available for census interaction data in 2001 and 2011 SWS at different spatial scales
Table 7.2: Numbers and rates for commuters (including homeworkers) within and out of the LCR aged 16-74/16+ in 2001 and 2011 and the percentage point changes between 2001 and 2011 by sex, age and LAD of residence
Table 7.3: Commuting numbers and rates for all individuals (including homeworkers) in the LCR (excluding Craven LAD) aged 16-74 in 2001 and 2011 and the percentage point changes between 2001 and 2011 by sex, age group, ethnic group, LLTI and dependent children
Table 7.4: Commuting numbers and rates for all individuals (including homeworkers) in the LCR aged 16-74 in 2001 and 2011 and the percentage point changes between 2001 and 2011 by LAD
Table 7.5: LCR MSOA commuting rates by the 2011 urban-rural classification
Table 7.6: Percentages and percentage point changes in commuting using public transport by sociodemographic and geographic characteristics for all commuters (excluding homeworkers) in the LCR (excluding Craven LAD) aged 16-74 in 1991, 2001 and 2011
Table 7.7: BLR model results for commuters commuting using public transport by sociodemographic and geographic characteristics for all commuters (excluding homeworkers) in the LCR (excluding Craven LAD) aged 16-74 in 1991, 2001 and 2011
ii. List of Figures
Figure 3.1: LAD boundaries within the regions of the UK in 2001 and 2011
Figure 3.2: MSOA boundaries within the LADs of the LCR in 2001 and 2011
Figure 3.3: OA boundaries within the MSOAs of Leeds LAD in 2001 and 2011
Figure 3.4: WPZs within the MSOAs of Leeds LAD in 2011
Figure 4.1: Commuting rates for all individuals (including homeworkers) in England and Wales aged 16-74 in 2011 (A) and the percentage point changes between 2001 and 2011 (B) by LAD
Figure 4.2 Economic activity rates for all individuals in England and Wales aged 16-74 in 2011 (A) and the percentage point changes between 2001 and 2011 (B) by LAD
Figure 4.3: Employment rates for all individuals in England and Wales aged 16-74 in 2011 (A) and the percentage point changes between 2001 and 2011 (B) by LAD
Figure 4.4: Percentage of individuals in England and Wales of working-age (16-64) in 2011 (A) and the percentage point changes between 2001 and 2011 (B) by LAD
Figure 4.5: Commuting rates for male (A) and female (c) commuters (including homeworkers) in England and Wales aged 16-74 in 2011 and the percentage point changes between 2001 and 2011 (B and D) by LAD
Figure 4.6: Commuting rates for ‘younger’ (16-24) (A) and ‘older’ (65-74) (C) commuters (including homeworkers) in England and Wales in 2011 and the percentage point changes between 2001 and 2011 (B and D) by LAD
Figure 4.7: Percentage of individuals (excluding homeworkers) who travel to work in England and Wales aged 16-74 in 2001 and 2011
Figure 4.8: Travel to work rates for all individuals (excluding homeworkers) in England and Wales aged 16-74 in 2011 (A) and the percentage point changes between 2001 and 2011 (B) by LAD
Figure 4.9: Percentage of commuters who work at or from home in England and Wales aged 16-74 in 2001 and 2011
Figure 4.10: Percentage of commuters in England and Wales aged 16-74 in 2011 that work at or from home (A) and the percentage point changes between 2001 and 2011 (B) by LAD
Figure 4.11: Percentage of commuters in England and Wales aged 16-74 in 2011 that work at home (A) and work from home (B) by LAD
Figure 4.12: Commuting modal split in England and Wales in 2001 and 2011 for all commuters (excluding homeworkers) aged 16-74
Figure 4.13: Percentage of commuters (excluding homeworkers) in England and Wales aged 16-74 in 2011 that commute to work by underground, metro, light rail or tram (U, M, LR or T) (A) and train (C) and the percentage point changes between 2001 and 2011 (B and D) by LAD
Figure 4.14: Percentage of commuters (excluding homeworkers) in England and Wales aged 16-74 in 2011 that commute to work by bus, minibus or coach (B, M or C) (A) and by driving a car or van (Driving C or V) (C) and the percentage point changes between 2001 and 2011 (B and D) by LAD
Figure 4.15: Percentage of commuters (excluding homeworkers) in England and Wales aged 16-74 in 2011 that commute to work as a passenger in a car or van (A) and the percentage point changes between 2001 and 2011 (B) by LAD
Figure 4.16: Percentage of commuters (excluding homeworkers) in England and Wales aged 16-74 in 2011 that commute to work by bicycle (A) and on foot (C) and the percentage point changes between 2001 and 2011 (B and D) by LAD
Figure 5.1: Percentage of commuters (excluding homeworkers) in England and Wales aged 16-74 in each commute distance band in 1991, 2001 and 2011
Figure 5.2: Percentage point changes in very long (≥40km) commutes by sociodemographic and geographic characteristics for all commuters (excluding homeworkers) in England and Wales aged 16-74, 1991-2011
Figure 5.3: Probabilities of commuters commuting very long-distance (≥40km) by sex, occupation and mode of transport for all commuters (excluding homeworkers) in England and Wales aged 16-74 in 2011
Figure 5.4: Changes in probabilities of commuters commuting very long-distance (≥40km) between 1991 and 2011 by sex, occupation and mode of transport for all commuters (excluding homeworkers) in England and Wales aged 16-74
Figure 5.5: Percentage of commuters (excluding homeworkers) who commute inside/outside their LAD of residence in England and Wales aged 16-74 in 1991, 2001 and 2011
Figure 5.6: Percentage point changes in commuters commuting inside their LAD of residence by sociodemographic and geographic characteristics for all commuters (excluding homeworkers) in England and Wales aged 16-74, 1991-2011
Figure 5.8: Percentage of commuters (excluding homeworkers) in England and Wales aged 16-74 in 2011 that commute inside their LAD of residence (A) and the percentage point changes between 2001 and 2011 (B) by LAD
Figure 6.1: Percentage of commuters (excluding homeworkers) in England and Wales aged 16-74 using each mode of transport in 1991, 2001 and 2011
Figure 6.2: Percentage point changes in commuters using public transport by sociodemographic and geographic characteristics for all commuters (excluding homeworkers) in England and Wales aged 16-74, 1991-2011
Figure 6.3: Probabilities of commuters using public transport by ethnic group, region of usual residence and commute distance for all commuters (excluding homeworkers) in England and Wales aged 16-74 in 1991, 2001 and 2011
Figure 6.4: Percentage of commuters (excluding homeworkers) in England and Wales aged 16-74 in 2011 that commute to work by public transport (A) and the percentage point changes between 2001 and 2011 (B) by LAD
Figure 7.1: Number of commuters (excluding homeworkers) in the LCR aged 16+ in 2011 that commute out of each MSOA (A) and the changes between 2001 and 2011 (B) by MSOA
Figure 7.2: Percentage of commuters (excluding homeworkers) in the LCR aged 16+ in 2011 that commute out of each MSOA (A) and the percentage point changes between 2001 and 2011 (B) by MSOA
Figure 7.3: Number of commuters (excluding homeworkers) in the LCR aged 16+ in 2011 that commute within each MSOA (A) and the changes between 2001 and 2011 (B) by MSOA
Figure 7.4: Percentage of commuters (excluding homeworkers) in the LCR aged 16+ in 2011 that commute within each MSOA (A) and the percentage point changes between 2001 and 2011 (B) by MSOA
Figure 7.5: Number of commuters (excluding homeworkers) in the LCR aged 16+ in 2011 that commute into each MSOA (A) and the changes between 2001 and 2011 (B) by MSOA
Figure 7.6: Number of commuters (excluding homeworkers) in the LCR aged 16+ in 2011 that commute into each MSOA as a percentage of commuters in that MSOA (A) and the percentage point changes between 2001 and 2011 (B) by MSOA
Figure 7.7: Commuting rates for all individuals (including homeworkers) in the LCR aged 16-74 in 2011 (A) and the percentage point changes between 2001 and 2011 (B) by MSOA
Figure 7.8: Commuting rates for all individuals (excluding homeworkers) in the LCR aged 16-74 in 2011 (A) and the percentage point changes between 2001 and 2011 (B) by MSOA
Figure 7.9: Percentage of commuters in the LCR aged 16-74 in 2011 that work at or from home (A) and the percentage point changes between 2001 and 2011 (B) by MSOA
Figure 7.10: The 2011 urban-rural classification in the LCR by MSOA
Figure 7.11: Commuting modal split in the LCR in 2001 and 2011 for all commuters (excluding homeworkers) aged 16-74
Figure 7.12: Percentage of commuters (excluding homeworkers) in the LCR aged 16-74 in 2011 that commute to work by train (A) and the percentage point changes between 2001 and 2011 (B) by MSOA
Figure 7.13: Percentage of commuters (excluding homeworkers) in the LCR aged 16-74 in 2011 that commute to work by bus, minibus or coach (B, M or C) (A) and by driving a car or van (Driving C or V) (C) and the percentage point changes between 2001 and 2011 (B and D) by MSOA
Figure 7.14: Percentage of commuters (excluding homeworkers) in the LCR aged 16-74 in 2011 that commute to work as a passenger in a car or van (A) and the percentage point changes between 2001 and 2011 (B) by MSOA
Figure 7.15: Percentage of commuters (excluding homeworkers) in the LCR aged 16-74 in 2011 that commute to work by bicycle (A) and on foot (C) and the percentage point changes between 2001 and 2011 (B and D) by MSOA
Figure 7.16: Percentage of commuters (excluding homeworkers) in the LCR (excluding Craven LAD) aged 16-74 who commute using public transport in 1991, 2001 and 2011
Figure 7.17: Percentage point changes in commuters commuting using public transport by sociodemographic and geographic characteristics for all commuters (excluding homeworkers) in the LCR aged 16-74, 1991-2011
Figure 7.18: Percentage of commuters (excluding homeworkers) in the LCR aged 16-74 in 2011 that commute to work using public transport (A) and the percentage point changes between 2001 and 2011 (B) by MSOA
iii. List of Abbreviations
BLR – Binary Logistic Regression BME – Black and Minority Ethnic CA – Council Area
CAS – Census Area Statistics CBD – Central Business District
CeLSIUS – Centre for Longitudinal Study Information and User Support CRAB – Census Research Access Board
EF – Ecological Fallacy
GDP – Gross Domestic Product
GROS – General Register Office for Scotland
H-CAMS – Household Controlled Access Microdata Samples H-SAR – Household Sample of Anonymised Records
I-CAMS – Individual Controlled Access Microdata Samples IE – Interaction Effect
I-SAR – Individual Sample of Anonymised Records ITA – Integrated Transport Authority
LAD – Local Authority District LAU – Local Administrative Unit LB – London Borough
LCR – Leeds City Region
LEA – Local Education Authority LGD – Local Government District LLMA – Local Labour Market Area LLTI – Limiting Long-Term Illness LS – Longitudinal Study
LSCS – Longitudinal Studies Centre – Scotland LSOA – Lower layer Super Output Area
LUZ – Larger Urban Zone
MAUP – Modifiable Areal Unit Problem MD – Metropolitan District
MSOA – Middle layer Super Output Area
NILS-RSU – Northern Ireland Longitudinal Study Research Support Unit NISRA – Northern Ireland Statistics and Research Agency
NMD – Non-Metropolitan District NRS – National Records of Scotland NSA – National Statistical Agency NTS – National Transport Survey
OA – Output Area
ONS – Office for National Statistics
OPCS – Office of Population Censuses and Surveys OR – Odds Ratio
PAR – Population At Risk PAYD – Pay As You Drive PE – Primary Effect
PLASC – Pupil Level Annual School Census PTA – Passenger Transport Authority
PTALs – Public Transport Accessibility Levels PTE – Passenger Transport Executive
SAM – Small Area Microdata
SAR – Samples of Anonymised Records SCAM – Small Cell Adjustment Method SDC – Statistical Disclosure Control SLR – Simple Linear Regression SMS – Special Migration Statistics SOA – Super Output Area
SRS – Second Residence Statistics SSS – Special Student Statistics ST – Standard Table
STS – Special Travel Statistics SWS – Special Workplace Statistics TfL – Transport for London
TTWA – Travel To Work Area UA – Unitary Authority UK – United Kingdom
UKDS – United Kingdom Data Service
WICID – Web-Based Interface for Census Interaction Data WPZ – Work Place Zone
1. Introduction
1.1 General Introduction: Background and Context
Commuting to work is an activity that is carried out relatively frequently, often daily, by individuals who are self-employed or in employment. It is, therefore, a relatively important part of many people’s lives, with the nature of an individual’s commute having an impact upon their behaviour, both directly and indirectly. Commuting to work is the movement of an individual from their place of residence to their workplace and back again. Homeworkers and people with no fixed workplaces are also classed as commuters by the Office for National Statistics (ONS), as both still have a place of residence and a workplace, albeit with individuals in the former category having both in the same approximate location, and individuals in the latter category having multiple workplaces.
Although the core concept of commuting is that of a routine activity, commuting to work often takes varying forms, occurs in diverse ways, and differs by inter-related sociodemographic and geographic factors. It is these sociodemographic and geographic variations in commuting propensities, patterns and behaviours that this research attempts to identify, analyse and understand.
Commuting plays an important role in modern economies, such as the United Kingdom (UK). At the macroeconomic level commuting can, through the daily movement of people for economic purposes, have an impact on levels of national, regional and local employment, unemployment, economic productivity and output (Owen, 2012). At the microeconomic level, individual commuting behaviour can have sizeable impacts on household activities, disposable income and spending power (BBC, 2012i).
In the USA, the economic turmoil following the 2008 global financial crisis has given rise to so-called ‘extreme commuters’ (USA Today, 2012); those people spending more time travelling than they do at work. This trend and the apparent link between commuting behaviour and economic well-being, with people travelling further in order to reap greater financial rewards, is disturbing when one learns that commuting is the daily activity that has the least positive effect on people’s lives (Kahneman et al., 2004). It is also problematic from a public health or well-being perspective as many individuals may be ‘forced’ to commute long distances in order to maintain or improve their family’s economic situation but, in doing so, may be sacrificing their own well-being and quality of life (Stutzer and Frey, 2008; Novaco et al., 1990).
Whilst the problems associated with commuting are often seen as issues that only pertain to the developed world, this is by no means the case; with major traffic congestion and associated atmospheric pollution problems now affecting cities in many less developed and developing
countries (BBC, 2012ii, 2012iii). Mass commuting is therefore a global phenomenon and the global experience of commuting-related problems means that the improvement of transport networks is now no longer the reserve of wealthy western countries (BBC, 2012iv).
Commuting often makes headlines in the popular press. In 2001, there were nearly 26 million cars on the road in the UK, with 62% of workers in the UK travelling to work by car (BBC, 2003). In addition, in 2001, the mean number of cars per household in England and Wales was 1.1, while in 2011 the average had increased to 1.2 cars per household (The Guardian, 2012i). Although this increase in cars per household may not appear particularly large, this increase took place at the same time as the largest ten year rise in population recorded in England and Wales in recent decades, with the population increasing by 7% from 52.4 million in 2001 to 56.1 million in 2011 (ONS, 2012ix). The number of households in the UK grew equally fast over the same period, at 7%, to reach 26.3 million in 2011 (ONS, 2012x). When these population and household growth figures are taken into consideration, the slight increase in the number of cars per household over the inter-censal period begins to look more concerning as these figures suggest that there were 5 million more cars in the UK in 2011 than there were in 2001.
As the 2001 Census indicates, there were 24.2 million daily commuters in the UK, with the region of Greater London at the centre of this dense network (Gargiulo et al., 2012); in 2007, 23.8 million trips were made within, to and from Greater London every day on average (Transport for London, 2009). A substantial number of these trips will have been commutes, with London drawing commuters from all over southern England and from further afield. Birmingham, Bristol, Cardiff, Leeds, Manchester and Newcastle, as important regional centres (Tickell, 1993; 1996), are also key commuting nodes in England and Wales. Glasgow and Edinburgh are by far the most important cities in Scotland in terms of Gross Domestic Product (GDP) and commuting; Greater Glasgow alone accounts for over a fifth of Scotland’s population (World Population Review, 2012) and Edinburgh is a key financial and political centre (Turok and Bailey, 2004), making them Scotland’s regional centres and commuting nodes. Despite the importance of regional cities to the UK economy, and their extensive commuting patterns, the basis of their relatively recent revitalisation has been questioned, with Dutton (2003) suggesting that the economic resurgence of the UK’s regional cities may have had more to do with the growing spatial influence of London than with actual improvements in the cities themselves.
1.2 Rationale
The importance of commuting in the UK in the 21st century means that analysis of commuting propensities, patterns and behaviours is required both from an academic perspective, in order to understand the processes, and from a practical perspective, in order to formulate evidence-based
policy, as was called for by Adrian Smith in his 1996 presidential address to the Royal Statistical Society (Smith, 1996).
As detailed in Chapter 2, there is a relative paucity of past research addressing spatial and sociodemographic variations in commuting patterns across England and Wales, including variations in commuting rates, homeworking rates, commute distance, mode of transport and commuting self-containment. In addition, there is a shortage of past research addressing spatial and sociodemographic variations in commuting patterns at a fine spatial scale within a functional city region. Finally, given the scarcity of quantitative and qualitative research on commuting, there is also a relatively small amount of literature dealing with the national, regional and local policy implications of contemporary spatial and sociodemographic variations in commuting propensities, patterns and behaviours.
Given the limitations and deficiencies of past research, the research begins by considering how commuting patterns vary at Local Authority District (LAD) level across England and Wales in order to understand the geography of commuting. This involves examining overall commuting rates and modal splits. We then consider variations in commuting behaviour and patterns across a range of sociodemographic variables, including sex, age and ethnicity at national level. This involves examining sociodemographic variations in commute distance, commuting self-containment and public transport usage. Finally, we consider commuting propensities, patterns and behaviours in the Leeds City Region (LCR), with the spatial analysis at Middle Layer Super Output Area (MSOA) level, in order to understand spatial and sociodemographic variations in commuting within a functional city region.
In addition to the above rationale based on past research, the relatively recent availability of commuting data from the 2011 Census enables analysis of changes in spatial patterns of commuting in England and Wales between 2001 and 2011, sociodemographic commuting composition in England and Wales between 1991, 2001 and 2011, spatial and sociodemographic characteristics of travel to work and homeworking between 2001 and 2011 and spatial and sociodemographic characteristics of commuting in the LCR between 2001 and 2011.
The research reported in this thesis therefore seeks both to build upon previous research and to address the current gaps in the literature, while taking advantage of the new and important opportunities generated by the release of UK commuting data from the 2011 Census.
1.3 Research Questions
Given the above rationale, the research attempts to answer the following main research questions:
What variations exist in commuting propensities and patterns in England and Wales, both spatially and between sociodemographic groups, and how did they change between 2001 and 2011?
How do commute distance and commuting self-containment vary between different sociodemographic groups and how did these variations change between 1991, 2001 and 2011?
How does mode of transport vary between different sociodemographic groups and how did these variations change between 1991 and 2011?
How do commuting propensities and patterns vary spatially and sociodemographically in the LCR and how did they change between 2001 and 2011?
What are the policy implications of the variations in and dynamics of commuting propensities, patterns and behaviours as shown by the analyses of the preceding questions?
1.4 Research Aims
In order to address the main research questions, the research is based on the following aims:
To review the relevant research, data and methods.
To analyse spatial and sociodemographic variations in commuting propensities, patterns and behaviours across England and Wales.
To focus in more detail on analysis of commuting propensities, patterns and behaviours in the LCR.
To present some policy recommendations based on the analyses.
1.5 Research Objectives
In order to fulfil the broad aims, the research is designed to achieve the following objectives:
Review relevant extant academic literature and research on commuting in the UK.
Outline and evaluate the data and spatial frameworks appropriate for the research.
Outline and evaluate the methods appropriate for the research.
Analyse the spatial variations in commuting propensities and patterns in England and Wales in 2001 and 2011.
Analyse the spatial and sociodemographic variations in commute distance and commuting self-containment in England and Wales in 1991, 2001 and 2011.
Analyse the spatial and sociodemographic variations in mode of transport usage in England and Wales in 1991, 2001 and 2011.
Analyse the spatial and sociodemographic variations in commuting propensities and patterns in the LCR in 2001 and 2011.
Produce a set of policy recommendations based on the findings of the literature review and data analyses that will be useful to the relevant national, regional and local authorities.
1.6 Spatial and Temporal Scope of Thesis
The research reported in this thesis focuses on three separate commuting datasets. Although these datasets are described in greater detail in Chapter 3, they are briefly outlined here in order to set the spatial and temporal scope of the thesis.
The first sets of data are drawn from the 2001 and 2011 Census aggregate data. Aggregate data provide ‘stocks’ of commuters, indicating, for instance, the number of individuals in a LAD who commute to work by mode of transport. The second data source is the 2001 and 2011 Special Workplace Statistics (SWS), also referred to as the interaction data or origin-destination data. The SWS contain ‘flows’ of commuters, indicating, for instance, the number of individuals in one LAD who commute to another LAD by mode of transport. The third data source is the Individual Samples of Anonymised Records (I-SARs) and the Small Area Microdata (SAM), referred to collectively as the census microdata. Microdata from the 1991, 2001 and 2011 censuses reveal the commuting characteristics of individual census respondents, indicating, for instance, whether or not and individual commutes within or beyond their LAD of residence. Analysis of the 1991 microdata has been included in order to provide context for the 2001 and 2011 analyses. It has been possible to use the microdata for 1991 because of their compatibility with the 2001 and 2011 microdata, whilst the aggregate and interaction data for 1991 are not readily consistent with the equivalent data from subsequent censuses and have, therefore, been excluded from the research.
Chapter 4 addresses the first research question. In Chapter 4, the aggregate data and microdata are used to analyse spatial and sociodemographic variations in commuting propensities and patterns across England and Wales and how they have changed over time. In Chapter 5, the microdata are used to examine sociodemographic variations in commute distance and commuting self-containment in England and Wales and how they changed between 1991, 2001 and 2011. Interaction data are also used in Chapter 5 to analyse spatial variations in commuting self-containment at the LAD level across England and Wales in 2001 and 2011. In Chapter 6, the microdata are employed to examine sociodemographic variations in mode of transport and commuting by public transport in England and Wales and how they changed between 1991, 2001 and 2011. The aggregate data are also used in Chapter 6 to analyse modal split at the
national level and spatial variations in commuting by public transport at the LAD level across England and Wales in 2001 and 2011. Chapter 7 addresses the fourth research question. In Chapter 7, the aggregate data, interaction data and microdata are used to analyse spatial and sociodemographic variations in commuting propensities and patterns at the MSOA and LAD levels in the LCR and how they have changed over time. The fifth research question is addressed throughout the thesis, with each of the four analysis chapters having a section entitled ‘Policy Implications and Conclusions’.
1.7 Thesis Structure
Given the spatial specifications and limitations of the three datasets, which have been outlined in Section 1.6 and are detailed further in Chapter 3, the data analysis chapters (Chapters 4, 5, 6 and 7) are only concerned with spatial patterns and sociodemographic characteristics of commuting in England and Wales, while the review chapters (Chapters 2 and 3) are concerned with the whole of the UK.
Chapter 2 addresses the first research objective by reviewing the relevant extant literature and UK transport policy. The chapter begins by outlining commuting definitions and concepts, with a detailed look at UK census questions related to commuting behaviour. It then moves on to outline commuting theory, asking who commutes to work, why they commute to work and examining the structure and agency debate and different attempts to model commuting. Importantly, this outlines some historical and contemporary commuting trends and patterns in the UK and introduces the sociodemographic variables used throughout the research by examining how commuting behaviour has been seen to vary by sex, age, ethnicity and a host of other sociodemographic variables. The chapter then looks at the relationship between commuting patterns and the definition of local labour market areas (LLMAs). Finally, Chapter 2 provides a brief overview of UK transport policy since the publication of the important Buchanan and Smeed Reports in the early 1960s.
Chapter 3 addresses the second and third research objectives. It contains a review of relevant data sources and an outline of the data, spatial frameworks and methods used in this research. The chapter begins with a review of commuting data from the UK censuses, outlining and reviewing the aggregate data, interaction data and microdata in detail. The chapter then explains some problematic issues with homeworking data that have been encountered during the research before outlining the computation of commuting indicators from the census datasets. The chapter provides an overview of the official census spatial frameworks used in this research before explaining the spatial and statistical methods used in this thesis, including choropleth mapping, binary logistic regression (BLR) and simple linear regression (SLR).
In Chapter 4, the 2001 and 2011 aggregate data and I-SARs are used to analyse sociodemographic and regional variations in commuting numbers and rates. 2001 and 2011 aggregate data on economic activity, employment, and age structure are then used to examine possible links between economic and demographic indicators and commuting rates, with SLR being employed to quantify the potential relationships.The same 2001 and 2011 datasets, with homeworkers excluded, are then used to examine regional and sociodemographic variations in travel to work numbers and rates, with BLR being used to model travel to work. SLR and BLR are defined in full in Chapter 3. The aggregate data are also used to examine LAD level variations in travel to work rates and how these changed over the decade. The same datasets are used again, but with homeworkers included, to examine regional and sociodemographic variations in homeworking numbers and rates, with BLR being used to model homeworking. The aggregate data are used to examine LAD level variations in homeworking rates and how these changed between 2001 and 2011. The chapter then exploits a data release oversight by the ONS, by using two sets of aggregate homeworking data to examine LAD level variations in working at home and working from home. This analysis was made possible by the ONS initially releasing 2011 mode of transport data using a homeworking classification that was not compatible with that used for the 2001 data and then being required to release 2011 mode of transport data using a classification that was compatible. Therefore, it became possible to subtract the first set of data from the second set of data to produce one set of data showing those commuters working ‘at home’ and one set of data showing those commuters working ‘from home’. This is explained in more detail in Chapter 3. Finally in Chapter 4, the 2001 and 2011 aggregate data are used to examine overall modal split in England and Wales and LAD level variations in modal split and how these changed over the decade.
In Chapter 5 microdata from three censuses, the 1991, 2001 and 2011 I-SARs, are employed to examine how the distribution of commuters across commute distance bands changed over the two decades. Sociodemographic and regional level variations in the distributions and changes are then examined. The same datasets (with commute distance recoded into a binary variable) are then used to analyse sociodemographic and regional variations in the prevalence of very long-distance commuting. BLR is used to model very long-distance commuting, before probabilities for very long-distance commuting are computed for combinations of the three most important sociodemographic variables. The 1991 and 2011 I-SARs and the 2001 SAM are used to analyse sociodemographic and regional variations in the prevalence of commuting self-containment, before BLR is used to model commuting self-containment. Finally in this chapter, the 2001 and 2011 SWS are applied to examine LAD level variations in commuting self-containment.
In Chapter 6 data from the 1991, 2001 and 2011 I-SARs are employed to examine how modal split changed over the two decades, with sociodemographic and regional variations in modal
split also analysed. The same datasets (with mode of transport recoded into a binary variable) are then used to analyse sociodemographic and regional variations in the prevalence of commuting by public transport. BLR is used to model commuting by public transport, before probabilities for commuting by public transport are computed for combinations of the three most important sociodemographic variables. Finally, the 2001 and 2011 aggregate data are used to examine LAD level variations in commuting by public transport.
In Chapter 7 the 2001 and 2011 interaction data are employed to see how effective the LCR is as a representation of a Travel To Work Area (TTWA), with sociodemographic and LAD level variations in commuting self-containment being examined along with the decadal changes in these variations. The same datasets are then used to examine MSAO level variations and changes in commuting outflows, inflows and self-containment. SLR is again employed to examine the potential relationships between commuting outflows, inflows and self-containment and a host of economic and demographic indicators. The 2001 and 2011 I-SARs are used to examine sociodemographic variations in commuting rates, while the 2001 and 2011 aggregate data are applied to examine LAD level and MSOA level variations and changes in commuting, travel to work and homeworking rates. The 2001 and 2011 aggregate data are used to examine overall modal split in the LCR and MSOA level variations in modal split and how these changed over the decade. The 1991 and 2011 I-SARs and the 2001 SAM are used to examine sociodemographic and LAD level variations in the prevalence of commuting by public transport, with BLR used to model commuting by public transport. Finally in Chapter 7, the 2001 and 2011 aggregate data are used to analyse MSOA level variations and changes in the prevalence of commuting by public transport.
Chapter 8 provides a summary of the research data, techniques, methods and findings, an overview of policy recommendations, a discussion of the limitations of the research, some suggestions for further research and the final conclusions of the thesis.
2. Commuting to Work: Definitions, Concepts, Trends and Patterns
2.1 IntroductionDespite the importance of commuting to both national and local economies and to peoples’ everyday lives, and notwithstanding the media attention given to the related problems that commuting creates, the concepts of commuting, the variations that exist in commuting propensities and patterns and the forces that underpin these patterns remain relatively under-researched. Therefore, this chapter serves two functions. First, it introduces some of the fundamental concepts of commuting, including the way that it is defined and measured, together with some underlying theoretical issues. Second, it presents a review of the interdisciplinary literature on commuting with particular emphasis on the geographical and social dimensions as manifest in spatial and sociodemographic patterns of commuting behaviour in the UK. Both functions serve to contextualise the research undertaken in the thesis and to identify gaps where further research is required. This chapter attempts to fill a substantial hole in the literature by providing a detailed review of the extant literature related to commuting. No such comprehensive review of the commuting-related literature has been published recently, so researchers have to rely on individual academic papers addressing their own specific concerns without a broad and inclusive overview of the wider topic.
This literature review is divided into broad sections relating to: the history of commuting patterns and how they have changed over time (Section 2.4); the geography of commuting patterns including both the spatial and sociodemographic elements (Section 2.5); and the subsequent policy debates that arise in particular from the problems caused by commuting and the utility of commuting data in defining LLMAs (Section 2.6). Section 2.7 provides a brief outline of relevant UK transport policy, while Section 2.8 provides some concluding remarks. However, we begin with a consideration in Section 2.2 of the ways in which commuting is defined and measured, before moving on to review what constitutes the theory that underpins commuting behaviour in Section 2.3.
2.2 Commuting Behaviour: Definitions and Concepts 2.2.1 Definitions: What is commuting?
According to the Oxford Dictionary (2012i), a commuter is “a person who travels some distance to work on a regular basis”. This implies that a commuter must work in a
geographically different location to where he or she lives and some research by Experian (2007) considers commuters to be individuals in employment who must travel out of their ‘area’ of usual residence to get to work. Since the use of spatial units to examine commuting patterns often ‘hides’ very short distance commutes where the individual’s area of residence and work are the same, this approach may lead to an undercount of commuters. These short-distance
moves might include the journey from the bedroom to the workspace for those who work at home (so-called ‘homeworkers’). One key aspect of the Oxford Dictionary (2012ii) definition of commuting is that the travel to work must take place on a regular basis, although it does not define regular, implying that irregular or one-off trips are not seen as commutes even if carried out for employment purposes. However, there is a category of commuters who work from home and travel to and from work regularly but not necessarily to the same workplace destination, e.g. small businesses such as plumbers or decorators who serve customers living in different locations. It is already clear from this brief overview that no single universally accepted definition of commuting exists.
Commuting is often viewed as a stressful, costly and time-wasting part of life by many individuals (Ory et al., 2004). However, recent research has begun to criticise the default assumption of researchers that travel time is wasted time (Lyons and Urry, 2005), with researchers highlighting that activities that provide positive utility can be carried out while travelling (Mokhtarian and Salomon, 2001), and that the commute often serves as a useful transition period between work and home (Ellison, 1999). It should also be noted that people generally become more accepting of increased travel time as their incomes and mobility expectations increase (Stopher, 2004).
Indeed, the rise of long-distance commuting in the UK since the early 1990s would suggest that people in the UK are undertaking longer travel times justified by greater financial rewards and better employment opportunities. Between the 1991 Census and the mid-2000s, the number of commuters traveling more than 30 miles to work increased by a third to 800,000 as reported in The Guardian (2005). However, the rise of long-distance commuting has not been driven entirely by individuals wishing to maximise their utility (through higher earnings and better careers); it may also be due to a growing reluctance amongst employees to relocate when the location of their job changes (Green et al., 1999), which may be due to the high rates of homeownership in the UK compared to many other Western European countries (Earley, 2004). Either way, it appears that long-distance commuting is increasingly being seen as a substitute for individual and household migration when the circumstances of an individual or a family change, with commuting subsequently becoming an increasingly important part of people’s lives in the UK.
However, commuting is not always a ready substitute for migration and the two are often considered in combination by those who seek to improve their employment opportunities and family life and to minimise their travel time. According to Green et al. (1999), if the commuting time between an individual’s house and workplace is greater than that which they are prepared to tolerate, a ‘dual location’ household may be created, with an employee living relatively close to their workplace during the week and returning to their primary residence at weekends. Thus,
this combination of commuting and migration replaces the relatively traditional phenomenon of long-distance daily commuting with long-distance travel on a weekly basis combined with short-distance daily commuting. In this instance, the long-distance journey is really equivalent to a temporary migration rather than a commuting trip.
The growth of complex and non-traditional commuting patterns is likely to be driven by both labour market changes and individual and family circumstances. Family circumstances, such as children being enrolled at a local school or the inability to finance a house move, may mean that when the location of an individual’s job changes, there is no choice but to continue living in the current residence and change commuting behaviour to accommodate the change of employment location.
One could argue that the nature of seasonal work gives rise to seasonal commuting behaviour and patterns. The prevalence of seasonal commuting can be particularly high in areas heavily reliant on the tourist industry, where the incentive for people to migrate for employment opportunities is not permanent (Lundmark, 2006). In these circumstances the commuting and migration behaviour of employees is very similar to that of employees ‘commuting’ on a weekly basis, but over a longer period of time. Employees live close to their workplace during the season and return to their primary residence when the seasonal employment is no longer available. This behaviour is similar to that of higher education students who move from their parental domicile to term-time address three times a year and then commute from these locations (often halls of residence) to their places of study. The existence of seasonal commuting blurs the boundary between the study of commuting and migration behaviour patterns to such an extent that while some academics and researchers refer to ‘seasonal commuting’ (Lundmark, 2006), others refer to exactly the same phenomenon as ‘seasonal migration’ (MacDonald et al., 2012).
A further complication regarding the definition of commuting exists because commuting is not always seen as travel in the context of work. Commuting behaviours are often referred to by researchers and academics in a range of different contexts, including: children and schools (Cooper et al., 2003), students and universities (Delmelle and Delmelle, 2012) and shoppers and retail centres (Raith, 1996), for example.
This lack of consensus as to what constitutes commuting and how to differentiate between commuting and short-term migration means that an investigation of national commuting patterns can usefully begin with an understanding of the available data and an appreciation of how that data are collected, compiled and adjusted (see Chapter 4). This more pragmatic approach avoids the arguments and uncertainties of the conceptual definitions of commuting and focuses on what data are available to make an investigation possible.
2.2.2 Census questions about commuting
A more practical definition of commuting in the UK may be derived from the commuting data collected, compiled and published by the ONS in England and Wales, and the corresponding National Statistical Agencies (NSAs) in Scotland and Northern Ireland. Although the ONS does not provide an official ‘glossary’ definition of commuting, this can be inferred from the questions asked in the census and thus from the data collected on commuting at the start of each decade. Data from censuses are derived from the question on the census form relating to the place of work for each respondent’s main job (Cole et al., 2002).
However, whilst the census remains the most reliable and comprehensive source of information on commuting in the UK, providing counts of individual commuting stocks and commuting flows between origins and destinations (Stillwell and Duke-Williams, 2005), the definition and measurement of commuting is not the same across the whole of the UK. The NSAs ask different questions and use different methods to collect and compile the commuting data in their respective jurisdictions.
The ONS is responsible for organising and conducting the census in England and Wales and is, through the National Statistician, directly accountable to the UK Parliament (House of Commons, 2006). The two key questions asked by the ONS in 2011 in order to measure commuting behaviour in England and Wales were: (i) “In your main job, what is the address of
your workplace?” and (ii) “How do you usually travel to work?”. It is important to note that the question asking for the address of a respondent’s job uses the term ‘main job’, with the result that it does not capture the commuting behaviour associated with an individual’s second job or other jobs, if they were to have more than one. This is important as there are a large number of people in the UK with multiple jobs and this number has remained remarkably constant over time (The Guardian, 2012ii; Simic and Sethi, 2002). It is also important to note that the question on mode of travel does not allow the respondent to give more than one mode, with the question failing to capture any information regarding multimodal commuting. This is important, as arguably nearly all commutes will be multimodal in nature, with walking frequently being required for the employee to get from their residence to their main mode of travel and then from this mode of travel to their workplace. In 2001, the ONS asked essentially the same questions, which contained the same inherent weaknesses.
The National Records of Scotland (NRS) is responsible for organising and conducting the census of households and individuals resident in Scotland, and is responsible to the Culture and External Affairs Minister of the Scottish Parliament (Scottish Parliament, 2012). The questions asked by the NRS in 2011 in order to measure commuting behaviour in Scotland were different from those asked by the ONS: (i) “What address do you travel to for your main job or course of
study (including school)?”. In 2001, the General Register Office for Scotland (GROS) asked exactly the same questions.
The Northern Ireland Statistics and Research Agency (NISRA) is responsible for organising and conducting the census in Northern Ireland and is responsible to the Northern Ireland Assembly through the Department of Finance and Personnel (Northern Ireland Statistics and Research Agency, 2010). The questions asked by the NISRA in 2011 in order to measure commuting behaviour in Northern Ireland were exactly the same as in England and Wales. In 2001, NISRA asked the questions: (i) “What is the address of the place where you work in your main job?” and (ii) “How do you usually travel to work?”.
This collection inconsistency in the UK stands in stark contrast to the situation in Canada, for example, where the same questions about place of work and mode of transport are asked throughout the country (Statistics Canada, 2010), making for a more straightforward investigation of national commuting patterns. However, despite the geopolitical variation in UK censuses, the commuting data that they provide are of more use when conducting an investigation of national commuting patterns than the US census, which asks no questions whatsoever that indicate a person’s place of work or their mode of transport (US Census Bureau, 2010).
The Census Act 1920 provided the legal framework for conducting all subsequent censuses in England, Wales and Scotland (The National Archives, 2012i), with the first census to make enquiries from which commuting data could be derived being held in 1921. Despite the censuses of England and Wales and Scotland being under the same legal framework for almost a century, there have always been three separate censuses in the UK and census questions related to commuting in the UK have not remained consistent over time. Although every census since 1921 has asked questions pertaining to commuting, changes in the questions asked mean that a consistent analysis of the data over the time period 1921-2011 would not be straightforward.
The 1921 Census of England asked respondents to “Give the address of each person’s place of work”. In 1931, respondents in England were given the more complex instruction: “State Name,
Business and Business Address of present employer (person, firm, company or public body) or, if out of work or wholly retired, of last employer”. By 1951 (there being no 1941 Census due to World War II), the census of England reverted to a simpler instruction, asking the respondents to “State the full address of each person’s place of work”. In 1961, the census of England asked a similarly simplified question, requiring respondents to “State the full postal address of the