SEMANTIC
LABELING
AND
REFINEMENT
OF
LIDAR
POINT
CLOUDS
USING
DEEP
NEURAL
NETWORK
IN
URBAN
AREAS
R.Huang1,Z.Ye1,D.Hong2,Y.Xu1,∗,U.Stilla1
1PhotogrammetryandRemoteSensing,TechnicalUniversityofMunich(TUM),Germany -(rong.huang,z.ye,yusheng.xu,stilla)@tum.de
2RemoteSensingTechnologyInstitute,GermanAerospaceCenter,Weisseling,Germany-[email protected]
ICWGII/III:PatternAnalysisinRemoteSensing
KEYWORDS:Pointclouds,MLS,semanticlabeling,deeplearning,optimization
ABSTRACT:
Inthispaper,weproposeaframeworkforobtainingsemanticlabelsofLiDARpointcloudsandrefiningtheclassificationresultsby combiningadeepneuralnetworkwithagraph-structuredsmoothingtechnique.Ingeneral,thegoalofthesemanticsceneanalysis istoassignasemanticlabeltoeachpointinthepointcloud. Althoughvariousrelatedresearcheshavebeenreported,duetothe complexityofurbanareas,thesemanticlabelingofpointcloudsinurbanareasisstillachallengingtask.Inthispaper,weaddress theissuesofhowtoeffectivelyextractfeaturesfromeachpointanditslocalsurroundingandhowtorefinetheinitialsoftlabelsby consideringcontextualinformationinthespatialdomain.Specifically,weimprovetheeffectivenessofclassificationofpointcloud intwoaspects.Firstly,insteadofutilizinghandcraftedfeaturesasinputforclassificationandrefinement,thelocalcontextofapoint isembeddedintodeepdimensionalspaceandclassifiedviaadeepneuralnetwork(PointNet++),andsimultaneouslysoftlabelsare obtainedasinitialresultsfornextrefinement. Secondly,theinitiallabelprobabilitysetisimprovedbytakingthecontextbothin thespatialdomainintoconsiderationbyconstructingagraphstructure,andthefinallabelsareoptimizedbyagraphcutsalgorithm. Toevaluatetheperformanceofourproposedframework,experimentsareconductedonamobilelaserscanning(MLS)pointcloud dataset. Wedemonstratethatourapproachcanachievehigheraccuracyincomparisontoseveralcommonly-usedstate-of-the-art baselines.TheoverallaccuracyofourproposedmethodonTUMdatasetcanreach85.38%forlabelingeightsemanticclasses.
1. INTRODUCTION
In behalf of the popularity of LiDAR Detection and Ranging (LiDAR) techniques, 3D spatial information can be easily ac-quired, which is represented as 3D point clouds. However, a set of unstructured points can not provide semantic information describing objects in the real world directly and explicitly. To be specific, there is a semantic gap between the real applica-tions of point cloud and the original representation of this 3D raw data. Hence, the semantic representation of point clouds serves as basis for many applications, such as 3D scene model-ing (Moussa, El-Sheimy, 2010, Lafarge, Mallet, 2012), object detection (Jochem et al., 2009, Xu et al., 2018) and automatic navigation (Biswas, Veloso, 2012).
Similar to the other remotely sensed data, due to the complex-ity of urban environments (Hong et al., 2018), the qualcomplex-ity of acquired point clouds could be influenced from many aspects, such as noises and outliers resulting from errors of scanning, uneven point cloud density caused by varying measuring dis-tances of scanners, occlusions caused by the strained obser-vation positions, and disturbances caused by dynamic objects. Owing to these problems, the semantic scene analysis of point clouds is still a challenging task in urban areas.
In general, the goal of the semantic scene analysis is to as-sign a semantic label to each point in the point cloud (Hackel et al., 2016). Conventionally, the semantic labeling comprom-ises extracting a variety of handcrafted features for each point in a point cloud, and concatenating them to a feature vector, and then feeding this feature vector into a classifier trained
∗Corresponding author
on representative training samples (Weinmann et al., 2015a). The classifiers, such as AdaBoost (Lodha et al., 2007), sup-port vector machines (SVM), and random forest (Chehata et al., 2009, Sun et al., 2018) are widely used for this semantic labeling tasks. Owing to the ease of easy conduction and good performance, these supervised statistical methods are the most common way applied for this task. However, for these super-vised point-wise classification, although good classification res-ults could be produced with this straightforward procedure due to the high distinctness of hand-drafted features (Hong et al., 2015), the classification result may be in-homogeneous, espe-cially in the areas with low point density and the boundaries of objects, due to the deficiency of the consideration of the local neighborhood of each point. To enhance the regional smooth-ness of the result of semantic labeling, some contextual classi-fication methods have been proposed, such as Markov random fields (Munoz et al., 2009, Lu, Rasmussen, 2012) and condi-tional random fields (Niemeyer et al., 2014, Weinmann et al., 2015b, Yao et al., 2017). In this method, each point is classified considering not only the extracted features but also the features and the labels of its surrounding points. With the improvement of spatial smoothness, the classification results are indubitably refined, which is also accompanied by the high expense of com-putation.
With the availability of high-performance computation re-sources and the access to large-scale datasets, deep learning techniques have been blooming in recent years and appear to be compelling tools in many fields, such as image classification, segmentation, and object detection and tracking. Concurrently, many pieces of research have paid their attention to applying this technique to 3D point cloud classification. For the sake
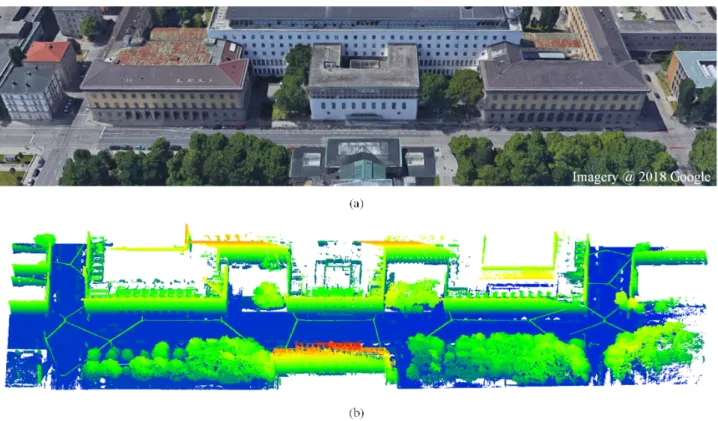
Figure 1. Illustration of the test area in experiments. (a) Image scene of Arcistrasse facing the TUM main entrance from Google maps, 2018. (b) MLS point cloud colored regarding to height.
of the limitation of the way of data representation of an exem-plary convolutional neural network, initial deep learning based 3D classification techniques are usually conducted after a 3D-to-2D transformation, in which some spatial information gets lost. With the emergence of PointNet (Qi et al., 2017a) and its derivatives (Qi et al., 2017b, Qi et al., 2018), new possibilities arise for the classification of point clouds. For deep learning techniques derived from PointNet, 3D point sets can be used as input for the network directly, and the feature mentioned above extraction and supervised classification steps are incorporated to achieve an end-to-end classification strategy, which dramat-ically simplifies the procedure of semantic labeling. Simultan-eously, in the streamline of PointNet, the local and global fea-tures are both learned, which improves the ability to consider the local context for each point. However, for the deep learning techniques like PointNet, to some extent, the results of classific-ation rely on the methods in sampling and splitting on prepro-cessing, and the way of interpolation on postprocessing since the input number of samples should be fixed when fed into a network. Some classification errors and ineffectiveness in the boundary for each split point set will be induced in these steps. To obtain smoother classification results, one commonly used approach is to add a post-processing step considering the con-textual information for each point. Compared with the afore-mentioned contextual classification methods, this strategy is less computation-expensive and less-dependent on the inter-active feature extraction step. In the process of smoothing of semantic labeling, neighborhood dependencies are considered during the processing by exploring the interaction of neigh-borhood labels. Based on the scale of neighneigh-borhood depend-encies, the methods of spatial regularization can be classified into two categories: local neighborhood and global optimiza-tions. Local labeling refinement techniques usually focus on the assignments of weights for each neighboring point. Based
on weights calculated based on different strategies, local filters can be applied to improve the local smoothness and thus im-prove the spatial smoothness on the whole classification res-ults (Lillesand et al., 2014, Bilgin et al., 2008, Kang et al., 2014). These approaches work well when only small regions are wrongly labeled in the initial classification results, and the effectiveness of the smoothing methods is profoundly affected by the definition of local neighborhood. Another strategy is global optimization, in which the initial label probabilities and the spatial correlation in local neighborhood are simultaneously considered by finding an optimal solution for a cost function (Landrieu et al., 2017, Li et al., 2016). This result relies on the way of constructing the graph and the selection of adjacency neighbors. The problem for this method is also the ineffective-ness in large wrongly classified areas.
In this work, we aim at refining the initial classification res-ults of PointNet++ by applying a graph-based optimization in the post-processing step. To be specific, the core concept of our method is to merge the advantages of the capabilities of deep learning in providing in-depth features and the high qual-ity initial soft labels, and the benefits of graph cuts in finding the relation of each sample and its surroundings and optimizing the initial labels. Thus, we can achieve the useful refinement of semantic labeling in complex urban areas.
The contributions of this work are presented as follows: • A general framework for semantic labeling of MLS point
clouds and refinement of classification results is proposed. • Instead of utilizing handcrafted features as input for classi-fication and refinement, the local context of a point is em-bedded into deep dimensional space via an auto-encoder (PointNet++), and simultaneously soft labels are obtained as initial results for next refinement.
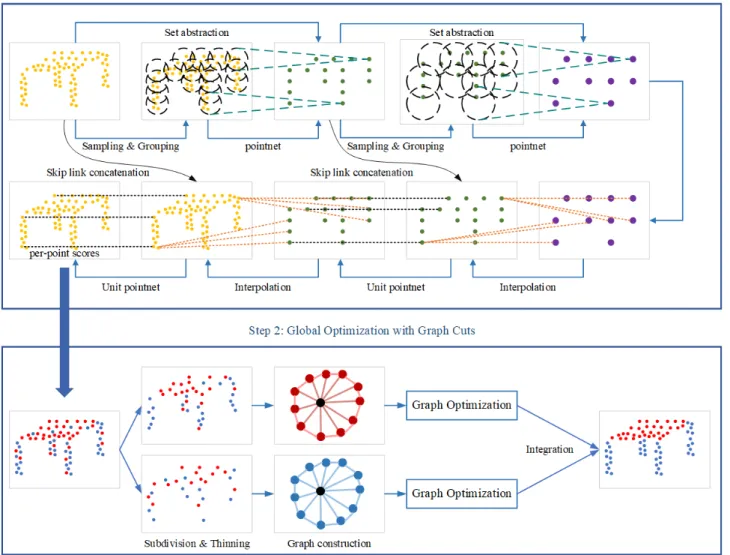
Figure 2. Overview of the proposed classification strategy. • An optimization method based on regularization on a
graph structure is conducted on initial labeling result of 3D point cloud to achieve spatial smoothness of semantic labeling.
2. METHODOLOGY
The complete methodology that we apply for point cloud clas-sification is composed of two major steps illustrated in Figure 2: pre-classification with PointNet++ and classification refine-ment with global spatial regularization. In the first step, the ini-tial classification results with soft labels are obtained by feeding subdivided point clouds into PointNet++. Subsequently, the ini-tial labels are refined through constructing a weighted graph for global regularization which considers both the spatial correla-tion and the initial labels of the points in the neighborhood.
2.1 Introduction to PointNet++
Since there is no rigid structure for raw point clouds, it is im-possible to throw the original point clouds directly into a con-volutional neural network like the processing way for images, when we try to apply deep learning techniques to point clouds. PointNet, as a pioneer work on processing point set directly, provides a solution for spatial encoding ignoring the permuta-tion of points and decentralizing the point sets, by learning the
global features and integrating them with individual point fea-tures. Unlike other deep learning based techniques, PointNet deals with point sets without loss of spatial information and al-lows for simplified preprocessing step without rasterization of point sets.
In the base of PointNet, PointNet++ was induced to be a hier-archical strategy to improve the ability to capture local neigh-borhood and the effectiveness in complex urban areas. The gen-eral idea of PointNet++ is to add sampling and grouping lay-ers to learn hierarchical point set features. The original point sets are firstly subdivided the point sets into several overlap-ping sub-pointsets, and local features are learned from local partitions to provide low-level local features. The local fea-tures are then grouped to learn high-level feafea-tures. This pro-cedure is repeated until the global features of the whole point sets are learned. In each step of hierarchical feature learning, the pointnet layer follows the sampling and grouping layer due to its superiority in feature learning from point sets. Due to the sampling step in hierarchical feature learning step, when dealing with the segmentation task, the features for the original points are propagated from subsampled points with interpola-tion and skip links with layers in set abstracinterpola-tion step. Com-pared with PointNet, PointNet++ is not only able to recognize fine-grained patterns and work better under the high complex scenes, but also more robust to varying point densities. Thus,
2.3 Refining soft labels by regularization
Considering the classification probabilities as input in this step, the refinement of initial labels is conducted by searching for the optimal labels with the improvement of spatial regularity. This step can be divided into three sub-steps, namely subdivision and thinning of the original pre-classified point cloud, construction of a weighted graph and global optimization with Graph Cuts.
2.3.1 Subdivision and thinning Due to the high density of MLS point cloud and the large data amount of complex urban scenes, it is almost impossible to conduct graph-based regularization on the condition that more than ten millions of points with labels are fed. Many research proposed voxel-or supervoxel-based regularization method to downsample the points and decrease the number of points fed into regularization methods. Inspired by this downsampling strategy and to keep the spatial resolution, we proposed a thinning-based way which subdivides the pre-classified points into several sub-point sets. Owing to the manner of random-sampling for each subset, the geometric context for each point is not significantly changed, and the main structure is maintained. Thus the graph-based regularization can be further conducted on each subset. After the optimization step, these subsets will be merged to produce a classified point cloud with the same points as the original point cloud and the optimized labels.
2.3.2 Graph construction Graph cuts is a powerful and popular algorithm which is widely used in the field of com-puter vision for energy optimization, which is an optimization algorithm based on energy function minimization.
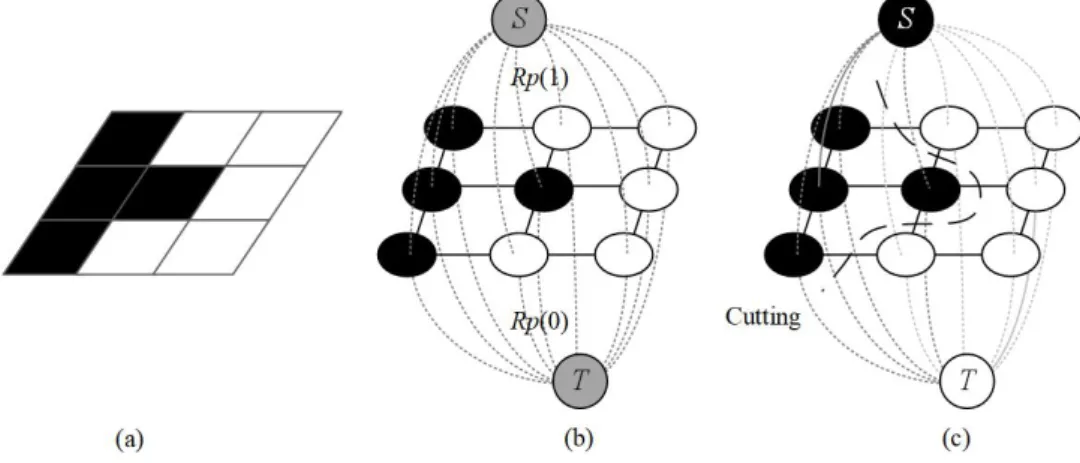
In general, a graphical model is composed of vertices and edges. Specifically, a graphG = (V, E)is used to represent the data (e.g., image) to be classified, andV andEare respect-ively a set of vertex and edge. If the edges have directions, such graphs are called directed graphs. Otherwise, they are undir-ected graphs. Each edge is entitled to values, and the value of edges varies according to different weights which are related to different physical attributes. In the Graph Cuts algorithm, the graphical model is slightly different from the normal graphical model. The Graph Cuts graph has two more vertices based on the normal graph. These two verticessandtare represented by the symbols “S” and “T” (see Figure 3b), which are collect-ively referred to as terminal vertices. All other vertices should be joined and connected to the two vertices to build part of the edge set. To be specific, there are two kinds of vertices and two types of edges defined in Graph Cuts. Elements of the data structure build the first type of vertices and edges. The vertex corresponds to each pixel in the image, and in the case of point
line represents the edgen-links of the normal vertex connection of each two neighborhoods, and the edget-links of each nor-mal vertex connected withsandtare represented by the edge of the dotted line represents. In the context of segmentation,
sgenerally represents the foreground target, whiletgenerally represents the background. A “cut” for the graphical model is a subsetP of the edge setE, and the cost|P|of the “cut” is the sum of the weights of all edges of the subsetP. The dis-connection of edges in the set will result in the separation of the graphical model, corresponding to two disjoint subsets “S” and “T”, which is term as “cutting” (see Figure 3c). If a “cut” has the smallest sum of the weights for all of its edges, it is re-garded as the minimum cut. According to the Ford-Fulkerson theorem, the minimum cut problem of the graphical model is equal to the maximum flow problem of the network, so it could be solved by the optimized solution using Goldberg-Tarjan al-gorithms (Boykov, Kolmogorov, 2004). Namely, we set the la-bel of vertices of “S” to one, and the lala-bel of vertices of “T” to zero. Then, the “cut” of the graph can be achieved by minimiz-ing the energy function:
E(L) =µ· R(L) +B(L) (1) whereL ={l1, l2, ..., lu}is the set of labels (0 or 1) given to
all the vertices. Here,µis the important factor determining the balance of influence betweenR(L)andB(L)on the energy. R(L) =PRu(lu)is the regional term relating to the weight,
andRu(lu)represents the penalty for assigning the labelluto
the vertexv. WhileB(L) =PB
<u,v>·δ(lu, lv)is the
bound-ary term. B<u,v>can be resolved into a discontinuous penalty
between verticesuandvaccording to following: B<u,v>=e
−(Iu−Iv)2
2δ2 (2)
whereIuandIvstand for the general values of verticesuand v. The termδ(lu, lv)is the key to the boundary term, and on
this term there are three constraints:
δ(lα, lβ) = 0 if lα=lβ 1 else (3) δ(lα, lβ) =δ(lβ, lα)δ(lα, lβ)>0 (4) δ(lα, lβ)≤δ(lα, lρ) +δ(lρ, lβ) (5)
Here,lρis the label of a third vertex. The first two constraints
tell that an energy between two different labelslαandlβshould
be non-zero. If it is zero, that means the two labels are the same. Generally, ifuandvhave similar properties, thenB<u,v>will
Figure 3. Graph Cuts for optimization. (a) Original data structure. (b) Constructed graph. (c) Cut of the graph. to zero. While the last constraint defines the triangle rule,
limit-ing that a shortcut of edges has always lower or similar energy than taking the whole path of edges. Only if the last constraint is satisfied, we can say the boundary termB<u,v>is metric.
2.3.3 Global optimization of graph structures The solu-tion of the energy funcsolu-tion as mensolu-tioned above can be achieved by two algorithms: alpha-expansion and alpha-beta-swap (De-long et al., 2012). Here, the alpha-expansion algorithm can only be applied when the boundary term is metric. Otherwise, the alpha-beta swap algorithm will be used. The general idea of the alpha-expansion algorithm is to separate alllαlabeled and non-lαlabeled nodes with “cutting” and the algorithm will change
the label oflαat each iteration. At each iteration, the region
Rα near the node with label lα is expanded, with the graph
weights reset. During the iteration, if two neighboring nodes do not share the same label, an intermediate node is inserted with weighted linking to the distance to the node with labellα. The
algorithm will iterate through each possible label forlα until
it converges. In contrast, the alpha-beta swap algorithm is to successively partition all nodes with labellαfrom nodes with
labellβwith “cutting” and the algorithm will change the label
combinationlα−lβat each iteration. During each iteration, the
graph is constructed in a reasonable way which can segment between the regionRαand the regionRβ efficiently. In other
words, for a node, the terminal link weight should be added with the sum of all links to neighbors which are neither within the regionRαnor in the regionRβ. Similarly, the algorithm
will iterate through each possible combinationlα−lβ until it
converges.
3. EXPERIMENTS
3.1 Experimental dataset
This dataset is originally acquired by Fraunhofer Institute of Optronics, System Technologies and Image Exploitation (IOSB) (Gehrung et al., 2017). The used point clouds are ac-quired by two Velodyne HDL-64E mounted at an angle of35◦ on the front roof of the vehicle. The original raw point clouds are also preprocessed by a statistical outlier removal for down-sampling and noise suppressing. The number of points after preprocessing is around 50 million.
With thousands of scans acquired by the laser scanners along the Arcisstrasse, a scene containing various kinds of objects are obtained through the combination of the point cloud of all the
scans. For the evaluation process, we also generate an accurate manually labeled point cloud for the experimental dataset as ground truth.
3.2 Preprocessing
In order to fulfill the requirement for input in PointNet++, the whole point cloud is subdivided into thousands of sub-point chips, in which 65536 points are contained. These chips are downsampled to 8192 points which represent the main struc-ture of each chip, and the downsampled chips serve as the input for PointNet++. Each point in the chip is represented by a 3D-vector, containing the coordinates(x, y, z).
The total number of points for training is 19,974,050, and the training dataset is subdivided into ten folds. Nine folds are used for training, and one fold is used for validation when training PointNet++ for semantic segmentation. As for the test part, the number of points is 21,205,244.
3.3 Traning parameters
By the way, each training batch contained in a total of 16 chips. The stochastic gradient descent algorithm with a learning rate
η = 0.001and a momentum value ofp= 0.9was employed for training. To adjust the learning rate, we decayed its value by the factor of 0.7 in every 40 training chips. The training process proceeds for a total of 200 epochs. We monitor the progress of the validation loss and save the weights if the loss improves. All experiments were implemented with Tensorflow and carried out by NVIDIA TITAN X (Pascal) 12GB GPU.
3.4 Experimental results
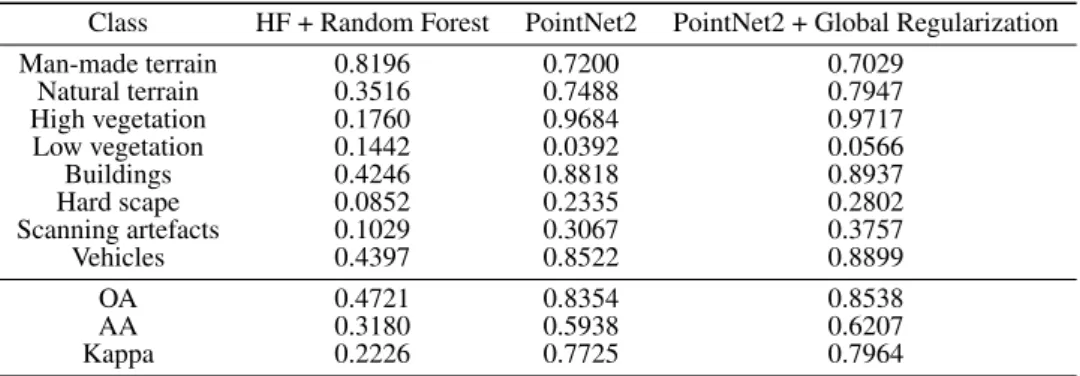
In general, with our proposed method, the overall accuracy for eight semantic labels can reach 85.38%. The detailed statistical results are shown in Table 1.
To evaluate the performance of our proposed method against others, we compare our method with the results of traditional point-based classification with handcrafted features (HF) and random forest (Sun et al., 2018) as the classifier (single scale features are used, and the neighborhood size is set as 100 (formed by KNN) regarding the point density, and the number of trees in Random Forest is set as 50, detemined by cross val-idation), and the original results of PointNet++. As illustrated in Table 1, our proposed method outperforms the other methods concerning overall accuracy and accuracy for most categories.
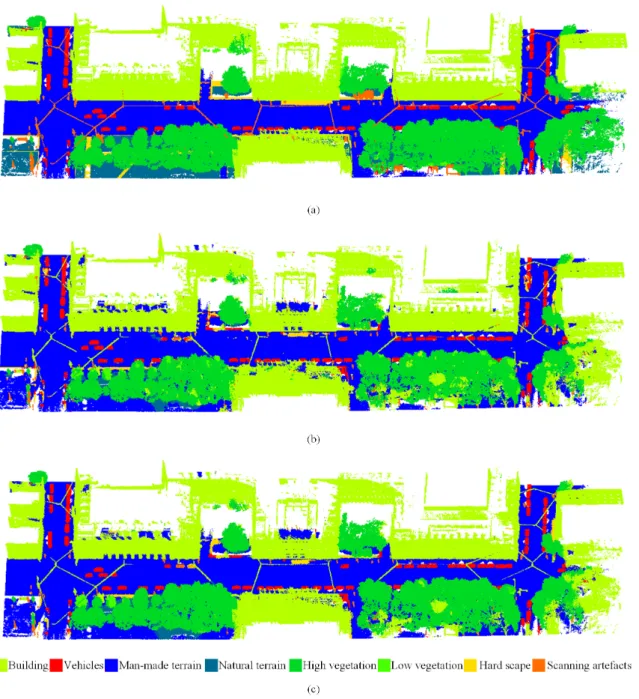
Figure 4. Illustration of the classification results on the TUM dataset. (a) benchmark with manual labels. (b) the classification results with PointNet++. (c) the optimized classification results with our proposed method.
Table 1. Classification accuracy for different classification methods using TUM dataset. PointNet2 + Global Regularization PointNet2 HF + Random Forest Class 0.7029 0.7200 0.8196 Man-made terrain 0.7947 0.7488 0.3516 Natural terrain 0.9717 0.9684 0.1760 High vegetation 0.0566 0.0392 0.1442 Low vegetation 0.8937 0.8818 0.4246 Buildings 0.2802 0.2335 0.0852 Hard scape 0.3757 0.3067 0.1029 Scanning artefacts 0.8899 0.8522 0.4397 Vehicles 0.8538 0.8354 0.4721 OA 0.6207 0.5938 0.3180 AA 0.7964 0.7725 0.2226 Kappa
The baseline method of point-wise classification is not admir-able in some categories because of the unbalance in training samples for each class. Compared with the original results of PointNet++, our proposed method works better, especially for hard scape, scanning artefacts and vehicles. When the whole point cloud is subdivided into chips as input for PointNet++, there is a high possibility that these small objects (compared to large objects like building in urban scenes) are broken into pieces with the loss the main structure. With global optimiza-tion, these pieces can be grouped to share the same labels and appear to have a complete structure, which is illustrated in the classification accuracy. However, as illustrated in Figure 4, for large wrongly classified areas, such as the right-bottom corner, the global optimization can do nothing about it.
4. CONCLUSION
In this work, we propose a framework for point cloud clas-sification. The experiments are conducted using TUM lidar dataset, which proves the effectiveness and efficiency of our method. Specifically, the proposed method is a combination of the advantages of the capabilities of deep learning in provid-ing deep features and the high quality initial soft labels, and the advantages of global optimization in finding the relation of each sample and its surroundings, and the performance has been proved by quantitative and qualitative comparison with other classic classification methods.
ACKNOWLEDGEMENTS
This work is supported by the China Scholarship Council. The authors would like to thank Dr. Markus Hebel, Joachim Gehrung, and Zhenghao Sun for their valuable help and sup-port to this work. This work was carried out within the frame of Leonhard Obermeyer Center (LOC) at Technische Universit¨at M¨unchen (TUM) [www.loc.tum.de].
REFERENCES
Bilgin, G., Erturk, S., Yildirim, T., 2008. Unsupervised clas-sification of hyperspectral-image data using fuzzy approaches that spatially exploit membership relations.IEEE Geoscience and Remote Sensing Letters, 5(4), 673–677.
Biswas, J., Veloso, M., 2012. Depth camera based indoor mo-bile robot localization and navigation.2012 IEEE International Conference on Robotics and Automation, IEEE, 1697–1702.
Boykov,Y.,Kolmogorov,V.,2004.Anexperimental compar-isonofmin-cut/max-flowalgorithmsforenergyminimization invision.IEEETransactionsonPatternAnalysis&Machine Intelligence,1124–1137.
Chehata,N.,Guo,L.,Mallet,C.,2009.Airbornelidarfeature selectionforurbanclassificationusingrandomforests. Interna-tionalArchivesofPhotogrammetry,RemoteSensingand Spa-tialInformationSciences,38(Part3),W8.
Delong,A.,Osokin,A.,Isack,H.N.,Boykov,Y.,2012.Fast ap-proximateenergyminimizationwithlabelcosts.International JournalofComputerVision,96(1),1–27.
Gehrung, J., Hebel, M., Arens, M., Stilla, U.,2017. An ap-proachtoextractmovingobjectsfromMLSdatausinga volu-metricbackgroundrepresentation.ISPRSAnnalsofthe Photo-grammetry,RemoteSensingandSpatialInformationSciences, 4,107.
Hackel, T.,Wegner, J.D.,Schindler,K.,2016.Fastsemantic segmentationof3Dpointcloudswithstronglyvaryingdensity.
ISPRSAnnalsofPhotogrammetry,RemoteSensing&Spatial InformationSciences,3(3).
Hong, D.,Liu,W.,Su,J., Pan,Z., Wang,G., 2015.Anovel hierarchicalapproachformultispectralpalmprintrecognition.
Neurocomputing,151,511–521.
Hong, D., Yokoya, N., Chanussot, J., Zhu, X.X., 2018. An augmentedlinearmixingmodeltoaddressspectralvariability forhyperspectralunmixing.IEEETransactionsonImage Pro-cessing,28(4),1923–1938.
Jochem,A.,H¨ofle,B.,Hollaus,M.,Rutzinger,M.,2009.Object detectioninairborneLIDARdataforimprovedsolarradiation modelinginurbanareas.InternationalArchivesof Photogram-metry,RemoteSensingandSpatialInformationSciences.Paris, 38(part3),W8.
Kang,X.,Li,S.,Benediktsson,J.A.,2014.Spectral–spatial hy-perspectralimageclassificationwithedge-preservingfiltering.
IEEETransactionsonGeoscienceandRemoteSensing,52(5), 2666–2677.
Lafarge,F.,Mallet,C.,2012.Creatinglarge-scalecitymodels from3D-pointclouds:arobustapproachwithhybrid represent-ation.InternationalJournalofComputerVision,99(1),69–85. Landrieu, L., Raguet, H., Vallet, B., Mallet, C., Weinmann, M., 2017. A structured regularization framework for spa-tiallysmoothingsemanticlabelingsof3Dpointclouds.ISPRS Journal ofPhotogrammetry and Remote Sensing, 132, 102– 118.
Systems,IEEE,2690–2697.
Moussa,A.M.,El-Sheimy,N.,2010.Automaticclassification and3dmodelingoflidardata.InternationalArchivesof Photo-grammetry,RemoteSensingandSpatialInformationSciences, France.
Munoz, D., Bagnell, J.A., Vandapel, N., Hebert, M., 2009. Contextual classificationwithfunctionalmax-margin markov networks.2009IEEEConferenceonComputerVisionand Pat-ternRecognition,IEEE,975–982.
Niemeyer,J., Rottensteiner,F., Soergel,U.,2014.Contextual classificationoflidardataandbuildingobjectdetectioninurban areas.ISPRSJournalofPhotogrammetryandRemoteSensing, 87,152–165.
Qi,C.R.,Liu,W.,Wu,C.,Su,H.,Guibas,L.J.,2018.Frustum pointnetsfor3dobjectdetectionfromrgb-ddata.Proceedings oftheIEEEConferenceonComputerVision andPattern Re-cognition,918–927.
Qi,C.R.,Su,H.,Mo,K.,Guibas,L.J.,2017a.Pointnet:Deep learning onpointsetsfor3dclassification andsegmentation.
ProceedingsoftheIEEEConferenceonComputerVisionand PatternRecognition,652–660.
Qi,C.R.,Yi,L.,Su,H.,Guibas,L.J.,2017b.Pointnet++:Deep hierarchicalfeaturelearningonpointsetsinametricspace. Ad-vancesinNeuralInformationProcessingSystems,5099–5108. Sun, Z., Xu, Y., Hoegner, L., Stilla,U., 2018.Classification ofMLSpointcloudinurbanscenesusingdetrendedgeometric featuresfromsupervoxel-basedlocalcontexts.ISPRSAnnalsof Photogrammetry, RemoteSensing&SpatialInformation Sci-ences,4(2).
Weinmann,M.,Jutzi,B.,Hinz,S.,Mallet,C.,2015a.Semantic pointcloudinterpretationbasedonoptimalneighborhoods, rel-evantfeaturesandefficientclassifiers.ISPRSJournalof Photo-grammetryandRemoteSensing,105,286–304.
Weinmann,M.,Schmidt,A.,Mallet,C.,Hinz,S.,Rottensteiner, F.,Jutzi,B.,2015b.Contextualclassificationofpointclouddata byexploitingindividual3Dneigbourhoods.ISPRSAnnals of thePhotogrammetry,RemoteSensingandSpatialInformation SciencesII-3(2015),Nr.W4,2(W4),271–278.
Xu,Y.,Tuttas,S.,Hoegner,L.,Stilla,U.,2018.Reconstruction ofscaffoldsfromaphotogrammetricpointcloudof construc-tionsitesusinganovel3Dlocalfeaturedescriptor.Automation inConstruction,85,76–95.