ContentslistsavailableatScienceDirect
Journal
of
Financial
Stability
journal homepage:www.elsevier.com/locate/jfstabil
Tail
dependence
and
indicators
of
systemic
risk
for
large
US
depositories
夽
Eliana
Balla
a,1,
Ibrahim
Ergen
a,1,
Marco
Migueis
b,∗ aFederalReserveBankofRichmond,UnitedStatesbFederalReserveBoard,UnitedStates
a
r
t
i
c
l
e
i
n
f
o
Articlehistory:Received13August2013
Receivedinrevisedform28February2014 Accepted15October2014
Availableonline27October2014
JELclassification:
G01 G18 G21
Keywords:
Extremevaluedependence Systemicrisk
Systemicallyimportantfinancial institutions
a
b
s
t
r
a
c
t
Inthisstudy,weinvestigatetheextremelosstaildependencebetweenstockreturnsoflargeUS depos-itoryinstitutions.Wefindthatstockreturnsexhibitstronglossdependenceevenintheirlimitingjoint extremes.Motivatedbythisresult,wederiveextremaldependence-basedsystemicriskindicators.The proposedsystemicriskindicatorsreflectdownturnsintheUSfinancialindustryverywell.Wealsodevelop asetoffirm-levelaverageextremaldependencemeasures.Weshowthatthesefirm-levelmeasures couldhavebeenusedtoidentifythefirmsthatweremorevulnerabletothe2007–2008financialcrisis. Additionally,weexploretheperformanceofselectedsystemicriskindicatorsinpredictingthecrisis per-formanceoflargeUSdepositoryinstitutionsandfindthattheaveragestockreturncorrelationsarealso goodpredictorsofcrisisperiodreturns.Finally,weidentifyfactorspredictiveofextremaldependencefor theUSdepositoryinstitutionsinapanelregressionsetting.Strengthofextremaldependenceincreases withassetsizeandsimilarityoffinancialfundamentals.Ontheotherhand,strengthofextremal depend-encedecreaseswithcapitalization,liquidity,fundingstabilityandassetquality.Webelievetheproposed indicatorshavethepotentialtoinformtheprudentialsupervisionofsystemicrisk.
PublishedbyElsevierB.V.ThisisanopenaccessarticleundertheCCBY-NC-NDlicense (http://creativecommons.org/licenses/by-nc-nd/3.0/).
1. Introduction
Financialcrisesoverthelast20yearsspreadbeyondthe bor-ders,industries orfirmstheyoriginatedin,causing widespread disruptiontothebroadereconomy. TheAsian financialcrisisof 1997andtheRussiandefaultof1999spurredturmoilaroundthe world,and thecollapseofthehedgefundLTCMcreatedsimilar concernsfortheUSeconomy.Morerecently,theglobalfinancial meltdownof2007–2008hasreverberatedacrossmanycountries
夽 TheauthorsthankJordanNottandLaurelMazurforexcellentresearch assis-tance.TheauthorsalsothankIftekharHasan,JeffreyGerlach,JasonWu,Levent Guntay,twoanonymousreferees,andtheparticipantsoftheFRBRichmondApplied ResearchSeminarandtheFRBPhiladelphiaRiskQuantificationForumforvaluable commentsanddiscussion.Theopinionsexpressedinthismanuscriptbelongtothe authorsanddonotrepresentofficialpositionsoftheFederalReserveBankofRichmond, theFederalReserveBoardortheFederalReserveSystem.
∗ Correspondingauthorat:BoardofGovernorsoftheFederalReserveSystem, DivisionofBankingSupervisionandRegulation,20thandCStreets,NW,MailStop 1809,Washington,DC20551-001,UnitedStates.
E-mailaddresses:[email protected](E.Balla),[email protected]
(I.Ergen),[email protected](M.Migueis).
1 Address:FederalReserveBankofRichmond,BaltimoreOffice,502S.Sharp Street,Baltimore,MD21201,UnitedStates.
andeconomicsectors,resultingincountlessregulatory interven-tions.Ithasbecomeclearthatsomeinstitutionsplayacriticalrole inthefinancialsystem,duetotheirsize,leverage,and interconnect-ednesswiththerestofthefinancialindustry.Therefore,measuring systemicriskinthefinancialsystemandidentifyingsystemically interconnectedfinancial institutionsarecritical tasks forpolicy makersandregulators.
Inrecentfinancialcrises,extremeco-movementinassetprices andfinancialsectorstockvalueswaspervasive.Asaresult, corre-lationsamongdifferentassetclassesand,inparticular,correlation amongdifferentbanksexperiencedhugespikes,reaching unprece-dentedlevels.Patroetal.(2013)exploredthepotentialofstock returncorrelationsoffinancialinstitutionsassystemicrisk indica-tors.Theyfoundthatthesecorrelationscapturethedownturnsin theUSfinancialsystemwell.Buildingupontheiranalysis,weshow thataveragestockreturncorrelationscanalsobeusedtoidentify thefirmsthataremorevulnerableinafinancialcrisis.
However,thePearsoncorrelationcannotbeusedinisolation tounderstandthedependence ofstockreturns.Ifstockreturns followedamultivariatenormaldistribution,thePearson correla-tioncouldsummarizeallinformationontheirdependence.The literature hasdocumented that stock returns exhibit skewness and significantexcess kurtosis,which implies that theyare fat
http://dx.doi.org/10.1016/j.jfs.2014.10.002
tailed,2andthusnotnormallydistributed.Also,thePearson corre-lationonlymeasureslineardependencebetweenassets’returns and, therefore, does not account for nonlinearities. Moreover, thePearsoncorrelationmaybeparticularlylimitedin assessing dependence during financial crises. It cannot fully capture an increaseindependenceinthejointtailsofdistributions,because it measures“average” dependence, withnoparticularfocus on theextremesofdistributionsand,therefore,isdominatedbythe observationsaroundthemean.3 We believethatunderstanding lossdependenceinthejointextremesofthelossdistributionsis crucialinunderstandingsystemicriskbecausetheprevalenceof dependenceintheextremetailsoflossdistributionsisindicative ofhighcontagionpotentialbetweenfinancialinstitutions.Also,itis essentialtomeasureco-movementoffinancialinstitutionreturns wheninstitutionsexperiencestress,asitcanbeverydifferentfrom theco-movementduringnormaltimes.Inparticular,co-movement wheninstitutionsexperiencestressmaybecomestronger.Thus, webelievethatextremaldependencemeasurescanbevery valu-abletoolsinsystemicriskmeasurement.Patroetal.(2013)also acknowledgestheimportanceofinvestigatingtaildependencies tomeasuresystemicrisk,butleftitasanareaforfutureresearch. Inthisstudy,wefillthisgapandproposesystemicriskmeasures derivedfrommultivariateextremevaluetheory(EVT),whichcan capturethetaildependenciesbetweenstockreturnsoflargeU.S. depository institutions.We believethat thesemeasures canbe usedascomplementarytoolsinmonitoringsystemicriskandwe demonstratetheiradditionalvaluetosuchanalysis.
We construct indicators of systemic risk based onextremal dependencemeasuresformallydevelopedbyLedfordandTawn
(1996,1997,1998).Theextremaldependencemeasureisdefined
as:
=limq→1Pr(L1>L1,q|L2>L2,q)
whereL1,L2standfortwolossvariablesandL1,q,L2,qstandfortheir respectivemarginalqthquantiles.If=0,L1andL2aresaidtobe
asymptoticallyindependent.If>0,L1andL2aresaidtobe
asymp-toticallydependentandmeasuresthestrengthoftheasymptotic dependence.Forexample,Sibuya(1960)showedthatmarginals of multivariatenormal distributionareasymptotically indepen-dentaslongasthecorrelationcoefficientislessthanunity.4Poon
etal.(2004)developedasimpleestimationmethodologyto
iden-tifytheexistenceofasymptoticdependence,aswellastomeasure itsstrengthwhenitexists.Wewillrelyonthismethodforour empiricalanalysis.
Weproposetwocomplementarysystemicriskindicators.The firstindicatoristheproportionofasymptoticallydependent depos-itoryinstitutionpairstothetotalnumberofdepositoryinstitution pairsinoursample,thusmeasuringtheprevalenceofasymptotic dependencebetweenlargeUS depositoryinstitutions.Chan-Lau
et al. (2004) investigated the strength of financial contagion
in internationalstock markets bycalculating the proportion of asymptoticallydependentcountrypairsduringtheMexicanpeso crisisandtheAsiancrisis.Weborrowthismeasurefromthe inter-national financial contagionliterature tomeasure thesystemic risk in theUS banking system.The othermeasure we propose
2SeeMandelbrot(1963)andFama(1965).
3ThePearsoncorrelationcoefficientequallyweightsallobservationsinasample. Sinceobservationstendtobeclusteredclosetothemeanandscarceinthetails, observationsclosetothemeantendtodominatethecalculation.
4Sibuya(1960)originallysuggestedasymptoticdependenceandindependence asabstracttheoreticalconcepts.ItwasLedfordandTawn(1996,1997,1998)who developedthetheoreticalcharacterizationofjointtailsformultivariateextremes whichenabledestimationofthetaildependencestructurethroughempirical diag-nostictests.
is the average strength of asymptotic dependence, average , acrossallpairsofdepositoryinstitutions.Thislattermeasurecan provideinsightsregardingthestrengthofextremaldependence intheUSbankingsystem,beyondtheproportionofasymptotically dependentinstitutions.Ourresultsshowthattheseindicatorstrack reasonablywellperiodsoffinancialmarketturmoilandperiodsof marketstability.
Besidesaccurately monitoringoverall systemic risk,another challengeforregulatorsattemptingtominimizesystemicriskis identifying systemically important financial institutions (SIFIs). Appropriatelymeasuringthevulnerabilityandcontagion poten-tialoffirmsinasystemiccrisiswouldallowregulatorstobetter targetpoliciestocontainsystemic risk.In theaftermathofthe 2007–2008financialcrisis,USandinternationalpolicymakersare enactingnewregulationsforfinancialinstitutionsperceivedas“too bigtofail”,duetotheirsize,interconnectedness,complexity,lack ofsubstitutability,orglobalscope.5
Becausesystemicriskisacomplexphenomenon,itisnot sur-prisingthatmany indicatorsofsystemic importancehavebeen proposedintheliterature.Prominentamongthesemeasuresare theCoVaR(AdrianandBrunnermeier,2011),theMarginalExpected Shortfall(“MES”,Acharyaetal.,2010),DistressedInsurance Pre-mium(“DIP”,Huangetal.,2009)andthegrangercausalitybased measuresofBillioetal.(2012).Webelievethattheco-existence of multipleapproaches tomeasuring systemic importance and institution-specificvulnerabilitytocrisiscouldenhancethe pru-dentialsupervisorytoolkitandtheregulationofsystemicrisk.We addtotheliteraturebydevelopingtwocomplementaryfirm-level measuresofaveragetaildependence,basedonthestockprice co-movementsunderconditionsofjointstress.Ourfirstmeasureisthe proportionofotherinstitutionsthatareasymptoticallydependent withaninstitution.Oursecondmeasureistheaverageofan insti-tution(i.e.theaverageofthebankpairsincludingtheinstitution ofinterest).Thesemeasuresoftailco-movementcanhelp under-standthevulnerabilityandthecontagionpotentialofafinancial institutionduringafinancialcrisis.
Then,we formallyexplorewhetherourmeasuresoftail co-movementcouldhavepredictedthevulnerability ofa financial institutiontothe2007–2008financialcrisis.Wecalculatedthese measuresbeforethebeginningofthecrisisandinvestigatedtheir predictivepowerovercrisisperiodstockreturns.Wefindthatthese measuresare statistically significant predictors of crisis period stockreturns.Inordertodemonstratethevalueaddedbythe meas-uresproposedinthisstudy,wealsotestedthepredictiveabilityof
Patroetal.(2013)correlationmeasures,Acharyaetal.(2010)MES
measure,andtheCAPMbeta.Wefindthatourmeasurespredict cri-sisperiodreturnsbetterthantheCAPMbetaandtheMES.Wealso findthatcorrelationbasedmeasuresaregoodpredictorsof vul-nerabilitytoafinancialcrisis.Thisfindingprovidesmoreevidence fortheusefulnessofthemeasuresproposedbyPatroetal.(2013). Nevertheless,wedemonstratethatourmeasurespredictfinancial crisisreturnsbetterthanthecorrelationbasedmeasureswhenthe crisisperiodischosenmorenarrowly,tocoincidewiththelargest financialcrisislosses.Inparticular,whencrisisperformanceis mea-suredwithpeak-to-troughreturnsinsteadofcumulativereturns,
5 Both the Financial Stability Oversight Council (FSOC) (a creation of the Dodd–FrankActintheUnitedStates)andtheBaselCommitteeweighedinonthe criteriaforthedesignationofsystemicallyimportantinstitutionsinQ42011.For theUnitedStates,theDodd–FrankAct(Section113)listsstatutoryconsiderations forthedesignationofsystemicallyimportantinstitutions.Foradditionaldetailson globaldesignation,seeBaselCommittee(2011).WeincludemanyoftheFSOCand BaselCommitteeproposeddesignationcriteriainSection4whenwelookatthe firm-specificfinancialindicatorsthatcanpredictsystemicinterconnectednessfor financialinstitutions.
ourmeasuresperformsignificantlybetter.Theseresultsindicate thatthefirm-levelmeasuresproposedinthisstudymaypredict thevulnerabilityoffinancialinstitutionstoextrememarketcrashes betterthanthecorrelationmeasures.Therefore,wesuggestthat riskmanagersusethemin monitoringtheriskinessoffirmsas complementstocorrelationanalysis.
Zhou(2010)andMoore andZhou(2012)suggesta
method-ologytoidentify“systemicallyimportant”institutionssimilarto thefirm-levelaveragetaildependencemeasuresweproposein thispaper.Webelieveourapproachtomeasuretaildependenceis preferabletotheirssinceourmethodologyexplicitlytestsforthe existenceofasymptoticdependencefollowingPoonetal.(2004).
InMooreandZhou(2012)asymptoticdependenceisassumedto
existiftheirestimateofisabove0.15andtonotexistotherwise, independentlyoftheprecisionoftheestimate.
Anotherimportantcontributionofthispapertothetail depend-enceliteratureisthatwetakeastepbeyondmeasuringextremal dependence,andtrytoidentifyfactorsthatarepredictiveoftail dependence. Identifying such factors can inform the selection of institutionsthat are systemicallyimportant. In this analysis, weconsideranarrayofinstitutionalcharacteristicstraditionally usedinthebankperformanceliterature.Wefindthatstrengthof extremaldependenceincreaseswithassetsizeand similarityof financialfundamentals.Ontheotherhand,strengthofextremal dependencedecreaseswithcapitalization,liquidity,funding sta-bilityandassetquality.
Finally,wealsocalculatedtheproposedsystemicriskindicators usingthefilteredreturnsfromathreefactorFama-Frenchmodel. Weobservethattheincreaseinsystemicriskaround1998,which coincideswiththeAsiancrisis,Russiandefaultandthecollapseof hedgefundLTCM,wasalmostentirelydrivenbysystematic mar-ketfactors.Ontheotherhand,therecentfinancialcrisis,which beganasacrisisofsubprimemortgages,wasinlargepartdriven byotherfactorsnotcapturedbytheFama-Frenchmodel.Wethink thattheseobservationsareintuitiveasthecrisisin1998didnot originateintheUSbankingindustry,whereastherecentfinancial crisisdid.Also,wefindthatafterthesecondhalfof2009the fac-torsdrivingthetaildependenceamongbanksappeartobecome systematicinnature.
Theremainderofthepaperisorganizedasfollows.Section2 introducesourmeasuresofsystemicrisk.InSection3,we demon-stratethatourmeasurescouldhavebeenusedtoidentifythefirms thatweremorevulnerabletothe2007–2008financialcrisis.In Section4,we analyzehow balancesheetvariablescan beused topredictthestrengthofasymptoticdependencebetweenstock returnsofbankpairs.InSection5,weexaminethetail depend-encebetween filteredreturns and discuss how systematic and non-systematicfactorsdrovetaildependenceinrecentepisodes ofcrises.Section6concludes.
2. Extremaldependenceandsystemicriskmeasures
Multivariateextremevaluetheory(EVT)isoneofthe promis-ingtoolsintheliteraturetomeasurethedependenceofextremes andaddressthedrawbacksoflinearcorrelationanalysis.Numerous studieshaveappliedmultivariateEVTtechniquestotheanalysisof thetaildependenceinfinancialmarkets(e.g.Chan-Lauetal.,2004;
Hartmannetal.,2004;LonginandSolnik,2001;Poonetal.,2004;
Starica,1999).Unlikeearlierstudies,Poonetal.(2003,2004)made
clearthedistinctionbetweenasymptoticdependenceand asymp-toticindependence,whileanalyzingthetaildependencestructure offivemajorstockindices.Suchdistinctionisveryimportant,asit indicatestheexistenceorlackofdependenceinthelimitingjoint extremesofthelossdistributions.Suchextremesmayhavenever
Fig.1. Anexampleofanasymptoticallydependentinstitutionpair.
beenobservedinthehistoricaldata,butdependenceatthose lev-elsiswhatmattersmostwhenmanagingriskagainstcatastrophic events.Forexample,Ergen(2014)empiricallydemonstratesthat thediversificationbenefits,measuredasthereductioninextreme tailrisk,areonaveragethreetimeslargerforasymptotically inde-pendentemergingmarketpairsthanforasymptoticallydependent emergingmarketpairs.
2.1. Agraphicalintroductiontoasymptoticdependence
LetL1andL2 betwolossrandomvariables.Andletqbethe probabilityofoneofthelossvariablesLibeingabovetheqth quan-tileofitsmarginaldistribution,Li,q,conditionalontheotherloss variableLjbeingaboveitsqthquantile,Lj,q.
q=Pr(L1>L1,q|L2>L2,q)=Pr(L2>L2,q|L1>L1,q)
Thetaildependencemeasureisdefinedas:
=limq→1q (1)
If >0, the two loss variables, L1 and L2, are said to be
asymptotically dependent, while if =0, they are said to be asymptoticallyindependent.Asymptoticdependencebetweentwo variablesmeansthat,nomatterhowfarintothetailofonevariable wego,theconditionalprobabilityoftheothervariable simulta-neouslyexperiencinga taileventat leastassevere(inquantile terms)neverreacheszero.Thelimitingextremeoftheloss dis-tributionofafirmislikelytocorrespondtolossessolargeasto causethefirmtogobankrupt.Thus,theofapairoffirmscan looselybeinterpretedastheconditionalprobabilityofdefaultofa firm,whentheotherfirmdefaults.6
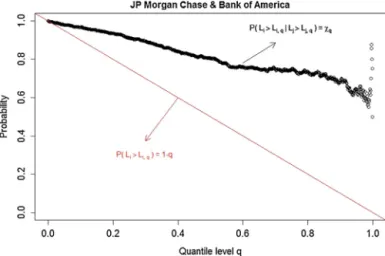
Asanexampleofanasymptoticallydependentpairof institu-tions,inFig.1,weplotqforthestockreturnsofJPMorganChase and BankofAmerica,asafunctionofthequantilelevelq.7 The unconditionalprobabilityofalossgreaterthantheqthquantileis alsoplottedasthelinep=1−q.
Thereisstrongpositiveassociationbetweenthelossesofthese two institutions,astheconditionalprobabilityofan institution experiencing alosslargerthanLi,q isalwaysmuch greaterthan the unconditional probability. Moreover, as the quantile level
6Forexample,MooreandZhou(2012)andZhou(2010)providethis interpreta-tionof.
7ThesampleperiodusedforthegraphicalanalysisinFigs.1and2goesfromthe beginningof2006totheendof2011.
Fig.2. Anexampleofanasymptoticallyindependentinstitutionpair.
increases,thispositiveassociationoflossesneverdiesoff.Instead, asqapproachesone,theconditionalprobabilityisconvergingtoa positivevalueabove0.6.Thus,thestockreturnsofthesetwobanks areasymptoticallydependent.
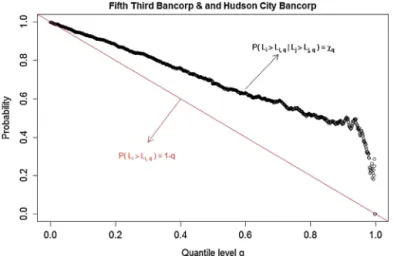
Asanexampleofanasymptoticallyindependentpairof insti-tutions, in Fig.2 we plot theq for thestock returns of Fifth ThirdBancorp(FITB)andHudsonCityBancorp(HCBK).Fig.2 illus-trateshowasymptoticindependenceisdifferentfromasymptotic dependence,representedinFig.1,whilealsoshowingthat asymp-toticindependenceisnotthesamethingasexactindependence. Again,thereispositiveassociationbetweenthesetwoinstitutions, asqisalwayshigherthantheunconditionalprobability(andthus thestockreturnsofthesetwobanksarenottotallyindependent). However,forthispair,asqgetsclosertoone,theconditional prob-ability approaches theunconditionalprobability and, therefore, zero.Therefore,thestockreturnsofthesebanksareasymptotically independent.
Figs.1and2arepresentedinordertointroducetheconceptof
asymptoticdependenceinagraphicalway.Theseplotscanserveas diagnostictools,butcannotbeusedfortestingasymptotic depend-ence in a formal way. Determining the extremal dependence structurefortwovariablesrequiresrigorousstatisticalanalysisand hypothesistesting.Inthispaper,wefollowthemethodology
devel-opedbyPoonetal.(2004)todeterminetheextremaldependence
structureofthestockreturnsoflargeUSdepositoryinstitutions.8 2.2. Formalstatisticalestimationofextremaldependence
FollowingPoon et al.(2004), we beginby transforming the marginaldistributionsofourlossvariablestounitFrechetmarginal distributions. Conversion of univariate marginal variables to a common distribution is standard in tail dependence studies becausethisconversionremovestheinfluenceofmarginal distri-butionsfromdependencecalculations.9Intheliterature,uniform
8TheformalresultsfromthePoonetal.(2004)methodologyfortheJPMorganand theBankofAmericapairandtheFifthThirdandHudsonCitypairare,respectively, thatthenullhypothesisofasymptoticdependencecannotberejectedforJPMCand BAC,andisestimatedtobe0.61;andthatasymptoticdependenceisrejectedfor FifthThirdandHudsonCityand,therefore,theyareasymptoticallyindependent (=0).
9AccordingtoSklar’stheoremanymultivariatedistributionfunctioncanbe sep-aratedintoitsmarginaldistributionsandanotherfunction,knownasthecopula, whichreflectsthedependencebetweenthevariables.Sincethetaildependence esti-mationmethodusedinthispaperisindependentofanyparametriccopula assump-tion,adetaileddiscussionofcopulamethodsisnotrequired.Foranintroduction
distributionsand Frechetdistributions arewidelyusedto stan-dardizemarginaldistributions.Inthisstudy,wetransformtheloss variablestohaveunitFrechetmarginalsinordertofollowthePoon
etal.(2004)methodology,whichhasbecomethestandardmethod
inestimatingtheextremaldependencemeasure.Lossvariables areconvertedtounitFrechetmarginsbythefollowingprobability integraltransform: X= −1 logFL1(L1) and X2= − 1 logFL2(L2) (2) whereFL1andFL2arethedistributionfunctionsforlossvariableL1, andL2,10and−1/log(x)isthequantilefunctionoftheunitFrechet
distribution.Since−1/log(F(L))isamonotonicallyincreasing func-tionofL,thistransformationhasnoimpactontheorderofthedata andthereforehasnoimpacton.Thisisbecauseisa quantile-basedmeasureand, thus,invarianttomonotonicallyincreasing transformationsofthedata.
ForFrechetdistributedvariables,itisknownthat:
limr→∞Pr(X≤r)=1−1r (3)
Inotherwords,asrincreases,the(1–1/r)thquantileofFrechet distributionconvergestor.Also,LedfordandTawn(1996)show thatthejointtailregionoftwounitFrechetdistributedvariables satisfies:
Pr(X1>r,X2>r)=l(r)r−1/ (4)
wherel(r)isaslowlyvaryingfunction,11and∈(0,1]isthe coeffi-cientoftaildependence.Usingthesetwoproperties,wecanderive thefortwounitFrechetdistributedvariablesX1andX2.First,we
replaceqinthedefinitionofby1−1/randobtain: limr→∞l(a∗r)/l(r)=1
∀
a>0Then,using(3),wereplacethe(1−1/r)thquantileoftheunit Frechetvariablesbyr.Further,wenotethat(1−1/r)approaches one,ifandonlyifrapproachesinfinity.Therefore,weobtain:
=limr→∞Pr(X1>r|X2>r)=limr→∞Pr(XPr1>(Xr,X2>r)
2>r)
Using(3)forthedenominatorand(4)forthenumerator,we obtain:
=limr→∞l(r)×r−
1/
1/r =limr→∞l(r)×r1−1
/ (5)
Therefore,=1correspondstoasymptoticdependenceand<1 correspondstoasymptoticindependence.Also,when=1andwe haveasymptoticdependence,isequaltothelimitoftheslowly varyingfunctionl(r).Hence,theproblemofestimatingthe asymp-toticdependencestructurereducestoestimatingthecoefficientof taildependenceandthelimitoftheslowlyvaryingfunction.
Inordertoaccomplishthisestimation,Poonetal.(2004)note thattheexpressionontherighthandsideof(4)isthesameasa powerlawspecificationforunivariateheavytailedvariables.12As
tocopulamodelingpleaseseeNelsen(2006)andTrivediandZimmer(2007).Also, foracompletediscussionoftheimportanceofseparatingthemarginaldistributions andthedependencestructureseeEmbrechtsetal.(1999).
10 Theempiricalcdfisusedasthedistributionfunctionforlosses. 11 Aslowlyvaryingfunctionisdefinedbylim
r→∞l(a*r)/l(r)=1∀a>0.
12 IntheEVTliteratureandforthepurposesofthisstudy,thedefinitionof heavy-tailedvariablereliesonthedecayrateofthetailforthecumulativedistribution function.Ifthetailofadistributiondecaysslowerthantheexponentialrate,the distributioncanbecategorizedasaheavy-taileddistribution.Therefore,theyare commonlyreferredtoassub-exponentialdistributions.
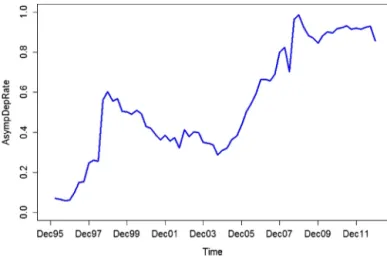
Fig.3.AsympDepRateovertimeusingsixyearrollingwindowsamples. discussedinAppendixA,heavy-taileddistributionsfollowapower lawbeyondahighthreshold,whichcanbewrittenas:
FT(t)=Pr(T>t)∼=l(t)t−1/fort>u (6)
wherel(t)isaslowlyvaryingfunction,uisahighthresholdand
isthetailparameter.Therefore,Poonetal.(2004)proposedto constructa newvariable,T=Min(X1,X2),sothat(4)canalsobe
writtenas:
Pr(X1>r,X2>r)=Pr(T>r)=l(r)r−1/ (7)
Comparingthiswith(6),wenoticethatTisaheavytailed uni-variatevariablewithtailparameter.Thetailparametercanbe estimatedbytheHill’sestimatorandinferencecanbeperformed usingitsasymptoticproperties.Detailsontheestimationofthetail parametercanbefoundinAppendixA.
Inorder totest forasymptoticdependence,we testthenull hypothesis=1.Ifthenullhypothesisofasymptoticdependence (=1)cannotberejected,theniscalculatedasthelimitofthe slowlyvarying function l(r).Detailsof this calculation are also showninAppendixA.
2.3. Systemicriskandfirm-levelextremaldependencemeasures Aftertheasymptoticdependencehypothesisistestedandis calculatedforeachpairoffirmsinoursample,wedefineourtwo systemicriskindicatorsandtwofirm-levelextremaldependence measures.Let:
AsympDepij,t=
1 if ij,t>0 0 if ij,t=0
Thefirstsystemicriskindicator,AsympDepRate,isdefinedasthe ratiobetweenthenumberofasymptoticallydependentinstitution pairsandthetotalnumberofinstitutionpairsinourdataset,fora giventimeperiod.
AsympDepRatet=
i j=/i AsympDepij,t N×(N−1)Thisratiomeasuresthesystem-wideprevalenceofdependence inthejointextremesofthelossdistributionsofbankpairs.Thus, AsympDepRatequantifiesthesystem-widepotentialfor simulta-neousextremelosseventsinmultipledepositoryinstitutions.In Fig.3,wepresentatimeseriesplotofAsympDepRate.Toobtainthe asymptoticdependencefortimet,datafromthesixyears preced-ingtimetisused.Whenwerepeatthecalculationfortimet+1,we
simplyrollthesampleonequarterforward.Forexample, asymp-toticdependenceisestimatedforeachpairofinstitutionsinthe sampleusingdatafromJanuary1990toDecember1995,andthe AsympDepRatecalculatedfromthisperiodisplottedatDecember 1995.Then,theprocedureisrepeatedusingdatafromApril1990 toMarch1996andtheAsympDepRateisplottedatMarch1996,and soon.Wehavechosenasixyearsamplewindowforeachiteration becauseextremevaluetheoryapplicationsgenerallyrequirelarge sample sizesin ordertoaccurately measuretaildependence.13 Themethodsonlyuselosseventsthatlieinthetailsofthedata and,therefore,enoughextremelosseventsarenecessarytoobtain preciseestimatesofasymptoticdependence.
The AsympDepRatesystemic risk indicatorcaptures financial criseswell.Attheendof1995theindicatorwasbelow10%but startedclimbing,reachingnearly25%aftertheAsianfinancialcrisis. Afterwards,thereis amoresignificantincreasearoundthe col-lapseofthehedgefundLongTermCapitalManagement(LTCM)on September1998andaslowdecline,upuntil2004.Finally,the indi-catorgraduallyincreasedduringthe2005–2008period,peakingat anunprecedented95%duringtheheightsofthefinancialcrisis.
The measurement of provides more information beyond whatislearnedbyestablishingthattwovariablesare asymptot-icallydependent.Whentwolossdistributionsareasymptotically dependent, we knowthat theconditionalprobably ofjointtail lossesnevergoestozero,nomatterhowfarintothejointtailwego.
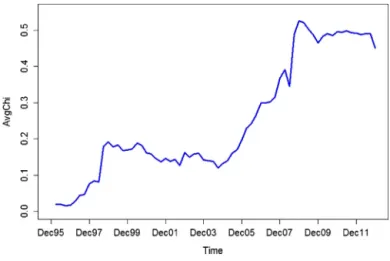
measuresthesizeofthisconditionalprobability.Whenishigh, wenotonlyknowthatthereisapositiveprobabilitythatextreme taillossescanoccursimultaneously,butalsothatthisprobability ishigh.Webelievethatanaggregatemeasureofcanbeauseful systemicriskindicator,complementingAsympDepRate.14The sec-ondsystemicriskmeasurewepropose,AvgChi,isdefinedasthe averageofoverallpossibleinstitutionpairsinourdatasetforthe giventimeperiod.
AvgChit=
i j=/i ij,t N×(N−1)InFig.4,weplotAvgChi,calculatedusingasixyearrolling win-dow.
AvgChi and AsympDepRatearefairly synchronized.The main differencebetweenthetwoistheirscale.AsympDepRateis calcu-latedfromabinaryvariablethatindicatesexistenceofasymptotic dependence.AvgChimeasuresthestrengthofthatdependence,if itexists.AnalysisoftheAvgChiindicatorillustratesthatthe lat-estfinancialcrisiswassubstantiallymoreseverethantheprevious crisesintheendofthe1990s.
Theabilityofthesystemicriskindicatorswedevelopedto pre-dictfinancialcriseswithsubstantialleadtimemayappearlimited. Unfortunately,thisisacommonfeaturesharedbyotherindicators ofsystemicriskthatarebasedonmarketreturninformation.That beingsaid,thewarningpotentialofourindicatorsshouldbe eval-uatedrelativetotheinformationavailableexante.Ifwewerein December2006,wewouldnotknowwhatwillhappentothese measuresin2007andforward.Instead,wewouldonlybeableto seethehistoricalvaluesupuntilDecember2006and,fromthis perspective,thevaluesoftheseindicatorsinDecember2006areat theirhistoricallyhighestlevels.Thefactthattheindicatorsreach
13Withasampleof6years,wehaveapproximately1500dailyreturns,which inturnresultinapproximately75extremetailobservationstobeusedinHill’s estimationfortestingtheasymptoticdependencehypothesis.
14DiTragliaandGerlach(2013)corroboratetheimportanceof.Theyshowed thatispricedbyinvestorsduringgoodtimes(i.e.investorsrequireapremiumto investinfirmswithlarge).
Fig.4.AvgChiovertimeusingsixyearrollingwindowsamples.
evenhigherlevelsin2008,duringthecrisis,doesnotimplythat theindicatorswerenotsignalinghighlevelsoftaildependence during2006and2007.Westilldonotinterpretourindicatorsas predictiveoffuturecrisis;basedonthegraphicalanalysisofthe indicators,thatwouldbeastrongstatement.However,itis obvi-ousthattheseindicatorstrackperiodsoffinancialmarketturmoil andperiodsofmarketstabilityreasonablywell.
Inordertomeasurethefirm-levelextremaldependenceof indi-vidualinstitutions,wedevelopmeasuresthataresimilartothe systemicriskindicators.Alimitationofusingextremaldependence measurestoevaluateaninstitution’ssystemicimportanceisthat thesemeasuresdonotallowustoascertainthedirectionof asymp-toticdependence.Despitethislimitation,webelievethatitisuseful todeterminewhichinstitutionsexhibitasymptoticdependence toa largersetof otherfinancialinstitutionsand which institu-tionsexhibit,onaverage,strongerasymptoticdependence,asthese institutionsmaybemorevulnerabletomarketswingsandmore likelytopropagatetaillosses.Anotherlimitationofourfirm-level measuresisthattheydonottakeintoaccountthesizeand lever-ageofthefirms,andsotheycannotbedirectlytranslatedtoan estimateofcapitalshortfallunderstressfulconditions.
Thefirstmeasureoffirm-levelextremaldependencereflectsthe percentageofinstitutionsthatareasymptoticallydependentwith agiveninstitution. AsympDepRatei,t=
j=/i AsympDepij,t (N−1)Thesecondfirm-levelextremaldependencemeasurewe pro-poseresultsfromaveragingforallinstitutionpairsaninstitution isinvolvedin. AvgChii,t=
j=/i ij,t (N−1)Theusefulnessofthesetwomeasuresasindicatorsofthe vul-nerabilityoflargeUSdepositoryinstitutionstoafinancialcrisisis studiedindetailinthenextsection.
3. Predictivepoweroverfinancialcrisisreturns
We follow theliterature in selecting institutions with mar-ketcapitalizationgreaterthan$5billionattheendofJune2007
(Acharyaet al.(2010);Brownless andEngle(2012).Amongthe
diversesetoflargefinancialinstitutionswithcapitalizationabove
$5billion,oursampleconsistsofthe29institutionsthatare clas-sifiedas depositories based ontheirSIC codes. We focused on depositoryinstitutionsforseveralreasons.First,analysisofa het-erogeneoussampleoffirmsfrommultipleindustriesmayleadto inconclusiveresultsregardingthesignificanceofagivenmeasure ofvulnerabilitytoacrisis,whilefocusingonaparticularindustry mayleadtoaclearerpicture.Byfocusingondepositoriesonly,we wereabletoachieveupto75%adjustedR2inourregressions.
Sec-ond,depositoriesarethefirmsthathaveexplicitdepositinsurance and,thus,aresubjecttoamoralhazardproblem.Finally,oneof thecontributionsofourstudyisananalysisoffactorspredictiveof taildependence.Suchnovelanalysiscanonlybeeasilyperformed for depository institutions,which have been subject to regula-toryreportingforthewholeperiodofoursample.InAppendix
B,TableB1presentsthevariablesandtheirdefinitionsusedinthe
empiricalanalysispresentedinSections3and4.
WeobtaindailyreturnsfromCRSPaswellasmarket capital-izationandquarterlyfinancialdatafromCompustat.Thepanelof firmsisunbalanced,asnotallcompanieshavecontinuouslybeen tradingduringthesampleperiodofJanuary2,1990toMarch30, 2012.SomecompaniessuchasWashingtonMutualfailedorwere acquiredduring thesampleperiod. Furtherinformation onthe datasetconstructionandanaccountoftheinstitutionsthatdonot havereturnsfortheentiresampleperiodisincludedinAppendix
BTableB2.
Descriptivestatistics for thedaily percentage returns ofthe firmsare presented in Table1.Not surprisingly, theminimum dailyreturnsareveryextremeforthosefirmsthatfailedduring thecrisis(NationalCityCorpwith−63.34%,Sovereignbankwith
−72.16%,WachoviaCorpwith−81.6%,WashingtonMutualwith
−90.51%).Thereturn ofmoststockspresentspositiveskewness andsignificantexcesskurtosis.Thisskewnessandexcesskurtosis indicatesstocksreturnshave “fattails” and, thus, are not nor-mallydistributed.JarqueBeratestsarealsopresentedinTable1 toprovideformalevidencethatthestockreturnsinoursampleare notnormallydistributed.
Next,weexplorethepredictivepowerofourproposedfirmlevel averagetaildependencemeasuresoverthestockreturnoffirms duringtherecentfinancialcrisis.Ifthesemeasureshave explana-torypowerovertheperformanceoffinancialinstitutionsduring financialcrises,theycanpotentiallybeusedbyregulatorsto iden-tifythefirmsthataremorevulnerabletosystemiccrisis.
Intestingtheout-of-samplepredictivepowerofourmeasures, wepresentacasestudywherewefollowtheempiricalapproach takenbyAcharyaetal.(2010)ofcalculatingsystemicvulnerability indicatorsforapre-crisisperiod,andthenevaluatingtheir abil-itytopredictout-of-samplestockreturnsduringthecrisisperiod. Weconsidertwopotentialperiodsforthefinancialcrisis.First, fol-lowingAcharyaetal.(2010)andBillioetal.(2012),weconsider thefinancialcrisistospanfromJuly2007toDecember2008.Thus, wecalculateourmeasuresasofJune30,2007,andthenusethe measurestopredictcumulativestockreturnsfromJuly2007to December2008.
Second,we repeat theanalysisdefining the crisisperiod as January2008toDecember 2008.In this case, wecalculate our measuresasofDecember31,2007.Thelatterdefinitionofcrisis correspondstotheperiodwheremostoftheextremelosses,which canbereferredtoastailevents,occurred.Thisisevidencedbythe descriptivestatisticspresentedinTable2.InPanelA,wepresent firm-levelvulnerabilityindicatorsasofJune2007andreturn vari-ables(cumulativeandpeak-to-troughreturns)forthecrisisperiod fromJuly2007toDecember2008.InPanelB,wepresentfirm-level vulnerabilityindicatorsasofDecember2007andthereturn vari-ablesarebasedonthecrisisperiodfromJanuary2008toDecember 2008.Asexpected, allof the firm-levelvulnerability indicators
Table1
Descriptivestatisticsofdailypercentagereturns.
Notes:TherawreturndataisthedailypercentagereturncalculatedasRt=(Pt−Pt−1)/Pt−1,wherePtisthemarketpriceofastockontheclosingofdayt.Forsomefirmsthe dataisnotcompleteascanbeseenfromthefirstcolumn.Fordetailsoninstitutionsthatdonothavereturnsfortheentiresampleperiod,pleaseseeAppendixB.Thehigh
p-valuesinalltheJarque–Beratestsreflectthatnormalityofreturnswasrejectedforallinstitutions.
N Minimum
return(%)
Maximum return(%)
Mean Median Standard
deviation Skewness Excess kurtosis JBtest(p-value) BankofAmerica 5796 −28.97 35.27 0.04 0 2.85 0.82 25.31 155,457.09 BB&T 5796 −23.36 23.61 0.05 0 2.17 0.66 15.19 56,226.92 BankofNYMellon 5796 −27.16 24.81 0.06 0 2.47 0.56 12.74 39,559.66 Citigroup 5796 −39.02 57.82 0.06 0 3.08 1.33 42.7 442,269.18 CommerceBancorp 4597 −12.12 26.92 0.09 0 2.32 0.5 7 9582.38 Comerica 5796 −20.3 20.69 0.04 0 2.27 0.3 12.31 36,742.58 HuntingtonBancshares 5796 −30.59 50.07 0.05 0 3.19 2.08 40.46 399,912.16
HudsonCityBancorp 3389 −14.01 15.68 0.06 0 1.89 0.18 9.74 13,432.66
JPMorganChase 5796 −20.73 25.1 0.06 0 2.6 0.7 10.73 28,294.33
Keycorp 5796 −50.59 54.25 0.03 0 2.78 0.16 61.75 921,450.38
Marshall&Ilsley 5421 −26.03 39.01 0.05 0 2.74 1.2 33.13 249,480.67
M&TBank 5796 −15.61 21.06 0.06 0 1.8 0.67 14.57 51,775.76
NationalCityCorp 4790 −63.34 65.14 0.01 0 2.77 −0.05 154.09 4,742,780.98
NorthernTrust 5796 −18.81 30.91 0.06 0 2.15 0.85 15.36 57,712.74
NewYorkComm.Bank 4810 −13.8 13.95 0.07 0 2.03 0.11 6.56 8651.62
People’sUnited 5796 −19.05 26.67 0.07 0 2.43 0.78 11.77 34,094.28 PNC 5796 −41.4 37.09 0.05 0 2.36 0.52 36.97 330,660.97 RegionsFinancial 5796 −41.07 48.41 0.04 0 2.88 1.4 45.66 505,829.41 SynovusFinancial 5796 −25.97 28.22 0.05 0 2.82 0.55 14.5 51,106.05 SovereignBank 4807 −72.16 69.53 0.07 0 3.19 −0.08 106.43 2,270,524.29 SuntrustBanks 5796 −27.17 30.56 0.05 0 2.53 0.53 21.79 114,993.68
StateStreetCorp 5796 −59.04 31.35 0.08 0 2.64 −1.04 58.14 818,068.05
UnionbancalCorp 4750 −30.5 15.19 0.07 0 2.05 −0.33 15.36 46,831.85
USBancorp 5796 −18.17 29.39 0.07 0 2.23 0.75 17.04 70,750.83
WachoviaCorp 4790 −81.6 90.22 0.05 0 3.31 3.96 246.81 12,180,184.62
WellsFargo&Co. 5796 −23.82 32.76 0.07 0 2.43 1.61 27.67 187,584.35
WashingtonMutual 4724 −90.51 48.76 0.01 0 3.2 −3.99 165.37 5,399,843.72
WesternUnion 1572 −29.01 21.03 0.01 0 2.45 −0.84 19.64 25,515.18
ZionsBancorporation 5796 −24.54 27.56 0.07 0 2.76 0.65 17.95 78,308.51
Table2
Descriptivestatisticsofvariablesusedinregressions.
Notes:PanelApresentsfirm-levelvulnerabilityindicators,totalassetsandleverageasofJune2007andreturnvariables(cumulativeandpeak-to-troughreturns)forthe crisisperiodfromJuly2007toDecember2008.PanelBpresentsfirm-levelvulnerabilityindicators,totalassetsandleverageasofDecember2007andthereturnvariables arebasedonthecrisisperiodfromJanuary2008toDecember2008.NotethatthestatisticsofcumulativereturninPanelBareforashortertimeperiod.So,forexample, the18monthequivalentofthe38.8%averagedeclineis58.2%,whichishigherthantheaveragedeclineof45.3%showninPanelA.ADR=asymptoticdependencerate; Avg.Chi=average;Beta=CAPMbeta;MES=marginalexpectedshortfall;Avg.Corr=averagecorrelationacrossallotherfirms;Avg.Ken=averageKendall’sTau=acrossall otherfirms;Avg.Spr=averageSpearman’sRhoacrossallotherfirms;Assets=Totalassetsundermanagement(seeAppendixBTableB1);Lev=leverage(seeAppendixB
TableB1).
N Minimum Maximum Mean Median Standarddeviation
PanelA ADR 27 0.038 0.923 0.658 0.769 0.255 Avg.Chi 27 0.013 0.429 0.302 0.349 0.127 Avg.Cor. 27 0.397 0.657 0.575 0.597 0.074 Beta 27 0.55 1.505 0.955 0.899 0.226 MES 27 1.289 3.355 2.094 1.904 0.524 Avg.Ken. 27 0.296 0.482 0.414 0.433 0.052 Avg.Spr. 27 0.423 0.656 0.571 0.596 0.065 Cumulativereturn 27 −0.996 0.306 −0.453 −0.425 0.344 Maximumreturn 27 −0.996 −0.187 −0.639 −0.604 0.207 Assets 27 14 2221 318 112 548 Lev. 27 2.747 9.204 6.319 6.231 1.549 PanelB ADR 27 0.192 1 0.801 0.885 0.188 Avg.Chi 27 0.072 0.465 0.366 0.401 0.1 Avg.Cor. 27 0.457 0.689 0.613 0.636 0.066 Beta 27 0.65 1.528 1.031 0.985 0.198 MES 27 1.469 3.444 2.384 2.29 0.477 Avg.Ken. 27 0.323 0.497 0.431 0.447 0.049 Avg.Spr. 27 0.458 0.671 0.592 0.611 0.06 Cumulativereturn 27 −0.988 0.502 −0.388 −0.419 0.33 Maximumreturn 27 −0.993 −0.096 −0.598 −0.604 0.204 Assets 27 14 2188 339 133 568 Lev. 27 2.776 26.646 8.739 8.389 4.634
Table3
Regressionofcumulativecrisisperiodreturns(July2007–December2008)onfirmlevelindicators.
Notes:ThedependentvariableisthecumulativereturnfromJuly2007toDecember2008.Theindependentvariablesare:ADR=asymptoticdependencerate;Avg.Chi=average ;Beta=CAPMbeta;MES=marginalexpectedshortfall;Avg.Corr=averagecorrelationacrossallotherfirms;Avg.Ken=AverageKendall’sTau,acrossallotherfirms; Avg.Spr=averageSpearman’sRhoacrossallotherfirms;Assets=Totalassetsundermanagement(seeAppendixB,TableB1);Lev=Leverage(seeAppendixB,TableB1). Significancecodes:***p<0.01;**p<0.05;*p<0.1.N=27since2depositories(WesternUnionandSovereignBancorp)dropfromthesampleforthisperiodduetounavailable data.EstimationisperformedviaOLS.
(1.1) (1.2) (1.3) (1.4) (1.5) (1.6) (1.7) (1.8) (1.9) Int. .626*(.308) .618**(.296) .341(.417) .413(.418) 1.487***(.457) 1.559***(.462) 1.716***(.499) .504(.379) .471(.368) ADR −.571**(.217) −.629**(.243) Avg.Chi −1.221***(.430) −1.362***(.481) Beta −.158(.311) .175(.307) .207(.302) MES −.104(.140) Avg.Cor. −2.350***(.703) Avg.Ken. −3.422***(.988) Avg.Spr. −2.760***(.792) Assets .003(.123) .007(.121) .002(.153) .028(.159) −.004(.115) −.009(.114) −.013(.113) −.029(.137) −.031(.134) Lev. −.111**(.044) −.112**(.043) −.102**(.049) −.104**(.049) −.093**(.041) −.094**(.040) −.093**(.040) −.111**(.044) −.111**(.043) R2 .409 .431 .240 .250 .483 .495 .497 .417 .443 Adj.R2 .332 .357 .141 .152 .415 .429 .431 .311 .342 (1.10) (1.11) (1.12) (1.13) (1.14) (1.15) (1.16) (1.17) Int. .546(.382) .510(.372) 1.944**(.727) 1.933**(.861) 1.901***(.676) 1.889**(.773) 2.139**(.770) 2.111**(.877) ADR −.611**(.248) .453(.557) .335(.480) .348(.479) Avg.Chi −1.332**.4992 .816(1.324) .594(1.106) .605(1.095) Beta MES .052(.142) .069(.140) Avg.Cor. −3.807*(1.926) −3.679(2.270) Avg.Ken. −4.913**(2.359) −4.766*(2.696) Avg.Spr. −4.006**(1.892) −3.858*(2.145) Assets −.024(.146) −.028(.142) −.014(.117) −.014(.118) −.020(.116) −.019(.117) −.026(.116) −.025(.117) Lev. −.110**(.045) −.110**(.044) −.079*(.044) −.081*(.045) −.085*(.043) −.086*(.043) −.083*(.043) −.084*(.044) R2 .412 .437 .498 .492 .506 .502 .509 .504 Adj.R2 .305 .335 .407 .399 .416 .411 .419 .414
includedinourstudyincreasedfromJune2007toDecember2007. Moreimportantly,theaveragedeclineinstockpricesislarger dur-ing2008.15Also,averagepeak-to-troughreturnsinbothpanelsare ofsimilarmagnitude,whichsuggeststhatmostofthesharpdrops instockpricesoccurredduring2008.Therefore,weconjecturethat ourmeasureswillcapturethevariationinreturnsduringthecrisis betterwhenthecrisisisdefinedfromJanuary2008toDecember 2008.
Finally, we repeat the analysis defining stock return crisis performancebythepeak-to-troughreturns.Byconstruction, peak-to-trough returnsare moresevere thanthecumulative returns in both panels. Using peak-to-troughreturnsas thedependent variables,similarlytoBillioetal.(2012),weaimtocapturethe mostsevereperiodsofcrisisforeachfirm,andthusevaluatethe predictiveabilityoftaildependenceoverthemostsevereshocks experiencedbythefirmsinoursampleduringthecrisis.Again,due tothefocusofourfirm-levelmeasuresonthemostextremelosses, weconjecturethatourmeasureswilloutperformother vulnerabil-ityindicatorsonthelosses,weconjecturethatourmeasureswill outperformothervulnerabilityindicatorsonthepredictionofthis alternativemeasureofstockperformance.Wetestthisconjecture usingthethirdsetofregressionsinthissection.
Whenafinancialinstitutionisasymptoticallydependentwith manyotherinstitutions,andtheaveragestrengthofthis asymp-toticdependence (theaverage ofaninstitution)is larger,we expecttheinstitutiontobemorevulnerabletofinancialcrises.This isbecausestrongtaildependencewithotherinstitutionsleadstoan increasedlikelihoodofextremelosseswhenasignificantnumber
15OneneedstoadjustthestatisticsofcumulativereturninPanelBfortheshorter timeperiod.The18monthequivalentof38.8%averagedeclineis58.2%,whichis higherthantheaveragedeclineof45.3%showninPanelA.
ofthoseinstitutionsaresufferingtaillosses,asisthecaseduring financialcrises.
InallregressionsinTable3,thedependentvariableisthe cumu-lativereturn of depository institutionsduring the July2007to December2008crisisperiod. We controlfor total assetsunder managementandfortheleverageoffirmsasofJune2007.Leverage iscalculatedas:
LVG=bookassets−bookmarketequityvalue+ofmarketequityvalueofequity
Bookvalueofassets,bookvalueofequity,andmarketvalueof equityweredownloadedfromCompustat.16
In regression (1.1), the explanatoryvariable ADR ( AsympDe-pRate)isthepercentage of otherbanksthatare asymptotically dependentwiththebankforwhichreturnsarebeingpredicted. Thecoefficientofthisvariableisnegativeasexpected,anditis statisticallysignificantatthe5%significancelevel.Theeconomic impactimpliedbythiscoefficientisquitelarge.Being asymptot-icallydependentwithonemorebankimpliesanadditionalstock pricedeclineof2.19%17duringthecrisisperiod.Inregression(1.2), theexplanatoryvariableAvgChiistheaverageofabanktaken acrossallotherbanks.Thecoefficientassociatedwiththismeasure isalsonegative,andisstatisticallysignificantatthe1%significance level.A1%increaseintheaverageofabankimpliesa1.22%18
16 ConsistentlywithAcharyaetal.(2010)andBillioetal.(2012),leverageis sta-tisticallysignificantinallregressionsandhasanegativeimpactonthecrisisperiod returns,whereastotalassetsizedoesnothavestatisticallysignificanteffecton financialcrisisreturns.
17 Thereare27banksinthisregressionsince2firmsdropduetounavailable dataforthisperiod.Thereforebeingasymptoticallydependentwithoneother bankincreasestheAsympDepRateby1/26,whichresultsina−0.571/26=−0.0219 changeincrisisreturn.
18 A1%increaseinAvgChiresultsina0.01*(−1.221)=−0.0122changeincrisis return.
Table4
Regressionsofcumulativecrisisperiodreturns(January2008–December2008)onfirmlevelindicators.
Notes:ThedependentvariableisthecumulativereturnfromJanuary2008toDecember2008.Theindependentvariablesare:ADR=asymptoticdependencerate; Avg.Chi=average;Beta,CAPMbeta;MES=marginalexpectedshortfall;Avg.Corr=averagecorrelationacrossallotherfirms;Avg.Ken=averageKendall’sTauacrossall otherfirms;Avg.Spr=averageSpearman’sRhoacrossallotherfirms;Assets=Totalassetsundermanagement(seeAppendixB,TableB1);Lev=leverage(seeAppendixB,
TableB1).Significancecodes:***p<0.01;**p<0.05;*p<0.1.N=27since2depositories(WesternUnionandSovereignBancorp)dropfromthesampleforthisperioddueto unavailabledata.EstimationisperformedviaOLS.
(2.1) (2.2) (2.3) (2.4) (2.5) (2.6) (2.7) (2.8) (2.9) Int. .483**(.229) .453**(.198) .487(.303) .535*(.273) .943*(.461) .891*(.438) .990*(.493) .938***(.331) .828**(.304) ADR −.612**(.256) −.595**(.244) Avg.Chi −1.268**(.471) −1.173**(.460) Beta −.494(.283) −.469*(.257) −.409(.256) MES −.248**(.115) Avg.Cor. −1.596**(.754) Avg.Ken. −2.142**(1.013) Avg.Spr. −1.729**(.834) Assets −.071(.090) −.063(.087) .005(.104) .015(.100) −.055(.092) −.056(.092) −.058(.092) .002(.094) .000(.093) Lev. −.041***(.011) −.041***(.011) −.042***(.012) −.038***(.011) −.038***(.011) −.039***(.011) −.038***(.011) −.042***(.010) −.042***(.010) R2 .510 .534 .459 .490 .487 .487 .484 .574 .582 Adj.R2 .446 .473 .389 .424 .420 .420 .417 .497 .506 (2.10) (2.11) (2.12) (2.13) (2.14) (2.15) (2.16) (2.17) Int. .850***(.296) .762**(.273) .717(.499) .384(.585) .720(.458) .438(.524) .745(.527) .406(.611) ADR −.520**(.249) −.453(.396) −.447(.378) −.460(.378) Avg.Chi −1.051**(.476) −1.366(.915) −1.290(.866) −1.325(.860) Beta MES −.202*(.110) −.178(.111) Avg.Cor. −.607(1.143) .175(1.395) Avg.Ken. −.881(1.465) .054(1.774) Avg.Spr. −.666(1.201) .116(1.446) Assets −.001(.093) −.003(.093) −.065(.092) −.065(.090) −.065(.091) −.064(.090) −.066(.091) −.064(.090) Lev. −.039***(.010) −.039***(.010) −.040***(.011) −.041***(.011) −.040***(.011) −.041***(.011) −.040***(.011) −.041***(.011) R2 .575 .583 .516 .534 .518 .534 .517 .534 Adj.R2 .498 .507 .428 .450 .430 .449 .429 .450
additionaldeclineinstockpriceduringthecrisis.TheadjustedR2’s ofthefirsttworegressionsare40.9%and43.1%,respectively.
Inregression(1.3)–(1.7)weusedseveralothermeasuresfrom thefinanceandsystemicriskliteraturesasexplanatoryvariables. Regressions(1.3)and(1.4)use,respectively,theCAPMbetaandthe MESmeasureofAcharyaetal.(2010)asexplanatoryvariables.19 Asexpected,highvaluesonthesemeasuresseemtopredictlower crisisreturns.However, both arenot statisticallysignificant.In regressions(1.5)–(1.7)weanalyzetheabilityoftheaverage cor-relationmeasures(Pearson,KendallandSpearman,respectively) proposed by Patro et al. (2013) to predict crisis returns. The three regressions produce negative and statistically significant coefficientsforthesecorrelationmeasures.Moreover,theadjusted R2’softheseregressionsarehigherthantheadjustedR2’softhe
regressionsincludingthemeasuresproposedinthisstudy (regres-sions 1.1 and 1.2).Patro et al. (2013) demonstrated that these measurescapturethedownturnsintheUSfinancialsystemwell. However,inthatstudy,theauthorsdidnotperformthistypeof eventstudy,inordertoshowtheusefulnessoftheirmeasuresin identifyingthefirmsthataremorevulnerabletoafinancial cri-sis.Ourstudyclosesthisgapandprovidesadditionalevidencein supportofthemeasuresdevelopedbyPatroetal.(2013).
Inregressions(1.8)–(1.17)weincludeouraveragetail depend-encemeasurestogetherwithothermeasuresfromtheliterature. Asallthesemeasurescapturethesystemicvulnerabilityof depos-itoryinstitutionsin differentways,multicollinearity islikely to beaproblem.Weobservethisintheresults.Whenourmeasures areincludedtogetherwiththeCAPMbetaandtheMESmeasure, thesignofthecoefficientsofthelattermeasuresbecomepositive,
19 CalculationofMESrequiresthechoiceofa“market”index.WeusedtheCRSP value-weightedindexassuggestedbyAcharyaetal.(2010).Thesameindexisused asthesystematicfactorinthecalculationofCAPMbeta.
althoughnotstatisticallysignificant.Similarly,whenourmeasures areincludedtogetherwithaveragecorrelationmeasuresproposed
byPatroetal.(2013),thesignsofthecoefficientsassociatedwith
ourmeasuresbecomepositive,while,inmostcases,thecoefficients associatedwiththeaveragecorrelationmeasureslosetheir statisti-calsignificance.Weconcludethatthecounter-intuitivecoefficient signsaretheresultofmulticollinearity,butalsothattheaverage correlationmeasurescapturethevulnerabilitytothefinancial cri-sis,definedasJune2007toDecember2008,somewhatbetterthan ourmeasures.
Asmentionedintheintroduction,theproposedmeasuresinthis studyaimtoprovidecomplementarytoolstoaddressthe limita-tionsofthelinearcorrelationcoefficientsinmeasuringdependence inthejointtails.20Particularly,weexpectourmeasurestoperform betterinperiodsofseverestress.Statisticallyspeaking,theyshould bebetterpredictorsofafirm’svulnerabilityinperiodswheremore taileventswereobservedacrossthefinancialindustry.Totestthis conjecture,wechangethedefinitionofthecrisisperiod.Instead oftheperiodusedbyAcharyaetal.(2010)andBillioetal.(2012), July2007toDecember2008,wecalculatetheaveragetail depend-encemeasuresasoftheendofDecember2007andtrytopredict stockreturnsduringtheJanuary2008toDecember2008period. Fortheseregressions,thecontrolvariablesassetsizeandthe lever-agearealsocalculatedasoftheendofDecember2007.Theresults arepresentedinTable4.
Similarlytotheregressionspreviouslydiscussed,highervalues ofourproposedmeasures,ADRandAvgChi,arepredictiveoflower stock returns.Theireffectsarestatisticallysignificantatthe1% level.Unlikeinthepriorregression,thenegativeeffectoftheMES measureoncrisisreturnsisnowalsostatisticallysignificantatthe
20Foracompletediscussionofthelimitationsofcorrelationcoefficientsas meas-uresoftaildependence,seeEmbrechtsetal.(1999).
Table5
Regressionsofpeak-to-troughcrisisperiodreturn(January2008–December2008)onfirmlevelindicators.
Notes:ThedependentvariableisthepeaktotroughreturnfortheJanuary2008–December2008period.Independentvariablesare:ADR=asymptoticdependencerate; Avg.Chi=average;Beta=CAPMbeta;MES=marginalexpectedshortfall;Avg.Corr=averagecorrelationacrossallotherfirms;Avg.Ken=averageKendall’sTauacrossall otherfirms;Avg.Spr=averageSpearman’sRhoacrossallotherfirms;Assets=Totalassetsundermanagement(seeAppendixB,TableB1);Lev=leverage(seeAppendixB,
TableB1).Significancecodes:***p<0.01;*p<0.1.N=27since2depositories(WesternUnionandSovereignBancorp)dropfromthesampleforthisperiodduetounavailable data.EstimationisperformedviaOLS.
(3.1) (3.2) (3.3) (3.4) (3.5) (3.6) (3.7) (3.8) (3.9) Int. .118(.097) .059(.085) −.145(.175) −.080(.157) .440*(.227) .358(.222) .442*(.249) .275*(.144) .159(.134) ADR −.560***(.108) −.553***(.106) Avg.Chi −1.073***(.201) −1.047***(.203) Beta −.185(.163) −.161(.111) −.109(.113) MES −.114*(.066) Avg.Cor. −1.292***(.371) Avg.Ken. −1.640***(.513) Avg.Spr. −1.338***(.422) Assets −.055(.038) −.049(.037) −.027(.060) −.016(.057) −.042(.045) −.044(.046) −.045(.047) −.030(.041) −.032(.041) Lev. −.029***(.005) −.028***(.005) −.029***(.007) −.027***(.006) −.026***(.006) −.027***(.006) −.027***(.006) −.029***(.005) −.029***(.005) R2 .772 .779 .532 .562 .676 .658 .656 .792 .788 Adj.R2 .742 .750 .471 .505 .634 .613 .611 .754 .749 (3.10) (3.11) (3.12) (3.13) (3.14) (3.15) (3.16) (3.17) Int. .240*(.129) .140(.121) .183(.212) −.081(.248) .153(.195) −.104(.221) .156(.224) −.138(.257) ADR −.529***(.108) −.515***(.168) −.535***(.161) −.538***(.161) Avg.Chi −1.016***(.211) −1.270***(.388) −1.315***(.365) −1.316***(.362) Beta MES −.067(.048) −.046(.049) Avg.Cor. −.169(.485) .354(.591) Avg.Ken. −.132(.624) .598(.747) Avg.Spr. −.096(.511) .494(.608) Assets −.032(.041) −.033(.041) −.053(.039) −.051(.038) −.054(.039) −.051(.038) −.054(.039) −.051(.038) Lev. −.028***(.005) −.028***(.005) −.028***(.005) −.029***(.005) −.028***(.005) −.029***(.005) −.028***(.005) −.029***(.005) R2 .791 .787 .773 .782 .772 .785 .772 .785 Adj.R2 .753 .749 .732 .743 .731 .746 .731 .746
1%level(regression2.4).Thethreeaveragecorrelationmeasures proposedbyPatroetal.(2013)arealsosignificantatthe1%level, andretaintheirnegativecoefficients(seeregressions2.5through 2.7).Theconjecturethatourmeasureswouldlikelyperformbetter inaperiodreflectingamoreseverecrisisisconfirmed.The regres-sionsusingouraveragetaildependencemeasures(regressions2.1 and2.2)havehigheradjustedR2(44.6%and47.3%,respectively)
thantheregressionsusingaveragecorrelationcoefficients(42%). WhenourADRmeasureisincludedintheregressionsjointlywith averagecorrelationmeasures(regressions2.12,2.14and2.16),we observethatbothvariableshavenegativecoefficients,butneither is statisticallysignificantduetomulticollinearity. WhenAvgChi is includedtogetherwiththeaveragecorrelationmeasures,we observethattheAvgChihasanegative,notstatisticallysignificant, coefficient,whiletheaveragecorrelationmeasureshavepositive coefficients.Weconcludethattaildependencemeasuresprovide betterexplanatorypowerofstockreturnperformanceforthecrisis period.
Sofar,weusedthecumulativestockreturnduringaunified stressperiodtomeasuretheperformanceoffirmsduringthe cri-sis.Alternatively,thestressperiodcanbedefinedseparatelyfor eachfirmastheperiodwheretheworstcumulativereturnwas realizedforthatfirm.Onepossiblemeasureofperformancethat weadoptforthispurposeistheminimumcumulativereturn dur-ingthefinancialcrisis,whichcoincideswiththemaxlossvariable
usedinBillioetal.(2012).Thisvariablecanalsobeinterpreted
asthepeak-to-troughreturn.Itispossibleforafirmtoperform wellatthebeginningoftheexogenouslydefinedcrisisperiodand thensufferseverelossesinmarketvaluelateron,orviceversa. Thus,aperiodofgainsmaysmoothoutseverelossesduringthe moststressfulperiodforafirm.Thealternativedefinitionofthe crisisperiodaddressesthispitfall,byconcentratingontheworse stretchofthefinancialcrisisfromeachindividualfirm’s perspec-tive.Duetothisdefinitionofthecrisisperiod,thecrisisreturns
becomeeven more severeand more dominated by tailevents. Therefore,underthisdefinitionofcrisisperiod,weconjecturethat theaveragetaildependencemeasuresproposedinthisstudycan doabetterjobofidentifyingthefirmsthataremorevulnerable tothecrisis.Werepeatedtheregressionsdiscussedaboveforthis definitionofthecrisisperiod.Theresultsoftheseregressionsare presentedinTable5.Intheseregressions,wecalculatedthe inde-pendentvariablesasoftheendofDecember2007andweusedthe peak-to-troughreturnduringtheJanuary2008toDecember2008 periodasthedependentvariable.
BoththeADRandtheAvgChimeasuresperformwellinthese regressions,as they are statisticallysignificant at the1% level, and the regressions including these two variables (regressions 3.1and 3.2) both have anadjusted R2 above74%. The average
correlationmeasuresalsoperformwell,astheyare statistically significantat1%,andtheregressionsincludingthem(regressions 3.5through3.7)haveadjustedR2 rangingfrom61%to63%.The
differenceinexplanatorypowerrevealsthatthemeasuresbased ontaildependencedo abetterjobinidentifyingthefirmsthat aremorevulnerable tothecrisis.Thisfindingcan alsobe con-firmed by the results of regressions including tail dependence measurestogetherwithaveragecorrelationmeasures(regressions 3.12through3.17).Again,multicollinearityisaproblemandwe observesomecoefficientswithunintuitivesignsfortheaverage correlationvariables.However,intheseregressionsourproposed taildependencemeasuresperformbetter,andturnouttobe sta-tisticallysignificantatthe1%levelinallregressions.Thiscontrasts withwhatweobservedinTable3,wheretheoppositehappened. Overall,theresultsconfirmourconjecturethattaildependence basedmeasuresperformbetterwhenthedependentvariableis definedinamoresevereway,andthusismorereflectiveoftail events.
Twokeyfindingsofthissectionshouldbeemphasized.First,the correlationbasedmeasuresdevelopedbyPatroetal.(2013)canbe
Table6
Descriptivestatistics,whenij,t+1>0.
Notes:ADij,t=Binaryindicatorofasymptoticdependencebetweenbankiandj.Balance-sheetvariablesaredescribedindetailinTableB1inAppendixB.Similarity(Yi,t,Yj,t)= 1−(
Yi,t−Yj,t)/(Yi,t+Yj,t).Variables N Mean St.Dev. Min Max
ij,t+1 10,880 .449 .100 .202 .731
ij,t 10,850 .406 .165 0 .731
ADij,t 10,850 .900 .301 0 1
Min{Ln(Assets)i,t,Ln(Assets)j,t} 10,600 10.91 .851 7.55 14.63
Similarity(Ln(Assets)ij,t) 10,600 .943 .044 .776 1
Min{(Capital/Assets)i,t,(Capital/Assets)j,t} 10,600 .083 .018 .044 .144
Similarity((Capital/Assets)ij,t) 10,600 .886 .097 .298 1
Min{(Cash/Assets)i,t,(Cash/Assets)j,t} 10,362 .046 .039 .003 .379
Similarity((Cash/Assets)ij,t) 10,362 .598 .268 .017 1
Min{(Deposits/Liabilities)i,t,(Deposits/Liabilities)j,t} 9705 .618 .093 .334 .846
Similarity((Deposits/Liabilities)ij,t) 9705 .904 .073 .535 1
Min{(NetIncome/Assets)i,t,(NetIncome/Assets)j,t} 10,585 .001 .005 −.047 .008
Similarity((NetIncome/Assets)ij,t) 10,585 .998 .004 .950 1
Min{(Non-PerformingAssets/Assets)i,t,(Non-PerformingAssets/Assets)j,t} 9480 .006 .006 0 .047
Similarity((Non-PerformingAssets/Assets)ij,t) 9480 .639 .280 0 1
usedtoidentifyfirmsthataremorevulnerabletotheoccurrenceof asystemiccrisis.Second,thetaildependencebasedmeasureswe proposedinthisstudycanaddfurthervaluebeyondthe informa-tionprovidedbycorrelationbasedmeasuresand,thus,canbeused ascomplementarytoolsintheanalysisofsystemicrisk.Therefore, werecommendriskmanagersandbankregulatorstomonitortail dependenciesoffirmstockreturnsinadditiontocorrelations. 4. Predictingasymptoticdependence
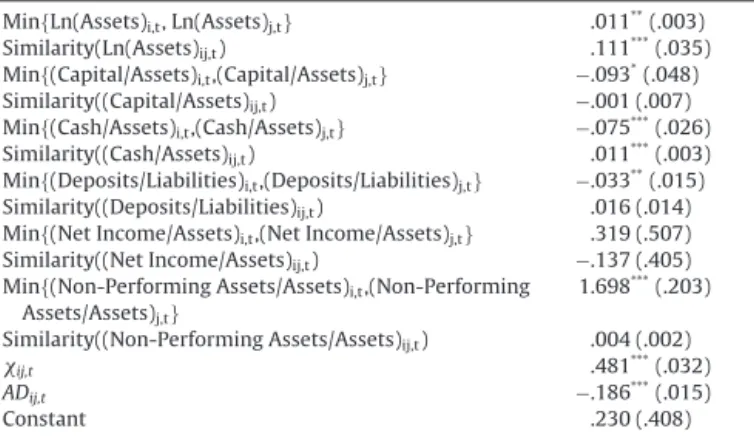
Inthissectionweanalyzehowbalancesheetvariablescanbe usedtopredictthestrengthofasymptoticdependence.Table6 presentsthedescriptivestatisticsforthevariablesusedinthis sec-tion.Asitisdiscussedintheprevioussections,strongasymptotic dependenceis usuallyassociatedwithhighsystemic risk.Thus, webelievefactorspredictiveofasymptoticdependencearefactors toconsiderwhendefiningsystemicallyimportantinstitutions.In ouranalysis,weassumethattheexpectedvalueofthestrength ofasymptoticdependencebetweentwobanks,ij,t+1,followsthe followinglinearstructure:
E[ij,t+1|ij,t+1>0]=c1+c2·1{ij,t=0}+ij+t+1
+ij,t+ˇXij,t
where ij=bank pair fixed effect, t=quarter fixed effect, and
Xij,t=balancesheetvariablesforinstitutionsiandjinquartert. We estimated this linear structure through a fixed effects regression.Theaimofthisregressionistoidentifypredictorsofthe strengthofasymptoticdependence,whenasymptoticdependence exists,andthusweexcludeobservationsforwhichij,t+1equals
zero.Wehaveadoptedordinaryleastsquares(OLS)estimation, despiteij,t+1 beingboundedbetweenzeroand one,becauseit
allowsustoincludebankpairfixedeffects–whichprovecrucial toproperlyidentifythepredictorsofextremaldependence–while avoidingtheincidentalvariablesproblem.Thiscomesatthecost ofhavingaslightlymisspecifiedmodel(i.e.theerrortermsarenot normallydistributed,astheyareassumedtobeinOLSestimation). The balance sheet variables we consider in our forecasting regressionsaremeanttodifferentiatefinancialinstitutions accord-ingtocriteriatypicallyconsideredintheliterature.Wedistinguish institutionsaccordingtosize,capital,liquidity,fundingstability, earnings and asset quality using datafrom COMPUSTAT.21 We
21 Dataisusedbetween1995Q3and2011Q4.Witha6-yearrollingwindow approachandstockpricedatastartingfromJanuary1990,thefirstChiestimated correspondsto1995Q4.
measuresizebythelogofthebank’stotalassets;capitalbyequity capitaldividedbytotalassets;liquiditybycashdividedbytotal assets;fundingstabilitybytheratiobetweenlong-termdeposits andliabilities;earningsbynetincomedividedbytotalassets;and, finally,assetqualitybytheratiobetweennon-performingassets andtotalassets.
Assessingtheeffectofbalancesheetvariablesonthemeasures of asymptoticdependence ischallenginginourempiricalsetup becauseforeachbankpairobservationwehavetwosetsofbalance sheetvariables.Wehaveoptedtoincludetwomeasuresforeach variable,theminimumvaluefortheindicatorbetweenthetwo institutions,andanindexofsimilaritybetweentheinstitutions. Thesimilarityindexesarecalculatedbytheexpression22:
Similarity(Yi,t,Yj,t)=1−
Yi,t−Yj,tYi,t+Yj,t
Thetwomeasurescomplementeachother.Theminimum mea-sureallowsustoassesshowbothinstitutionsbeingofatleastof acertainsize,havingatleastacertaincapitalization,andsoon, affectsthestrengthofasymptoticdependence.Ontheotherhand, thesimilarityindexesallowustoanalyzehowmuchthedifferences betweentheinstitutionscontributetoasymptoticdependence.In general,weexpectincreasesinsimilarityindicestobeassociated withanincreaseinasymptoticdependence,asweexpect simi-larinstitutionsaccordingtotheseindicestobemorelikelytobe perceivedassimilarbythefinancialmarketsand,thus,morelikely toexperiencetailco-movement.
Itislikelythatthefactorsdescribedabovearenottheonly fac-tors thatcan predictasymptoticdependence.Also, theanalysis presentedinthissectiondoesnotestablishacausalrelationship betweenthesefactorsandthetaildependenceofdepository insti-tutions.Nevertheless,webelieveitisrelevanttoenquirewhether theseeasilyaccessiblebalancesheetandincomestatementmetrics canpredictthedevelopmentofextremaldependence.
Weincludetimeeffectsintheregression.Thus,thecoefficients estimated capture how the variation of fundamentals across institutions within time periods correlates with asymptotic dependence.Whilethischoiceresultsinourregressionsnotbeing pureforecastingregressions,aspartofthe“timet+1 variationis absorbedthroughthetimefixedeffect,webelievethisapproach leadstomoreusefulresults.Theusefulnessofthisanalysisresides
22ExceptinthecaseofNetIncomeoverAssets,wheresimilarityisequalto 1−|(NetIncome/Assets)i,t–(NetIncome/Assets)j,t|.