Personal Map: Automatically Modeling the User’s Online
Social Network
Shelly Farnham, Will Portnoy, Andrzej Turski, Lili Cheng & Dave Vronay
Social Computing Group, Microsoft Research
One Microsoft Way, Redmond, WA 98052-6399, USA
[email protected]
Abstract: The Personal Map provides an automated visual overview of the user’s online social network, which can be used in lieu of user-generated contact lists. We explored people’s mental models of their social networks by having them draw whom they cared about, and then developed the Personal Map to automatically visualize these models. Our automated models use past email behavior to infer whom users care about, and how users implicitly cluster or organize contacts in their minds. A user test of the Personal Map indicates that people found it both accurate and compelling. We integrated the underlying model into users’ everyday email through a list of most important and related contacts, and studied its usage. While some people used the list of related contacts, they did not care for its dynamic nature, leading to new user interface designs.
Keywords: Personal Map, social network, email, communication, contacts, personal information management
1 Introduction
Computer-mediated communication has become a primary form of communication in both the work environment and in the home. As people interact with an increasing number of people through email and IM clients, they have more difficulty organizing and maintaining their contact lists. We developed the Personal Map because we were interested in exploring ways to automatically organize contacts in accordance with people’s affective or cognitive mental models of their social networks.
In the following paper, we describe a line of research in which a) we explored intuitive models for social networks through a user study; b) we designed and developed an automated model of users’ social networks; c) we tested our model and its integration into email; and d) we developed new user interfaces based upon lessons learned from our user study.
1.1 Background
A growing number people have to deal with contact management in the course of their online social interactions. Email in particular is becoming a primary habitat through which people maintain their social interactions (Ducheneaut and Bellotti, 2001), and thus serves as the location of people’s personal information management.
Most contact management tools are modeled after pen and paper address books, where people organize their contacts by listing them in alphabetical order. These list-style representations break down under the increasingly overloaded nature of online communication (Ducheneaut and Bellotti, 2001; Whittaker and Sidner, 1996). People increasingly have trouble keeping their contact information up to date and organized in a meaningful way.
Although contact management software has become more complex, the contact representations themselves have maintained a user interface that reflects their simple, alphanumeric, list-based roots (Thomas and Meech, 1994). One notable recent exception is the ContactMap (Nardi et al., 2002), which allows users to arrange their contacts into groups on a two-dimensional plane. The primary goal of the ContactMap is to allow users to organize their contacts to best support their communication tasks with those in their personal social networks.
Similarly, our ultimate goal was to develop a user interface that enhanced people’s ability to easily communicate with individuals and groups in their online social network. We expected that the best means for doing so would be through models of important contacts and groups. However, we also wanted to explore whether it was possible to generate such models automatically.
Developers of the ContactMap similarly attempted to automatically derive important people Human-Computer Interaction -- INTERACT'03
M. Rauterberg et al. (Eds.)
and groups from email behaviour in the ContactMap. In the end they adopted a mixed strategy, inferring important people from email behaviour, but letting users generate their own groups in the ContactMap (Nardi, et al. 2002). We hoped that by carefully mapping our methods for inferring groups onto the users’ expectations about their personal social networks, we might better be able to automatically generate groupings.
Another goal of our approach was to require as little user input as possible. Social networks tend to be dynamic, requiring continual updates to the system. We expected that any user interface that relied heavily on explicitly generated user data was likely to fail in practice.
1.2 Exploratory Study of User Models
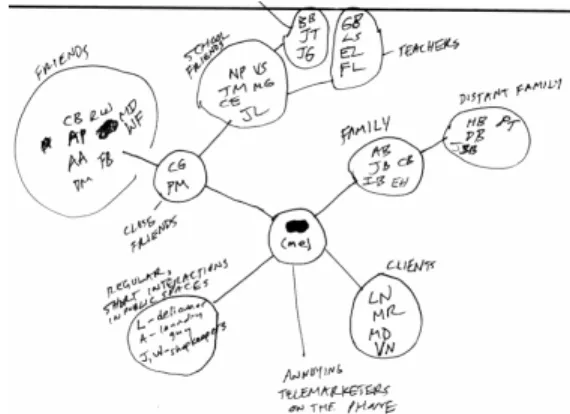
In an exploratory study of how people naturally model their social environments, we recruited 50 participants from a local shopping mall to drew maps of their social spaces. Participants were given a piece of paper with a large rectangle labeled “People Space”. In that space, they were asked to “Draw a picture or map that shows how you are connected with all of the people with whom you have significant interactions.”Although there was a striking diversity in people’s drawings, we found many consistencies. Participants tended to draw themselves in the center of their maps, place important others near the self, and draw lines to represent significant relationships. They further tended to draw circles or squares around people to represent groups, and then draw lines between groups to represent their connections. See Figure 1. People were sometimes represented as belonging to multiple groups through the use of circles, arrows, and labels.
Given the emphasis in these drawings on not only people but the relationships between them, we decided to incorporate a social network approach into our designs, which emphasizes that people are organized depending on their relationships to each other (Wasserman and Faust, 1994). Relational ties may vary in strength and by context, and form meaningful patterns or regularities that can be assessed intuitively. Network approaches have been used in other applications to organize online conversation spaces, but they have focused more on semantic relationships (Sack, 2000) or message adjacency (Donath, Karahalio, and Vegas, 1999; Eick and Wills, 1999; Smith and Fiore, 2001), than on relationships between people.
Contrary to more standard social network procedures, we decided to adopt a very egocentric,
phenomenological approach. We were much less concerned with representing actual social networks than we were with modeling each individual’s unique expectations about his or her social space. We focused less on grouping people depending on their actual interaction patterns, which would produce consistent social maps across people, and more on grouping people depending on how users uniquely interact with people as groups in their networks.
Figure 1: Drawing of social space from study.
1.3 Design
Themes
The design of the Personal Map was guided by the following themes.
1.3.1 Users care most about how contacts are connected to them.
People tend to have an egocentric perspective, and care most about how others relate to themselves. Thus people should be placed in the context of their social networks. When organizing contacts, others should be placed on the map primarily depending on their importance to the user.
1.3.2 People should be organized into groups depending in the user’s phenomenological perspective.
People naturally organize people in their social networks into groups. However each individual’s perspective on a social network is very unique and subjective. As such groups should be derived from the user’s grouping behavior, rather than from levels of interaction between pairs in the network.
1.3.3 The social network is dynamic.
Patterns or regularities in a network structure are dynamic, needing to be updated automatically depending on ongoing changes in relational ties.
2
The Personal Map
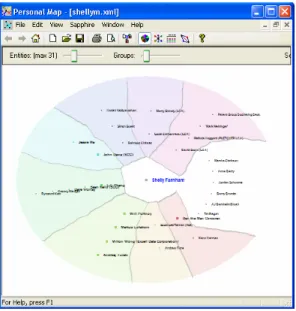
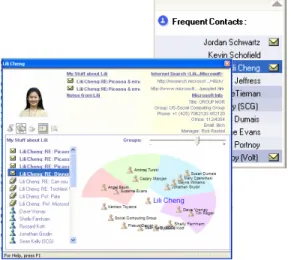
The Personal Map application was developed primarily as a contact visualization tool where people can explore their social networks. There is little contact management to perform, because contacts are organized automatically. The Personal Map infers important people and groups by analyzing users’ email behaviour, and then provides users with social maps of their email social network. See Figure 2.
Figure 2: Personal Map. The user is placed in the center of the map. People are placed closer to the user the more
important they are, and are grouped depending on their tendency to be emailed together.
The goals of the Personal Map are first to automatically model and visualize the user’s important people and groups, and then to facilitate communication.
In the main view of the Personal Map, called the sector view, the user is placed in the center of the map, and the most important contacts are placed around the user in groups (sectors) depending on the user’s tendency to email them together. These groups are dynamic, changing in time depending on their tendency to be emailed together. Users can adjust both the groups, to break them up into smaller groups or merge them into larger groups, and the number of people on the screen.
2.1. Personal Map Components
The Personal Map application has two main components: a) data processing; and b) user interface. These components were developed to be fairly modular, to allow for easy modifications. Each component performs the following functions.
2.1.1 Data processing
Data collection. The first step is to collect the data required to quantify information about people and their relationships. The data collection phase downloads the email headers for all mail (sent and received) from the inbox and archived stores. Data filtering. Before we analyze the user’s email behaviour, we filter out anyone who has not been emailed directly by the user. We further filter depending on the date of the emails. The time span of the filter affects the extent to which we capture short-term groups or long-term groups. In the work context we have found that a month’s worth of email provides a good mix of short-term and long-term groups.
Developing the similarity measure. In order to map onto the users’ mental models of their groups, we measure similarity between contacts as the extent to which they tend to co-occur in the users’ email to, from, and cc: lists. This is distinct from past measures of similarity between people in email network analyses, in that we are measuring the user’s tendency to put people together in groups rather than measuring the number of direct exchanges between pairs of people in an email network.
People who tend to co-occur on emails with fewer people should be more similar than people who tend to co-occur on emails with many other people. We use a significance function that depends on the number of people in the email to weight the contribution of each email to the similarity among all of the people on that email.
We further normalize the similarity value between each pair of people by the number of times each person occurs in emails separately, so that their similarity is smaller if they are each in a large number of emails overall.
Grouping people. Once we have calculated our similarity matrix, people can be clustered into groups. We use hierarchical agglomerative cluster analysis to group people, which creates new clusters iteratively by merging smaller clusters (Aldenderfer and Blashfield, 1974).
2.1.2 Visualization
The primary view of the Personal Map is the sector view. See Figure 2. By default, the sector view places the owner of the email data in the center of the map. We call this the focal point. The clusters of most related people from the hierarchical cluster analysis are arranged into sectors around the focal point, like slices of pie. Within each sector, the people are arranged along the radial dimension so that the people most similar to the focal point are placed closer to the focal point. Originally we had
clustered people grouped on lines radiating from the focus point, but users had trouble distinguishing the groups. We increased the group’s distinctiveness by creating colored sectors for each cluster using a Voronoi diagram (Guibas and Stolfi, 1985).
As the user changes map parameters such as number of groups, the view animates the change by interpolating positions from one map to another map. This continuous transition reinforces the impression to the user that the groups are dynamic rather than immutable.
The user may select the number of people to include in the view, and change the focus of the map. In the default view each person in the user’s social network may belong to only one group. However when a user places a person into the focus of the map, the user can see that person’s multiple group memberships, one for each sector (as inferred from the user’s personal email data).
We were concerned that the sector view might take too much desktop real estate, so we also provided a standard list view in the Personal Map application. The list view has the advantage of allowing users to re-sort contacts by group, name, importance, and recency of contact.
2.2
Email Integration
As mentioned earlier, the Personal Map application was developed as a tool for exploring automated models of social networks. It was not intended for communication, so the user interface takes up too much desk top real estate, it is not directly integrated with email, and it does not update regularly. We decided to integrate our similarity and clustering information into an email client to see if it would facilitate communication.
Figure 3: Outlook add-on, with dynamic lists of related contacts and groups that update depending on who is in the TO: and CC: fields.
To do so, we developed a new message add-on form for Outlook that incorporates dynamic lists of related people and groups from which users might easily select contacts to populate the to: and cc: fields of their emails. See Figure 3.
The dynamic lists provide ordered suggestions of the next single person or group the user may want to address in an email. When the user opens a new message, the list is sorted by similarity to the user. The list is then updated depending on who has been added to the TO: and CC: fields, such that those most similar to the already selected contacts are at the top of the list.
3
User Study
We completed a user study to get feedback about the underlying model and user interface of the Personal Map, and test whether its integration into email through lists of related contacts and groups would facilitate communication.
3.1
Methods
3.1.1 ParticipantsFifteen company employees (6 male, 9 female) participated in the user study in exchange for a lunch coupon. Participants were on average 33 years of age, had been at the company an average of 4 years, and had job positions that required a fair amount of interaction with others. We recruited participants from within the company because the software needed to run on machines with the right software configuration. We collected usage data for over one week. One participant did not install the application due to technical problems, and for several users the Outlook add-on form was not installed properly. Their results were not included in some of the analyses. All participants used Microsoft Outlook as their primary email client.
3.1.2 Procedures
Participants completed the user study in their own offices using their own computers. They were guided through a series of study tasks by the researcher with the help of a packet which outlined the steps of the study. Participants first completed a background and general contact usage questionnaire. As a part of the questionnaire, participants provided a list of email contacts that would later be used in a timed email task.
Participants then installed the application, including both the Personal Map and the Outlook add-on. They were trained in the use of each application, and then completed a structured interview and questionnaire during which they were
asked a series of questions about the accuracy and usability of the application. Participants then completed a timed task, where they emailed individuals and groups using both their standard method, and using the Outlook add-on. Order of email type (standard method vs. Outlook add-on) was counterbalanced. We then left the application running on the participants’ desktops for about a week. Over the course of the week we logged usage patterns in both the Outlook add-on and the Personal Map application. At the end of the week, participants completed a final questionnaire.
3.2
Results
Our results are divided into the following sections: a) pre-questionnaire results, b) the Personal Map accuracy and usability, and c) email integration. 3.2.1 Pre-questionnaire
We first wanted to know whether people tended to work with others in groups, defined as 3-10 people focused on a particular project. People on average reported working with 6 work groups (SD = 4.2), and 33% indicated that these groups changed a fair amount over time. On average, these groups tended to be represented by distribution lists formed through the company’s directory system (M = 5.1, where 1 = not at all and 7 = extremely so), though not extremely so. People reported using 6 distribution lists regularly.
People reported emailing about 22 unique people in a typical day and about 56 unique people in a month. They indicated that their contacts were not very organized (M = 2.3). 85% of participants reported spending no time organizing their contacts, and on another question 53% reported not keeping them up to date.
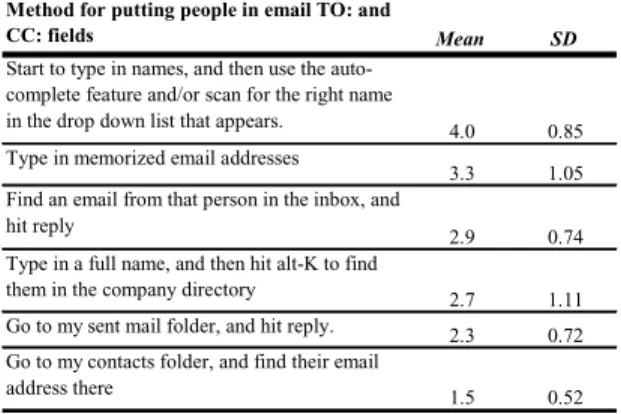
We asked participants to rank order how they would go about finding a particular email address. We found that on average the number one method was to sort the inbox by name, and then scan through the inbox. When asked how they normally enter email addresses into the TO: and CC: fields in email, people reported that they generally start typing names, and then use the auto-complete feature. Note the auto-complete feature, which completes an email address using a name or email prefix, can access both the user’s inbox and the company’s address directory through an additional alt-k key stroke. The least common method was to go the contacts folder, and find the address there. See Table 1.
In sum, our participants regularly interact with dynamic groups, and some but not all of these groups are represented by email distribution lists. People tended to not use or update their contact lists.
Table 1: How people populate emails. On a scale of 1 to 5, where 1 = never and 5 = always.
3.2.2 Personal Map usability and accuracy After introducing people to the Personal Map and allowing them to adjust grouping in the user interface, we had them rate the extent to which the sector view accurately represented their actual email space. Most users rated it as very accurate (M = 5.7, on a scale of 1 to 7). See Figure 6.
Ratings of Personal Map Accuracy
Not at All Extremely So 7 6 5 4 3 2 Fr equenc y 8 6 4 2 0
Figure 4: Accuracy of Personal Map Although the Personal Map accurately mapped onto how people thought about their groups, the researcher observed from user comments discrepancies between the users’ expectations and the map’s underlying model. Users expected the importance and clustering information to be determined by whom they had sent emails to as a group, and not by the grouping in emails they had received. In cases where people were clustered together through small similarity values, users
Method for putting people in email TO: and
CC: fields Mean SD
Start to type in names, and then use the auto-complete feature and/or scan for the right name
in the drop down list that appears. 4.0 0.85 Type in memorized email addresses
3.3 1.05
Find an email from that person in the inbox, and hit reply
2.9 0.74
Type in a full name, and then hit alt-K to find
them in the company directory 2.7 1.11 Go to my sent mail folder, and hit reply. 2.3 0.72 Go to my contacts folder, and find their email
thought the clusters were erroneous. It would be better to cluster based only on strong or moderately strong similarities.
In addition to finding the map accurate, users reported liking the sector view (M = 5.1, where 1 = not at all and 7 = extremely so), and did not find it confusing or difficult to use (M = 2.9). Over the course of the study we gave participants several opportunities to provide open-ended feedback about the Personal Map. People reported finding it easy to understand and attractive. Several people spontaneously commented “that’s cool” or “wow” when first viewing it. One person noted it “makes more sense ‘sooner’ than contact list.”
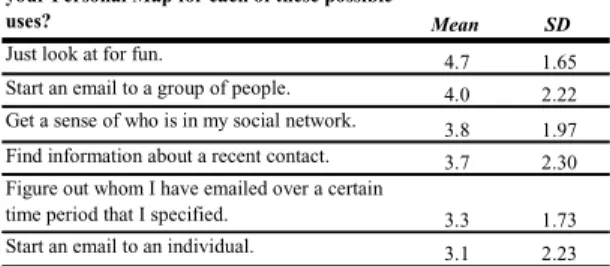
Although people thought the Personal Map was accurate and attractive, they were not confident they would use it (M = 3.6). Participants rated the likelihood of actually using the Personal Map for a number of possible uses. See Table 2. The most highly rated possible use was to look at for fun, and the second most highly rated use was to start an email to a group of people.
To what extent do you think you would use your Personal Map for each of these possible
uses? Mean SD
Just look at for fun. 4.7 1.65
Start an email to a group of people. 4.0 2.22 Get a sense of who is in my social network. 3.8 1.97 Find information about a recent contact. 3.7 2.30 Figure out whom I have emailed over a certain
time period that I specified. 3.3 1.73 Start an email to an individual. 3.1 2.23
Table 2: Extent to which people would use Personal Map for a variety of reasons, where 1 = not at all, and 7 =
extremely so.
When participants were asked through an open-ended question which features they expected they might use, four participants said they would use it to email groups. One participant mentioned liking the groups because they might help remind her of individuals she would otherwise forget. A few mentioned it provided a useful tool for viewing recent activities.
The Personal Map was instrumented to allow us to see which features were most used. Over the course of about a week, people opened the Personal Map application on average about two times each (M = 1.9 times, SD = .88). The most common activity
was adjusting the group slider, which broke the sectors down into smaller groups or merged them into bigger groups. Only four users started an email from the Personal Map.
Most of the general open-ended comments were fairly positive:
It seems to represent who I communicate with in layouts that are intuitive to me.
It provides a great big picture view of my activities, and I like that.
However, a few people wanted more explanation of our underlying model.
It will become more useful if there are more explanations on the relationships of groups it creates.
When asked how they might improve the Personal Map, people suggested greater integration with their email clients, an ability to navigate to specific emails from groups, and an ability to directly modify the people and groupings.
3.2.3 Email integration
As mentioned earlier, we had people install the Outlook new email add-on so that we could assess whether the lists of related people and groups, based on our similarity and clustering analyses, would facilitate communication.
Prior to viewing the Personal Map, we showed participants the related people list in the Outlook add-on and asked them to explain the logic behind the list of related people. 80% accurately figured out it was ordered by default by frequency of interaction with the user, 20% did not know how it was ordered. We then asked whether our suggested groups made sense to them. Participants reported that they were somewhat sensible (M = 5.0). The apparent reduced accuracy of the add-on’s groups relative to the Personal Map sector view highlights the importance of the user being able to adjust the grouping tolerance.
People were fairly neutral in their ratings of the email add-on’s list of related people, on average only somewhat liking it (M = 4.0), being only somewhat likely to use it (M = 4.1), and thinking it somewhat confusing or difficult to use (M = 3.5). Participants generally indicated that while it was useful to have a list of important, related people, they did not care for the way the list changed order depending on whom had already been selected because it made it difficult to scan for names.
We had participants complete a timed task to assess whether using the list of related people would aid or hinder communication. First they listed three people they were likely to email every day, three people they were likely to email once every week or
so, and then three groups of 3-4 people they were likely to email together. Then participants went through each item in the list, and started an email for each item. We timed from the moment they opened the new email add-on form, to the moment they were ready to send the email. Each participant completed the timed email task both using their regular methods to start an email, and using the related people list. Order was counterbalanced. We analyzed the times using a multivariate analysis of variance with condition (normal method vs. list of related contacts method) entered as a within-subjects factor.
We found no difference in times in seconds for frequently used names between the normal method (M = 4.7s) and the list of related contacts method (M = 4.3s), F(3, 7) = .9, ns. However for infrequently used names participants were significantly slowed down when using the list of related contacts (M = 8.2s) compared to the normal method (M = 3.9s), F(3, 7) = 7.29, p < .02. Observation of participants while completing the task indicates selecting infrequent names took more time because of the need to scroll to the bottom of the list.
When entering multiple names, again we found that people were slower when using the list of related contacts (M = 17.3s) than when using their normal method (M = 10.8s), F(3, 7) = 4.95, p < .04. People found it difficult to scan the list for names after the first one was selected because the list changed order. Overall, people were slower when using the contact list to select groups for 73% of the timed tasks, and slower when using their regular methods for 27% of the timed tasks. While most people expected to find the names where last seen in the list, a few people learned to trust that the most related name would appear at the top of the list, would scan for it there, and would find it quickly.
The new email form was instrumented so that we could log user emailing behavior. Three participants uninstalled the application within twenty four hours of the introductory session due to technical problems. The remaining participants had the application running for 9.9 days (SD = 4.9). People on average sent 17.5 emails per day (for each day they sent at least one). 62% of emails sent were replies, 23% were new, and 15% were forwards. On average, 72% of emails were sent to only one person, 14% were sent to two people, and 14% were sent to three or more people. 84% of the names were put into the TO: field, and 16% were put into the CC: field.
We found that people on average used the list of related contacts in 7% of emails sent. Excluding replies (which already have a populated TO field),
people used the list of related contacts in 12% of emails. We would expect if the list of related contacts particularly helped users email multiple people, users would be more likely to select contacts from the list when emailing more than one person. As expected, people used the list of related contacts in 5% of emails sent to one person, and in 8% of emails sent to more than one person, F(1, 10) = 2.28, p = .08, 1-tailed. The groups feature was used only once.
In sum, participations liked the presence of the list of related contacts, used it in 12% of all new and forwarded emails, and were more likely to use it when emailing multiple people. However, participants did not like the dynamic nature of the list. Lists that change order are hard to use because the spatial memory of where every item can be found is lost. Even so, some users learned to trust the dynamic list and found it useful.
4
Summary and Next Steps
Our underlying model of the user’s social network appears to be reasonably accurate, and people particularly liked the Personal Map sector view. However, people did not use the Personal Map application, at least in part because it was not integrated into an email client. We attempted to incorporate some of the importance and grouping information into a dynamic list of related contacts, however people did not care for the way the list changed order.
We are currently exploring better UIs for representing these dynamic relationships and groups. See Figure 5.
Figure 5: New iterations of the user interface, including alphabetical contact list and profile.
In our most recent user interface, we provide a list of the twenty most important people. The list is arranged alphabetically, for ease of scanning and stability over time, and the importance of each contact is shown through gradations in color. We integrated the Personal Map view into a standard profile user interface, to highlight each contact’s position in the user’s social network.
Our next steps will involve performing user tests on our new user interfaces, both in a desktop application and integrated into an email client. In the context of an email client, our importance and grouping information may be further used to help sort and prioritize emails and IM notifications, and populate auto-complete lists.
5
Conclusions
The Personal Map provides a visualization of the user’s social network without requiring the user to engage in any explicit contact management. The Personal Map automatically models who is important to the user, and how the user groups contacts, based on the user’s email behavior. A user test indicated our models were meaningful and accurate to users, and that users found the Personal Map compelling. Though some improvements are possible, we have a good infrastructure for generating social networks automatically.
Our first attempt to incorporate these models into an email client brought mixed results. Although our dynamic list of related contacts was used on average in 12% of new and forwarded emails, people did not care for the dynamic list as much as they cared for the Personal Map’s sector view. We are currently exploring other ways to represent the user’s dynamic relationships and groups.
References
Apperley, M.D. & Spence, R.(1989), Lean cuisine: a low-fat notation for menus, Interacting with Computers 1(1), 43-68.
Benbow, C.P. & Stanley, J.C. (1980), Sex Differences in mathematical ability: fact or artifact, Science, 210, 1262-4.
Card, S.K., Moran, T.P. & Newell, A. (1983), The
Psychology of Human-Computer Interaction,
Lawrence Erlbaum Associates.
Aldenderfer, M. and Blashfield, R. (1974). Cluster Analysis. Iowa City: Sage Publications.
Donath, J., Karahalio, K., and Viegas, F. (1999). Visualizing Conversation. In Proceedings of HICSS-32, Hawaii.
Ducheneaut, N., and Bellotti, V. (2001). E-mail as Habitat: An exploration of Embedded Personal Information Management. Interactions, September-October 2001, pp 30-38.
Eick, S., and Wills, G. Navigating Large Networks with Hierarchies. In Card, S. , MacKinlay, J., and Schneiderman, B. (eds.) Readings in Information Visualization: Using Vision to Think. Morgan Kaufmann Publishers, CA. 1999.
Freeman, L. C. Visualizing Social Networks. Journal of Social Structure, 1, 2000.
Guibas, L. and Stolfi, J. (1985). Primitives for the manipulation of general subdivisions and the computation of Voronoi diagrams. In ACM Transactions on Graphics, 4:74-123.
Kamada, T., & Kawai, S. (1989). An Algorithm for drawing general unidirected graphs. Information Processing Letters, 31, p. 7-15.
Nardi, B., Whittaker, S., Isaacs, E, Creech, M., Johnson, J., and Hainsworth, J. (2002). Integrating Communication and Information through ContactMap. Communications of the ACM, April, 45, 4, pp. 89-95.
Sack, W. (2000). Discourse Diagrams: Interface Design for Very Large-Scale Conversations. In Proceedings of HICSS-33, Hawaii.
Smith, M. and Fiore, A. (2001) Visualization Components for Persistent Conversations. In Proceedings of CHI 2001, Seattle.
Thomas, P.J., and Meech, J. F. Person information management: applying HCI techniques to develop usable personal technology. Proceedings of HCI’94, Glasow, 1994.
Wasserman, S., & Faust, K. (1994) Social Network Analysis: Methods and Applications. Cambridge, UK: Cambridge University Press.
Whittaker, S., and Sidner, C. Email overload: Exploring Personal Information Management of Email. Conference proceedings on Human Factors in Computing Systems, Vancouver, 1996.