Malware Detection in the Cloud under Ensemble
Empirical Mode Decomposition
Angelos K. Marnerides
∗§, Petros Spachos
†, Periklis Chatzimisios
‡, and Andreas U. Mauthe
§ ∗School of Computing & Mathematical Sciences, Liverpool John Moores University, Liverpool, UK†Department of Electrical & Computer Engineering, University of Toronto, Toronto, ON, Canada [email protected]
‡Department of Informatics, Alexander TEI of Thessaloniki, Thessaloniki, Greece [email protected]
§InfoLab21, School of Computing & Communications, Lancaster University, Lancaster, UK a.marnerides2,[email protected]
Abstract—Cloud networks underpin most of todays’ socio-economical Information Communication Technology (ICT) envi-ronments due to their intrinsic capabilities such as elasticity and service transparency. Undoubtedly, this increased dependence of numerous always-on services with the cloud is also subject to a number of security threats. An emerging critical aspect is related with the adequate identification and detection of malware. In the majority of cases, malware is the first building block for larger security threats such as distributed denial of service attacks (e.g. DDoS); thus its immediate detection is of crucial importance. In this paper we introduce a malware detection technique based on Ensemble Empirical Mode Decomposition (E-EMD) which is performed on the hypervisor level and jointly considers system and network information from every Virtual Machine (VM). Under two pragmatic cloud-specific scenarios instrumented in our controlled experimental testbed we show that our proposed technique can reach detection accuracy rates over 90% for a range of malware samples. In parallel we demonstrate the superiority of the introduced approach after comparison with a covariance-based anomaly detection technique that has been broadly used in previous studies. Consequently, we argue that our presented scheme provides a promising foundation towards the efficient detection of malware in modern virtualized cloud environments.
Index Terms—Malware Detection, Empirical Mode Decompo-sition, Cloud computing, Anomaly Detection
I. INTRODUCTION
In recent years, cloud networks have emerged as vital com-ponents that contribute to the adequate operation of heavily intensive data processing and management tasks that provide the foundation for a number of always-on services offered to the end-user. There have been extremely large investments from companies such as Google, Facebook, eBay, Microsoft and Yahoo! on their data centers in order to support cloud services that aim to exploit all the capabilities offered by vir-tualized environments [1]. Nevertheless, as pointed in [3] cloud environments are subject to a number of security threats that aim to exploit security holes contained within their intrinsic capabilities such as service transparency and elasticity. Hence, a great challenge that persists in cloud networks is related with the adequate detection of anomalous activities caused either by legitimate or malicious intent. In particular, the detection of
malware is extremely critical since malware is in the majority of cases the first point of initiation for larger attacks such as Distributed Denial of Service (DDoS) [2].
Given the rapid and fairly recent emergence on large-scale deployments of cloud services, cloud security and particularly malware detection has not yet been excessively addressed by the research community. A significant portion of studies that attempted to formulate security mechanisms (e.g. [4], [5]) aimed to adjust the performance of traditional Intrusion Detection Systems (IDS) under signature rule-based strategies that employ Deep Packet Inspection (DPI) on network packets. In parallel, work in [6], [7] managed to monitor system-related features on the Virtual Machine (VM) level by employing Virtual Machine Introspection (VMI) methods in order to analyse and detect threats on the VM Operating System (OS). Despite some important experimental outcomes derived by the aforementioned studies, none of them aimed to manifest a holistic detection strategy that considers both system and network information as seen on each VM. Moreover, the greatest majority of these studies were instrumented by rule-based detection policies that depend on pre-defined signatures. Hence, their ability at adapting on new types of anomalies which are anticipated to appear in cloud environments [3] is extremely limited. Therefore, some approaches went be-yond the pitfalls of signature-based techniques and composed strategies that rely on statistical anomaly detection schemes (e.g. [2], [8], [9]). However, as with signature-based techniques these approaches addressed (up to a reasonably good level) the identification and detection of anomalies by considering only a single source of information which was either from the network or the system.
In this paper, we provide a malware detection methodology that considers both system and network information as gath-ered by the hypervisor level of a physical node where multiple VMs operate. Within a controlled experimental cloud testbed we report results that consider the scenario of detecting the Kelihos and Zeus malware samples under two pragmatic cloud scenarios which have been derived after fruitful discussions with real cloud operators. We have selected these particular
malware samples and their variants since it has been identified as quite recent and evolving threats for a range of Windows OS flavors that have already compromised more than 3.6 million machines worldwide between 2010 and 2014 due to their varying and sophisticated evasion techniques as well as their stealthy propagation1. Nonetheless, in order to comply with the
requirements derived by discussions with cloud operators we initially perform VM “sanitization” by detecting these types of malware on a static scenario without live migration and we subsequently emulate migration of an infected VM between two physical hosts. The novelty behind our scheme lies on the consideration of both system and network monitoring at the hypervisor level of a physical node that runs multiple VMs. In addition we further contribute by illustrating the composition of a generic anomaly detection framework that can sufficiently aid malware detection in the cloud and we show its superiority over a commonly used Covariance-based approach. The introduced detection method depends heavily on the data-driven Ensemble Empirical Mode Decomposition (E-EMD) algorithm in order to first characterize each individ-ual network or system feature since most of them demonstrate highly non-linear and non-stationary properties. To the best to our knowledge this particular algorithm has not been used in the context of cloud networks and explicitly for the aspect of malware detection and we argue that the results reported herein also justify its superiority from commercial IDS-based solutions since the overall detection scheme does not rely on a-priori knowledge of malware signatures.
The remainder of this paper is structured as follows: Sec-tion II describes the data and the experimental scenarios employed in our work whereas section III provides a brief description of the E-EMD-based and the Covariance-based detection methodologies as well as the metrics for assessing their performance. Section IV is dedicated at discussing the results obtained throughout our analysis. Finally, section V summarizes and concludes this paper.
II. DATA& EXPERIMENTALSETUP
The conducted experiments were achieved within a con-trolled environment in order to regulate them and have a robust ground truth regarding the normal behaviour of our setup in the same way that cloud providers have this em-pirical knowledge in real intra-cloud settings. Both scenarios described in this section were based on discussions we had with operators from cloud providers in the UK as being part of the activities of the India-UK Advanced Technology Centre (IU-ATC) project [10].
A. Data Measurements
Through our previous work in [2] we have managed to build a measurement and monitoring facility using a range of
moni-1The Kelihos malware has been firstly detected in 2010 and since then it
has evolved with new variants that perform a range of attacks such as phishing and spamming [12]. The first Zeus malware instant was detected in 2010 [14] but since then there is a plethora of new variants that even recently (July 2014) compromised millions of machines and enabled a botnet that could steal sensitive banking information [13].
toring and post-processing scripts that employ Virtual Machine Introspection (VMI) in order to gather system-specific features (e.g. process list, count of threads etc.) for every VM that runs on a given physical host. In parallel, we were able to capture volume-based network traffic features (e.g. counts of packets/bytes, flows) from every VMs’ network interface and further aggregate that information with the system features gathered by our VMI approach. Hence, our dataset can be seen as a joint set of a total of 55 network and system features on the hypervisor level that gives a summarizing measurement view for every VM under a sampling rate of 3 seconds for each measurement2.
B. Static Malware Analysis: Experimental Setup
An initial concern of any cloud provider relates with the aspect of VM “sanitization” in order to comprehend the system and network features of a running VM and further identify on whether it is infected with malware or any malicious process. Thus, our first experiment explicitly addresses this aspect by injecting malware on a given VM that provides an HTTP service to multiple client requests.
Overall, this experiment lasted for 10 minutes and we have injected the Kelihos and Zeus malware on separate experi-mental runs around the9thminute. As indicated by Fig. 1 the testbed for the static malware analysis is composed of a single physical node (Host A) running multiple VMs. The host runs Xen 4.1 [15] with the XAPI toolstack and Ubuntu 12.10 Linux as the hypervisor (i.e. dom0 in Xen terminology) operating system. The VMs used for testing were running Windows XP (SP3) with some regular user activity (e.g. Internet browsing) and the VM that was infected provides HTTP service by virtualizing an HTTP Apache server. In order to generate some realistic background traffic we have written some custom scripts on other hosts within the same LAN that enable the random generation of HTTP requests to that server3. Given the earlier description of our data measurements (section II-A), we obtained a joint network and system dataset that represented the aggregate of activities in all the VMs running on Host A and we have subsequently analysed the dataset based on the methodology that we describe in section III.
C. Malware Analysis & VM migration: Experimental Setup
Cloud providers are heavily concerned with the security implications disclosed under the scenario of VM/service “live” migration from one physical host to the other. In contrast with “cold” migration, live migration is an extremely important functionality contained within any cloud resource manage-ment strategy and is mainly executed for resource allocation purposes on real time. We have explicitly aimed to emulate live migration since the greatest majority of commercial cloud
2The 3 seconds sampling rate was the lowest sampling rate that could
be achieved by the Volatility [11] tool and, thus, we had also to adjust our network measurements on that rate.
3The employed client scripts were mainly derived by the implementation
of iperf clients and they included random bursty and “lightweight” requests with varying content and flow size.
VM - HTTP Server
Local Area Network (LAN)
HTTP Requests
HTTP Requests
Host A VM - Windows
Fig. 1. Visualization for the experimental setup for static malware analysis.
Host A Host B
VM - HTTP Server
Local Area Network (LAN)
HTTP Requests VM - HTTP Server Management Host Migration req. VM migration Host A HTTP Requests Host B
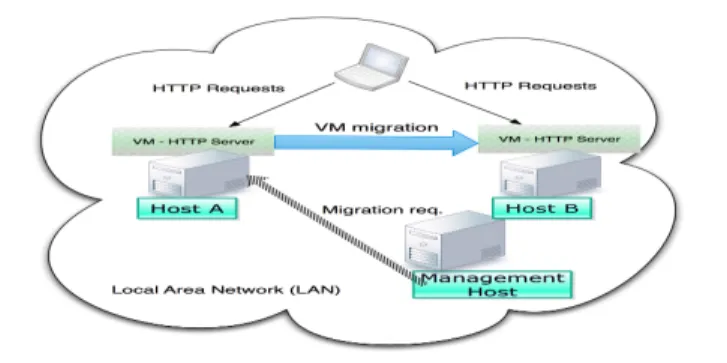
Fig. 2. Visualization for the experimental setup for malware analysis under VM migration.
management software (e.g. VMWare VSphere [16]) employ this functionality by default.
Each experimental run under the migration scenario had a total duration of 20 minutes and malware was injected on Host A around the 5th minute whereas the live migration to host B for the VM that run the HTTP server was initiated on the 9th minute. As Fig. 2 demonstrates, the testbed for the migration scenario consists of four physical nodes where one of them emulates the management entity and is in charge of regulating the migration activities between Host A and Host B. The management host as well as hosts A and B run Xen 4.1 with the XAPI toolstack having Ubuntu 12.10 Linux as the hypervisor operating system. Similarly with the static analysis experiment described earlier (section II-B) we created custom scripts running on a different machine that were randomly generating HTTP requests to the HTTP server that run on the dedicated VM on Host A. The resulting dataset was composed by the aggregation of the measurements obtained from both hypervisors on hosts A and B and also the tcpdump logs captured at the network interfaces of all the VMs residing on each host.
III. METHODOLOGY
This section describes the basic principles behind the proposed E-EMD-based detection technique as well as the covariance-based approach used for comparison. In addition, this section also presents the detection performance metrics used throughout the evaluation of this work.
A. EMD & E-EMD Overview
The Ensemble Empirical Mode Decomposition (E-EMD) technique has been used in a range of studies for signal analysis (e.g. [18], [17]) and is derived by the Empirical Mode Decomposition (EMD) algorithm that was firstly proposed as a fundamental building block of the Hilbert-Huang trans-form [19]. Overall, the EMD algorithm is a data-driven method that can sufficiently decompose and describe non-linear and non-stationary data. Hence, they can extract meaningful insight regarding the internal structure of a given signal or timeseries that represent data measurements. In particular, it considers the local characteristics (i.e. local minima, maxima and envelopes) of a signal on a given time window and further decomposes it into a small number of Intrinsic Mode Functions (IMFs) that
yield intantaneous frequency representations with respect to time. A new mode is considered as an IMF if it satisfies two conditions: i) equality or difference at most by one between the number of extrema and the number of zero crossings; and ii) throughout the whole signal the mean value of the upper and lower envelopes is zero.
We particularly use the E-EMD algorithm due to its adaptive properties at robustly decomposing stationary and non-linear timeseries that hold several subsequent flat values for some time intervals. The E-EMD overcomes the EMD al-gorithm due to its incorporation of the measurement noise factor, thus acting as a Noise-Assisted-Data-Analysis (NADA) technique.
The initial step of E-EMD is to treat a measurements timeseries (e.g. the counts of memory reads/writes, the count of network packets on the VMs network interface) as a signal x(t) that is composed as an amalgamation of several observations alongside a measurement random noise for each observation each time such as thejth ”artificial” observation may be denoted as:
xj(t) =x(t) +wj(t) (1) Subsequently the E-EMD algorithm aims to decompose x(t) into a sum of IMFs as follows:
x(t) = n
X
j
hj+mn (2)
where a given hj is considered as an IMF if it complies with the two conditions mentioned earlier and mn is the residue of x(t) after n IMFs are extracted. However, since the condition investigation as well as the computation of hj and mn is contained within an iterative sifting process [19] we following describe the basic steps behind the E-EMD algorithm as implemented and illustrated in [19], [17], [18]:
1) Considering a signalx(t)with some measurement white noise, identify all minima and maxima points.
2) Interpolate4between minima and maxima in order to end
up with envelopesemin(t)andemax(t).
3) Compute the mean :m(t) =emax(t) +emin(t)/2. 4) Compute detail:h(t) =x(t)−m(t).
0 5 10 15 20 25 30 35 40 15.5 16 16.5 READS 0 5 10 15 20 25 30 35 40 −0.2 0 0.2 IMF 1 0 5 10 15 20 25 30 35 40 −0.5 0 0.5 IMF 2
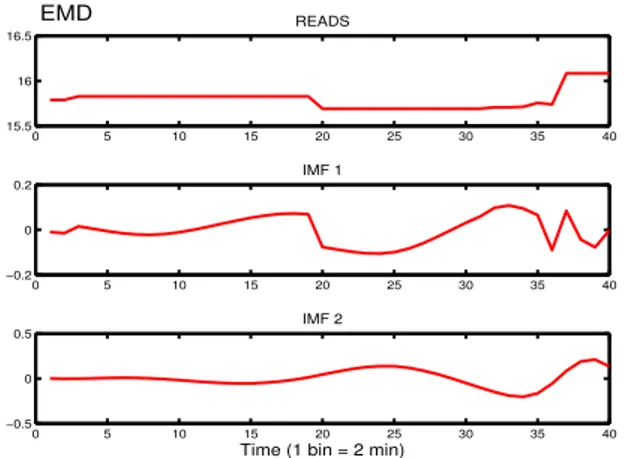
Time (1 bin = 2 min) EMD
Fig. 3. Decomposition of the count of system reads measurements on a given VM under the classical EMD.
0 5 10 15 20 25 30 35 40 15.5 16 16.5 READS 0 5 10 15 20 25 30 35 40 −0.5 0 0.5 IMF 1 0 5 10 15 20 25 30 35 40 −0.5 0 0.5 IMF 2 0 5 10 15 20 25 30 35 40 15.6 15.8 16 IMF 3
Time (1 bin = 2 min) E−EMD
Fig. 4. Decomposition of the count of system reads measurements on a given VM under E-EMD.
5) Iterate on residual m(t) until h(t) is zero mean and considered as an IMF based on the sifting process. 6) Go back to step 1 until 5 with different noise series. 7) Obtain the (ensemble) means of corresponding final IMFs
and finish the process.
In order to illustrate the effectiveness of E-EMD over the traditional EMD and further justify its employment within our detection approach, we provide Fig. 3 and Fig. 4 that demonstrate the decomposition of a given measurement time-series that describes the average number of memory reads on a given VM. It is clearly evidenced that the original raw signal depicted on the top plots in both Fig. 3 and Fig. 4 holds flat properties and as anticipated the traditional EMD algorithm could not adequately narrow down that signal in descriptive IMFs that reach to a monotonic function. In more detail, the EMD algorithm has produced two IMFs where the last one is not fully considered as an absolute monotonic function. On the other hand, the decomposition conducted under the E-EMD approach has demonstrated a much improved analysis and produced one more IMF where the last one results into a monotonic function.
B. Anomaly Detection method
1) General notation: The overall behaviour of a hypervi-sor M for the full experiment with durationT is determined by the sum of all the measurement snapshots gathered from each individual VM that run on the same physical node where the hypervisor operates:
M =
T
X
t=1
V M(t) (3)
We define a snapshot of measurements on a given VM on time
t as follows: V M(t) = f1(τ) f2(τ) · · · fn(τ) .. . ... . .. ... f1(t) f2(t) · · · fn(t) (4)
whereτ is the sampling rate which in our experiments was 3 seconds,tis a complete snapshot of 1 minute andndetermines
the number of features which in our case were 55. Thus, each column on a VM snapshot represents the timeseries for a given feature f.
2) Normal Behaviour Composition: As already
men-tioned in section II, both our experiments were conducted within a controlled environment, thus for both scenarios we could initially gather and characterize normal activity VM snapshots before the Kelihos malware was injected. Overall, our aim was to compose a descriptive statistical threshold that describes normal operation on the hypervisor level. Hence, we firstly estimate the corresponding IMFs based on the E-EMD algorithm for each ”normal” VM snapshot, we secondy compute the correlation matrix between them and we thirdly establish the normal behaviour threshold based on the sum of the mean correlation matrices.
In more detail, we denote µ to be the mean vector of the resulting snapshot IMFs matrixY(t)5for each feature column f(t) in a V M(t). Having µ for every f(t) we now have a newly composed matrixX(t) = [µ1, µ2,· · ·, µn]that provides a summarizing IMF description for each VM snapshot. Based on X(t) we subsequently compute the reference correlation
Cik in order to quantify the behaviour of VM i with VMk in the same snapshot t that run on the hypervisor M under normal operation. Given this quantification we then compute a reference vector that we use in our anomaly detection phase:
Rnormal(t) =Cik (5)
3) Anomaly Detection Phase: For every newly tested
VM snapshot there is a computation of a distance metric
d(t)that aims to describe the deviation from theRnormal(t) that we presented earlier. Similarly with the first steps in the construction of the normal behaviour, every tested VM snapshot has to firstly be transformed by the E-EMD algorithm
5Due to the fact that some features were shown to be decomposed
by a lesser or one more IMFs than others we had to empirically refine our initial measurement matrix and work on subset matrices that had the same dimensions. After computing the summarizing statistics we could then aggregate all of them together and reconstruct the initial measurement matrix. The notation we use throughout Section III-B assumes that our matrices hold the same dimensions.
and then a summarizing computation of the Rtest(t) has to be performed as done with the Rnormal(t). Given these new estimations we can then compute d(t):
d(t) = k X j=1 Wtr|Cj(t)−Rnormal(t)| (6)
where k is the number of the testing VMs, and Wtr is a weight function that is updated on every newly incoming testing snapshot defined as:
Wtr=Rtest(t)/Rnormal(t) (7) The actual detection of malicious activity on a given VM snapshot is performed by using outlier detection under the Median Absolute Deviation (MAD) test. Hence, a VM is anomalous if:
d(t)> median(Rnormal(t) +φM AD(Rtest(t))) (8) whereφseemed to work well when equal to 4 and
M AD(Rtest(t)) =βmedian(|Rtest(t)−median(Rtest(t))|) (9) whereβ is always equal to1.48.
C. Covariance-based Detection
In the covariance-based approach we comply with earlier studies (e.g. [2], [20]) and we denote fβ be the number of features that compose a vector representing the system or network observation x in such way that x = (f1,· · ·, fβ). Also, let x1,· · · , xn be the number of occurences observed such as xi = (f1i,· · ·, fβi) where f
τ,j
i defines the value of
fi in the jth observation on the time instant τ within the time period Tτ. Given these definitions we aim to describe jointly the system and network observation in the matrix Xτ as follows: Xτ= f1τ,1 · · · fβτ,1 f1τ,2 · · · fβτ,2 .. . . .. ... f1τ,n · · · fβτ,n (10)
WhereXτ has a covariance matrixΣXτ:
ΣXτ = σfτ 1f1τ σf1τf2τ · · · σf1τfβτ σfτ 2f1τ σf2τf2τ · · · σf2τfβτ .. . ... . .. ... σfτ βf1τ σfβτf2τ · · · σfβτfβτ (11)
In parallel, we define the Eucledian distance between two matricesΣXτ with the mean ofΣXτ,µ(ΣXτ)by variableDτ:
Dτ =k ΣXT1 −ΣXT2
−µ(ΣXτ)k (12)
Dτ determines the anomalous activity that persists within the gathered system and network observations. As presented next (i.e. section IV), our experimentation investigated the difference between the covariance matrices produced for each of the 1 minute time bins in order to detect deviations and further pinpoint malware activity.
D. Detection Performance Metrics
The assesment of the accuracy performance for both de-tection schemes was achieved with the employment of five widely used metrics [21] constructed by the counts of the True Positive (TP), False Positive (FP), True Negative (TN) and False Negative (FN) labels on every experimental run. Hence, we computed the accuracy, precision, recall, F-score and G-mean as follows:
Accuracy= T P+T N T P +T N+F P+F N P recision= T P T P +F P Recall= T P T P +F N F score= 2× P recision×Recall P recision+Recall
G mean=√P recision×Recall
(13)
IV. RESULTS
A. Static Malware Detection
Based on the experimental setup described in section II-B we have assessed both the E-EMD-based and the Covariance-based detection approaches under the “static” scenario where a malware instance is injected on a running VM. As illustrated by both Fig. 5 and Fig. 6 it is fairly evidenced that the sug-gested E-EMD-based scheme produces much higher detection accuracy than the Covariance-based technique.
We witness that the findings for the E-EMD-based approach as depicted on Fig. 5 demonstrate an average of approximately 90% of detection accuracy throughout all the performance metrics. Our proposed scheme could adequately detect the existence of the Kelihos malware with a 100% accuracy in all metrics where the Covariance-based approach as shown via Fig. 6 produced dissapointing results with an overall accuracy of 48%. The highest achieved metric for the Covariance-based technique was precision with 60% which consequently means that there is low confidence on whether a flagged anomalous observation is in reality anomalous due to malware activities and in parallel if an anomalous event is truly anomalous. This observation is also justified by the remaining detection performance metrics of Recall, F-score and G-mean where the Covariance-based technique had on average a performance lower than 55%.
Similarly, the detection of the three Zeus variants has shown to be more efficient under the employment of the introduced E-EMD-based approach since it has produced extremely better results than the compared Covariance-based approach. In particular, it was feasible to detect all three Zeus variants with an overall accuracy of approximately 90%. Regardless of the relatively lower Precision and Recall values obtained for the first and the second variant of the Zeus malware (≈85%), the robustness of the overall detection scheme is justified through
Accuracy Precision Recall F−score G−Mean 0 10 20 30 40 50 60 70 80 90 100
E−EMD Detection Performance
Classification Performance %
Kelihos Zeus(variant1) Zeus(variant2) Zeus(variant3)
Fig. 5. Detection performance for the E-EMD-based detection scheme for the Kelihos malware and for 3 variants of the Zeus malware under a static scenario.
Accuracy Precision Recall F−score G−Mean 0 10 20 30 40 50 60 70 80 90 100
Covariance Detection Performance
Classification Performance %
Kelihos Zeus(variant1) Zeus(variant2) Zeus(variant3)
Fig. 6. Detection performance of the Covariance-based detection scheme for the Kelihos malware and for 3 variants of the Zeus malware under a static scenario. 1 2 3 4 5 6 7 8 9 0 0.5 1 1.5 2 2.5
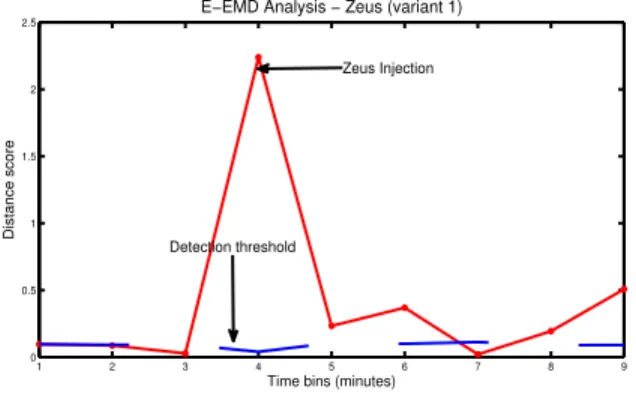
E−EMD Analysis − Zeus (variant 1)
Time bins (minutes)
Distance score
Detection threshold
Zeus Injection
Fig. 7. Example of adaptive threshold while detecting the Zeus malware under the E-EMD-based detection scheme.
the F-score and G-mean metrics which in practise denote a combinatorial performance of Recall and Precision. The lower values for the aforementioned variants is directly related with the explicit operations and activities enforced by those particular malware samples. Both samples had a completely different time-wise execution on the local system and they did not exhibit any networking (e.g. scanning) activity that would naturally effect the distribution of the volume-based network flow features (e.g. counts of packets/bytes) included in the model. Moreover, from the perspective of the system-oriented features (e.g. virtual memory size) the activity of those samples was empirically identifiable only for a small period of time (≈0.5minute) and in contrast with the Kelihos malware they did not indicate a new process initiated but they rather “cannibalized” the explorer.exe process in the Windows OS.
Nonetheless, the performance of the Covariance-based ap-proach as demonstrated in Fig. 6 has shown to be much lower than the introduced E-EMD-based technique. However, in the case of the first Zeus variant it was feasible to reach a score of 100% for Precision which meant that this technique could perfectly match an anomalous event with the malware but on the other hand it exhibited lower values for the rest of the performance metrics, hence it can be considered as unreliable from a general viewpoint.
Overall, we argue, that the E-EMD approach provided better
results than the Covariance-based approach due to its ability at adapting the “normality” threshold according to a weight function Wtr and also the MAD value of a newly tested measurement sample as described earlier (section III-B). Fig. 7 demonstrates this adaptive capability of the suggested scheme by indicating the varying values of the threshold every time a distance score for each measurement interval is computed.
B. Malware Detection under VM/Service Migration
In order to empower our argument regarding the applica-bility of the suggested scheme within cloud settings, both the E-EMD-based and the Covariance-based techniques were assessed under the scenario of VM/service migration. As already mentioned, both algorithms in this scenario consider a much larger volume of observations since there are VM measurements gathered from an extra physical host.
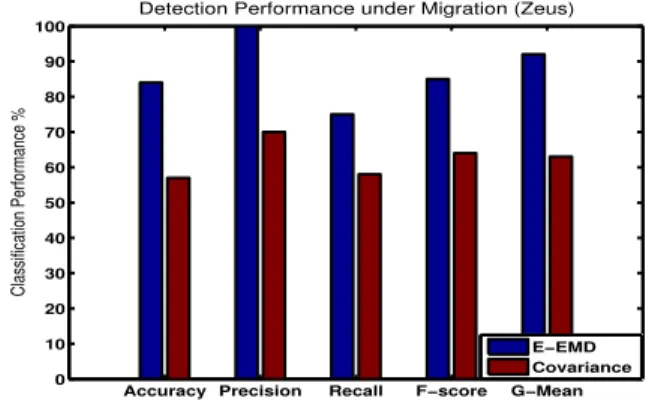
Likewise with the “static” analysis described earlier as justified by the results depicted in Fig. 8 and Fig. 9 we observe that the introduced detection technique produces much better results than the Covariance-based approach. In constrast with the 55% of overall accuracy obtained by the Covariance-based approach for detecting Kelihos, our proposed E-EMD-based technique achieved to reach an accuracy of 90% with perfect Precision of 100% and extremely high F-score and G-mean values of 95% and 94% respectively. Similarly, but with slightly less overall accuracy of 85% and a decreased Recall of 75% our technique achieved to obtain higher Zeus detection results than the Covariance-based approach. Despite the low Recall value, the reliability behind the detection of the Zeus malware is empowered by the relatively high F-score and G-mean values of 89% and 93% respectively.
Given the presented results, we conclude that the E-EMD-based approach performs much better than the commonly used Covariance-based technique and it can surely be considered as a good candidate for detection of malware in virtualized cloud environments. In conjunction with the results obtained from the static malware analysis presented earlier, we also argue that the proposed technique also overcomes the limitations derived by commercial signature-based IDS since it can adequately detect various types of malware that significantly differ in their operations without the need of a pre-known signature.
Accuracy Precision Recall F−score G−Mean 0 10 20 30 40 50 60 70 80 90 100
Detection Performance under Migration (Kelihos)
Classification Performance %
E−EMD Covariance
Fig. 8. Detection performance for the E-EMD-based and Covariance-based schemes for the Kelihos malware under VM migration.
Accuracy Precision Recall F−score G−Mean 0 10 20 30 40 50 60 70 80 90 100
Detection Performance under Migration (Zeus)
Classification Performance %
E−EMD Covariance
Fig. 9. Detection performance for the E-EMD-based and Covariance-based schemes for one of the Zeus malware variants under VM migration. V. CONCLUSIONS
The virtualized nature of the cloud that enables beneficial capabilities for cloud services is also prone to several security threats. In particular, a critical security issue relates with the adequate identification and detection of malware. In this work we demonstrate the applicability of an anomaly detection approach that explicitly addresses the detection of malware and considers the joint network and system representation of a VM from measurements gathered at the hypervisor level.
Due to the fact that the greatest majority of the moni-tored network and system features demonstrate highly non-linear and non-stationary properties, our proposed scheme initially employs the E-EMD algorithm in order to facilitate a robust statistical characterization and decomposition of the measurement signals. We demonstrate the effectiveness of our method under two pragmatic cloud scenarios within a controlled experimental testbed and exhibit the ability of our technique at detecting the Kelihos and Zeus malware in-stances with high accuracy rates. Under a thorough comparison with a commonly used Covariance-based technique this study demonstrates the superiority of the proposed E-EMD-based approach since it has exhibited higher detection accuracy with an average performance of over 90%. The reported results also imply that the introduced detection technique overcomes the limitations of commercial IDS-based solutions since it does not rely on pre-known malware signatures. Overall, we argue that the outcomes of this work will broaden the horizon towards the design of intelligent anomaly detection strategies in cloud environments.
ACKNOWLEDGMENT
The authors would like to thank the UK EPSRC and DST India funded Indian-UK Advanced Technology Centre of Excellence (IU-ATC) and EU FP7 SECCRIT research projects that supported this work.
REFERENCES
[1] Greenberg, A., Hamilton, J., Maltz, D., A., and Patel, P., The cost of a cloud: research problems in data center networks. in ACM SIGCOMM Comput. Commun. Rev. 39, 1, December 2008
[2] Marnerides, A., K., Watson, M., Shirazi, N., Mauthe, A., Hutchison, D., Malware Analysis in Cloud Computing: Network and System Character-istics , in IEEE GLOBECOM CCSNA workshop 2013, Atlanta, USA, December, 2013
[3] Kaufman, L.M., Data Security in the World of Cloud Computing, Security & Privacy, IEEE , vol.7, no.4, pp.61,64, July-Aug. 2009 i
[4] Roschke, S.; Feng Cheng; Meinel, C., Intrusion Detection in the Cloud, IEEE DASC ’09., vol., no., pp.729,734, 12-14 Dec. 2009
[5] A. V. Dastjerdi, K. A. Bakar, and S. G. H. Tabatabaei, Distributed Intrusion Detection in Clouds Using Mobile Agents, In 3rd ADVCOMP-09, pp. 175-180, Sliema, October 11-16, 2009.
[6] Ibrahim, A.S., Hamlyn-Harris, J., Grundy, J., Almorsy, M., CloudSec: A security monitoring appliance for Virtual Machines in the IaaS cloud model, Network and System Security (NSS), 2011 5th International Conference on , vol., no., pp.113,120, 6-8 Sept. 2011
[7] Hay, B., and Nance, K., Forensics examination of volatile system data using virtual introspection, Journal of ACM SIGOPS Operating Systems Review, vol. 42, pp. 74-82, 2008.
[8] Watson, M. R., Shirazi, N., Marnerides, A. K., Mauthe, A., Hutchison, D., Towards a Distributed, Self-Organizing Approach to Malware Detection in Cloud Computing, in 7th IFIP/IFISC IWSOS 2013
[9] Zhang L., Wang J., Lin S., Design of the Network Traffic Anomaly Detection System in Cloud Computing Environment, In 4th International Symposium on Information Sciences and Engineering 2012
[10] The India-UK Advanced Technology Centre Project : http://www.iu-atc. com/
[11] Volatility: https://www.volatilesystems.com/default/volatility
[12] Garnaeva, M. Kelihos/Hlux Botnet Returns with New Techniques. Securelist, http://www.securelist.com/en/blog/655/Kelihos_Hlux_botnet_ returns_with_new_techniques.
[13] Brewster, T. GameOver Zeus returns: thieving malware rises a month after police actions, in the Guardian Newspaper, 11, July, 2014, url : http://www.theguardian.com/technology/2014/jul/11/ gameover-zeus-criminal-malware-police-hacking
[14] Binsalleeh, H., Ormerod, T., Boukhtouta, A, Sinha, P., Youssef, A, Debbabi, M., Wang, L., On the analysis of the Zeus botnet crimeware toolkit, Privacy Security and Trust (PST), 2010 Eighth Annual Interna-tional Conference on , vol., no., pp.31,38, 17-19 Aug. 2010
[15] Citrix Systems, Inc. Xen. http://www.xen.org/.
[16] VMware, Migrating virtual machines in vsphere client, 2010. [Online]: http://pubs.vmware.com/vsphere-51/topic/com.vmware.vsphere. vcenterhost.doc/GUID-3EE13ED8-172F-4560-B806-1E342AD7C486. html
[17] Torres, M.E.; Colominas, M.A.; Schlotthauer, G.; Flandrin, P., A com-plete ensemble empirical mode decomposition with adaptive noise, IEEE ICASSP, 2011, pp.4144,4147, 22-27 May 2011
[18] Fontugne, R.; Tremblay, N.; Borgnat, P.; Flandrin, P.; Esaki, H., Mining anomalous electricity consumption using Ensemble Empirical Mode Decomposition, IEEE ICASSP, 2013, pp.5238,5242, 26-31 May 2013 [19] Wu, Z., and Huang, N., E., Ensemble empirical mode decomposition: A
noise-assisted data analysis method, Advances in Adaptive Data Analysis, vol. 1, no 01, pp-1-41, 2009.
[20] Yeung, D.S., Shuyuan Jin, Xizhao Wang, Covariance-Matrix Modeling and Detecting Various Flooding Attacks, Systems, Man and Cybernetics, Part A: Systems and Humans, IEEE Transactions on , vol.37, no.2, pp.157,169, March 2007
[21] E. Alpaydin, Introduction to Machine Learning (Adaptive Computation and Machine Learning), The MIT Press, 2004.