A Framework of Clustering Based on Chicken Swarm
Optimization
Nursyiva Irsalinda 1, Iwan Tri Riyadi Yanto2, Haruna Chiroma3 ,Tutut Herawan3 1 Mathematics Department, Universitas Ahmad Dahlan, Indonesia
2 Information System Department, Universitas Ahmad Dahlan, Indonesia 3Department of Information System, University of Malaya [email protected], [email protected], [email protected]
Abstract: Chicken Swarm Optimization (CSO) algorithm which is one of the most recently introduced optimization algorithms, simulates the intelligent foraging behaviour of chicken swarm. Data clustering is used in many disciplines and applications. It is an important tool and a descriptive task seeking to identify homogeneous groups of objects based on the values of their attributes. In this work, CSO is used for data clustering. The performance of the proposed CSO was assessed on several data sets and compared with well known and recent metaheuristic algorithm for clustering: Particle Swarm Optimization (PSO) algorithm , Cuckoo Search (CS) and Bee Colony Algorithm (BC). The simulation results indicate that CSO algorithm have much potential and can efficiently be used for data clustering.
Keywords: Clustering; Metaheuristic; Chicken swarm optimization; Ooptimization;
1.
Introduction
Data clustering is the process of grouping together similar multi-dimensional data vectors into a number of clusters or bins. Clustering algorithms have been applied to a wide range of problems, including data mining [6,7], exploratory data analysis, mathematical programming [4, 10] and image segmentation [12]. Clustering techniques have been used successfully to address the scalability problem of machine learning and data mining algorithms, where prior to, and during training, training data is clustered, and samples from these clusters are selected for training, thereby reducing the computational complexity of the training process, and even improving generalization performance [2, 8, 4, 1].
Many clustering methods have been proposed. They are classified into several major algorithms: hierarchical clustering, partitioning cluseting, density based clustering and graph based clustering.
K-means is one of the most popular partitioning algorithm because simple and efficien [6]. Unfortunately, it has disadvantages such as needs to define the number of clusters before starting, its performance depends strongly on the initial centroids and may get trapped in local optimal solutions. To avoid the inconvenience of K-means, several metaheuristic were developed. Most of them are evolutional and populatin based such as Genetic Algorithm (GA), Particle Swarm Optimization (PSO), Bee Colony Algorithm (BCA) and Cuckoo search (CS).
The previous metaheuristic algorithms are single swarm optimization algorithm. Their common essence is to simulate and reveal some natural phenomena and processes developed according to the system initializing a set of initial solution, the operation iterative rules specific for a group of solutions combined with the search mechanism itself are iterative, and finally get the optimal solution [10]. Algorithm to obtain better performance is still being developed. Therefore, in 2014 Xianbing Meng et.al. proposed multi swarm optimization algorithm called Chicken Swarm Optimization (CSO). CSO can achieve optimization results both accuracy and robustness optimization in terms compared to previous single swarm optimization algorithms. So that, to obtain the better performance of clustering, we propose in this paper to use CSO algorithm. The CSO mimicking the hierarchal order in the chicken swarm and the behaviors of the chicken swarm, including roosters, hens and chicks. CSO can efficiently extract the chickens’ swarm intelligence to optimize problems. It is a population based and this algorithms overcomes the problem of local and global optimum.
The remainder of this paper is organized as follows: Section 2 presents the related works. Section 3 provides the cluster analysis. In Section 4 the basics of CSO is presented. The proposed approach for data clustering is explained in Section 5. The detailed experimental results and comparisons are proved in Section 6. Finally, the conclusion of this study and the future work are drawn in Section 7.
2.
Related Works
To overcome the disadvatage of K-means, several metaheuristic were developed. For instance the Genetic algorithm (GA) is evolutionary population optimization based; it uses natural genetics and evolution: selection, mutation and crossover [14]. It is still suffers from the difficulty of coding modelling and the operation of crossover and mutation are too expensive. More over it needs to much parameter to handle. Particle Swarm Optimization (PSO) incorporates swarming behaviours observed in flocks of bird and school of fish. Like GA, it needs much parameter to manipulate. The ant colony algorithm is one another metaheuristic inspired from the behaviour of the real ants to find the shortest path from the nest to the food sources [15][16]. Artificial Bee Colony (ABC) algorithm mimicking the foraging behaviour of honey bee colony. In ABC algorithm, the position of a food source represents a possible solution to the optimization problem and the nectar amount of a food source corresponds to the quality (fitness) of the associated solution. The number of the employed bees or the
onlooker bees is equal to the number of solutions in the population. ABC algorithm has many advantages but it has two major weaknesses: one is slower convergence speed; the other is getting trapped in local optimal value early [12]. Another algorithm for data clustering is based on Cuckoo Search (CS) optimization. Cuckoo is generic and robust for many optimization problems and it has attractionive features like easy implementation, stable convergence characteristic and good computational efficiency. All of the previous metaheuristic algorithms for clustering are single swarm optimization. In 2014 Xianbing Meng et.al. proposed multi swarm optimization algorithm called Chicken Swarm Optimization (CSO). CSO can achieve optimization results both accuracy and robustness optimization in terms compared to previous single swarm optimization algorithms. So that, to obtain the better performance of clustering, we propose in this paper to use CSO algorithm. In this metaheuristic no much parameters is used. We only need to define the group of rooster, hen and chick in the chicken swarm which does not really affect in the results of clustering. More over, the research of the optimal solution is done by mathematical function. In each generation we select the best solution and the next generation calculated by Chicken Swarm Optimization formula. Thereby, we always obtain the optimal solution.
3.
Cluster Analysis
The main goal of the clustering process is to group the most similar objects in the same cluster or group. Each object is defined by a set of attributes or measurements. To determine the similar objects, we use the measure of similarity between them. In this paper we use the Euclidian distance to calculate the similarity between the objects. It is the most popular metric done by this formula:
𝑑𝑖𝑠𝑡𝑎𝑛𝑐𝑒 (𝑜
𝑖, 𝑜
𝑗) = (∑|𝑜
𝑖𝑝− 𝑜
𝑗𝑝|
1 2 𝑚 𝑝=1)
2where: 𝑚 is the number of attributes and 𝑜𝑖𝑝 is the value of the attribute number 𝑝 of the object number 𝑖(𝑜𝑖).
4.
Basic
of
CSO
Chicken Swarm Optimization (CSO) based on the chicken behavior was proposed by meng et al [13]. As in [13], there are at least four rules in the chicken behavior, as follows
(1) In the chicken swarm, there exist several groups. Each group comprises a dominant rooster, a couple of hens, and chicks.
(2) How to divide the chicken swarm into several groups and determine the identity of the chickens (roosters, hens and chicks) all depend on the fitness values of the chickens themselves. The chickens with best several fitness values would be acted as roosters, each of which would be the head rooster
in a group. The chickens with worst several fitness values would be designated as chicks. The others would be the hens. The hens randomly choose which group to live in. The mother-child relationship between the hens and the chicks is also randomly established.
(3) The hierarchal order, dominance relationship and mother-child relationship in a group will remain unchanged. These status only update every several (G) steps.
(4) Chickens follow their group-mate rooster to search for food, while they may prevent the ones from eating their own food. Assume chickens would randomly steal the good food already found by others. The chicks search for food around their mother (hen). The dominant individuals have advantage in competition for food.
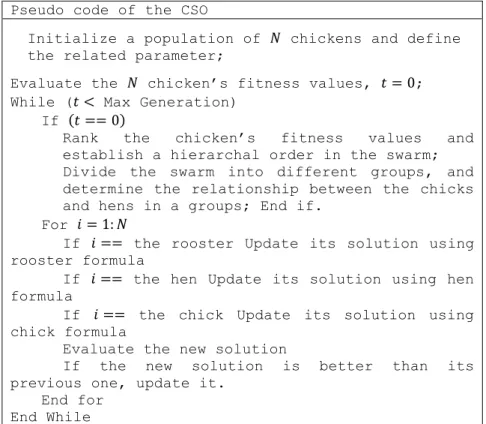
Based on the four rules, the basic steps of the CSO can be summarized by the pseudo code as follows
Pseudo code of the CSO
Initialize a population of 𝑁 chickens and define
the related parameter;
Evaluate the 𝑁 chicken’s fitness values, 𝑡 = 0;
While (𝑡 < Max Generation)
If (𝑡 == 0)
Rank the chicken’s fitness values and
establish a hierarchal order in the swarm; Divide the swarm into different groups, and determine the relationship between the chicks and hens in a groups; End if.
For 𝑖 = 1: 𝑁
If 𝑖 == the rooster Update its solution using
rooster formula
If 𝑖 == the hen Update its solution using hen
formula
If 𝑖 == the chick Update its solution using
chick formula
Evaluate the new solution
If the new solution is better than its previous one, update it.
End for End While
5.
Clustering
based on CSO
To solve data clustering problem, the basic CSO is adapted to reach the centroids of the clusters. For doing this, we suppose that we have 𝑛 objects and every objects is defined by 𝑚 attributes. In this study, the main goal of the CSO is to find 𝑘 centroids of clusters which minimize the Eq (2). The data set must be represented by a matrix
(𝑛, 𝑚), such as the row-𝑖 corresponds to the object number.
In the CSO mechanism, the solution are the chicken and each chicken is representated by a matrix with 𝑘 rows and 𝑚 colomns, where the matrix rows are the centroids of cluster.
We propose a CSO algorithm for data clustering throught the following steps: 1. Generate randomly Initialize a population of 𝑁 chickens
2. Evaluate the 𝑁 chicken’s fitness values
3. Determine the relationship between the rooster, chicks and hens in a groups. 4. Calculate the fitness value of the new solutions.
5. Compare the new solutions with the old one, if the new solution is better than its previous one, replace the old solution by the new one.
6. Find the best solution End While;
7. Print the best solution.
6.
Experimental result
In order to test the validity and the efficiency of the proposed approach, We elaborate the four approaches through the UCI benchmark datasets. The result of a clustering algorithms are be evaluated and validated by internal and external validity [22]. The external is used to analyze the cluster in this study is Rand Measure. The adjusted Rand index [15] is the corrected-for-chance version of the Rand index that computes how similar the clusters (returned by the clustering algorithm) are to the benchmark classifications. The Adjusted Rand Index as follows
𝑅𝐼 = ∑ ∑ (𝑛𝑖𝑗 2) − ( 𝑛 2) −1 𝐾 𝑗=1 𝑚 𝑖=1 ∑ ( 𝑛𝑖. 2) 𝑚 𝑖=1 ∑ ( 𝑛.𝑗 2) 𝐾 𝑗=1 1 2[∑ ( 𝑛𝑖. 2) + ∑ ( 𝑛.𝑗 2) 𝐾 𝑗=1 𝑚 𝑖=1 ] − ( 𝑛 2) −1 ∑ (𝑛2𝑖.) ∑ (𝑛.𝑗 2) 𝐾 𝑗=1 𝑚 𝑖=1
where 𝑛𝑖𝑗 represent the number of objects that are in predefined class 𝑖 and cluster 𝑗,
𝑛𝑖. indicates the number of objects in a priori class 𝑖, 𝑛.𝑗 indicates the number of objects cluster 𝑗, and 𝑛 is the total number of objects in the data set.
Davies Bouldin index and Dunn index are used to assess the quality of clustering algorithms based on internal criterion. Davies Bouldin index attempts to minimize the average distance between each cluster and the one most similar to it [16]. It is defined as follows 𝐷𝐵 = 1 𝐾∑ maxk≠m( 𝜎𝑘+ 𝜎𝑚 𝑑(𝑐𝑘, 𝑐𝑚) ) 𝐾 𝑘=1
where 𝐾 is the number of clusters, 𝜎𝑘is the average distance of all elements in cluster
𝑘 and 𝑑(𝑐𝑘, 𝑐𝑚) is the distance between cluster 𝑘 and cluster 𝑚. The clustering algorithm that produces a collection of clusters with the smallest Davies–Bouldin index is considered the best algorithm based on this criterion. Dunn’s Validity Index [17] attempts to identify those cluster sets that are compact and well separated. The Dunn’s validation index can be calculated with the following formula
𝐷𝑛 = min 1≤𝑘≤𝐾( min𝑘+1≤𝑚≤𝐾( 𝑑(𝑐𝑘, 𝑐𝑚) max 1≤𝑛≤𝑘𝑑 ′(𝑛))) where 𝑑(𝑐𝑖, 𝑐𝑗) represents the inter cluster distance between cluster 𝑘 and cluster 𝑚. It may be any number of distance measure, such as the distance between the centroids of the cluster. 𝑑′(𝑛) is called the intra cluster distance of cluster 𝑛 that may be measured in variety mays, such as the maximal distance between any pair of element in cluster 𝑛.
6.1 Iris dataset
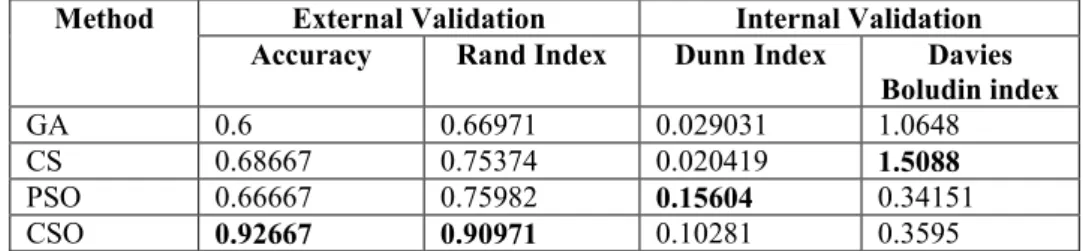
The iris dataset contains 150 objects and 4 attributes which are unscrewed into 3 classes of 50 instances representing a type of iris plant. Table1. shows that the proposed algorithm obtained better performance in terms of accuracy and Rand index. Based on internal validation CSO also has good performance in term of the Dunn’s validity index and Davies Bouldin index.
Table 1.The Evaluation for Iris Data Set
Method External Validation Internal Validation
Accuracy Rand Index Dunn Index Davies
Boludin index GA 0.6 0.66971 0.029031 1.0648 CS 0.68667 0.75374 0.020419 1.5088 PSO 0.66667 0.75982 0.15604 0.34151 CSO 0.92667 0.90971 0.10281 0.3595 6.2 Ecoli Dataset
The Ecoli dataset contains 336 numbers of instances and 7 attributes condition, The data set is classified into 8 classes where each class represent the localization site. The evaluation result is summarized in Table 2. The CSO Algorithm has better performance based on Davies Boulding index, and also still gives good results analyzed by other internal and external validity index.
Table 2. The Evaluation for Ecoli Data Set
Method External Validation Internal Validation
Accuracy Rand Index Dunn Index Davies
Bouldin index GA 0.63988 0.82637 0.057473 0.41989 CS 0.47321 0.74053 0.03733 0.40288 PSO 0.47917 0.7599 0.031671 0.53819 CSO 0.61905 0.76041 0.050097 0.37858 6.3 Ionospehere dataset
The Ionosphere dataset contains 351 number of instances and 34 predictor attributes. The data is classified into binary classes either “good" or "bad". The computation result shows that the CSO has better performance in term of internal validity and external validity. The summary of the experiment result is illustrated in table 3. .
Table 3. The Evaluation for Ionosphere Data Set
Method External Validation Internal Validation
Accuracy Rand Index Dunn Index Davies
Boludin index
GA 0.62393 0.52938 0.026323 1.6593
CS 0.59829 0.51795 0.030362 0.95699
PSO 0.66952 0.55621 0.047005 1.1032
CSO 0.7208 0.59635 0.0356 1.6748
6.4 Cancer data set
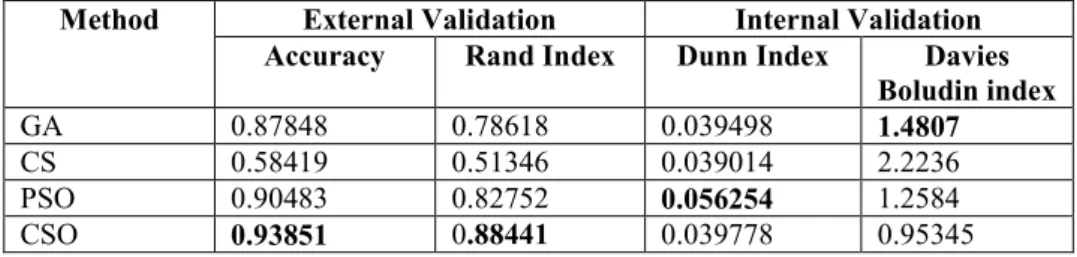
The Cancer data set represent the Wisconsin breast cancer dataset. The data contains 683 instances with 9 features. Each instance has one of two possible classes beingn or malignant. The experiment results are summarized in the table 4 which is showing that the CSO give better performance.
Table 4. The Evaluation for CancerData Set
Method External Validation Internal Validation
Accuracy Rand Index Dunn Index Davies
Boludin index
GA 0.87848 0.78618 0.039498 1.4807
CS 0.58419 0.51346 0.039014 2.2236
PSO 0.90483 0.82752 0.056254 1.2584
7.
Conclussion
In this paper, we have presented a new approach for solving the data clustering problem. The approach principally based on the chicken swarm optimization. The proposed algorithm is applied to four different data sets. Simulation experiments show that the proposed approach obtains the better results in term of the internal and external validity. In order to improve the performance and as a future works, we plan to hybridize to other algorithm and also we still consider to apply the algorithm into the other real dataset.
References
[1]
A.P. Engelbrecht. “Sensitivity Analysis of Multilayer Neural Networks”, PhD Thesis, Department of Computer Science, University of Stellenbosch, Stellenbosch, South Africa, 1999. [1][2] D. Fisher, “Knowledge Acquisition via Incremental Conceptual Clustering”, Machine Learning, Vol. 2, pp 139-172, 1987. [2]
[3] D. Karaboga and B. Akay, "A comparative study of Artificial Bee Colony algorithm,"
Applied Mathematics and Computation , vol. 214, pp.108-132, 2009.
[4] G. Potgieter, “Mining Continuous Classes using Evolutionary Computing”, M.Sc Thesis, Department of Computer Science, University of Pretoria, Pretoria, South Africa, 2002. [5] H.C. Andrews, “Introduction to Mathematical Techniques in Pattern Recognition”, John
Wiley & Sons, New York, 1972.
[6] I.E. Evangelou, DG Hadjimitsis, AA Lazakidou, C Clayton, “Data Mining and Knowledge Discovery in Complex Image Data using Artificial Neural Networks”, Workshop on Complex Reasoning an Geographical Data, Cyprus, 2001.
[7] J.R. Quinlan, “C4.5: Programs for Machine Learning”, Morgan Kaufmann, San Mateo, 1993.
[8] K. Premalatha, “A New Approach for Data Clustering Based on PSO with Local Search”,
Computer and Informations Sciences, Vol. 1, No. 4, pp. 139-145, November.2008.
[9] L-Y. Chuang, Y.D. Lin and C.H. Yang, “An Improved Particle Swarm Optimization for Data Clustering, ” in Proceedings of The International Multi Conference of Engineers and Computer Scientist (IMECS) 2012, Vol. 1, March, 14-16 , 2012. Hongkong.
[10] M.R. Rao, “Cluster Analysis and Mathematical Programming”, Journal of the American Statistical Association, Vol. 22, pp 622-626, 1971. [10]
[11] Q. Bai, “ Analysis of Particle Swarm Optimization Algorithm,” Computer and Information Science, Vol.3, no. 1, pp.180-184, 2010.
[12] T. Lillesand and R. Keifer, “Remote Sensing and Image Interpretation”, John Wiley & Sons, 1994.[12]
[13] X. Meng, Y. Liu, X. Gao, and H. Zhang, “A New Bio-inspired Algorithm: Chicken Swarm Optimization,” in Advances in Swarm Intelligence SE - 10, vol. 8794, Y. Tan, Y. Shi, and C. C. Coello, Eds. Springer International Publishing, 2014, pp. 86–94.
[14] X.-S. Yang and X. He, “Bat Algorithm: Literature Review and Applications,” Int. J. Bio-Inspired Comput., vol. 5, no. 3, pp. 141–149, Jul. 2013.
[15] Hubert, L., & Arabie, P. (1985). Comparing partitions. Journal of Classification, 2(1), 193–218. http://doi.org/10.1007/BF01908075
[16] Davies, D. L., & Bouldin, D. W. (1979). A cluster separation measure. IEEE Transactions on Pattern Analysis and Machine Intelligence, 1(2), 224–227.
[17] Dunn†, J. C. (1974). Well-Separated Clusters and Optimal Fuzzy Partitions. Journal of Cybernetics, 4(1), 95–104. http://doi.org/10.1080/01969727408546059