HAL Id: hal-02410372
https://hal-univ-pau.archives-ouvertes.fr/hal-02410372
Submitted on 21 Jan 2020
HAL
is a multi-disciplinary open access
archive for the deposit and dissemination of
sci-entific research documents, whether they are
pub-lished or not. The documents may come from
teaching and research institutions in France or
abroad, or from public or private research centers.
L’archive ouverte pluridisciplinaire
HAL
, est
destinée au dépôt et à la diffusion de documents
scientifiques de niveau recherche, publiés ou non,
émanant des établissements d’enseignement et de
recherche français ou étrangers, des laboratoires
publics ou privés.
Modelling Learner’s Perseverance in Education Software
Timothée Duron, Laurent Gallon, Philippe Aniorte
To cite this version:
Timothée Duron, Laurent Gallon, Philippe Aniorte. Modelling Learner’s Perseverance in Education
Software. Information Systems Education Conference (ISECON 2019), Apr 2019, Galveston, United
States. �hal-02410372�
Modeling Learner’s Perseverance in Software
Engineering Education
Timoth´
ee DURON
∗, Laurent GALLON
∗, Philippe ANIORTE
∗∗ Laboratoire Informatique de l’Universit´e de Pau et des Pays de l’Adour (LIUPPA)
UNIV PAU & PAYS ADOUR - E2S UPPA, EA3000, 40000 Mont-de-Marsan, FRANCE
{timothee.duron, laurent.gallon, philippe.aniorte}@univ-pau.fr
Abstract—With the arrival of digital tools, education re-search is evolving thanks to Technology Enhanced Learning Systems. These latter are becoming more and more person-alized taking into consideration the student’s performance. However, a significant rate of dropout is often observed. In this paper, we address the question: How to keep students engaged in their learning processes ? Our purpose is to model student’s perseverance, through student-mouse interactions, in order to adapt his/her curricula depending on his/her motivation. Our solution is based on Model Driven Engineering concept to ensure reusability and automatic computations.
Index Terms—perseverance modeling, Model Driven Engi-neering ,motivation, student-mouse interaction, adaptive learn-ing
I. Introduction
Educational research is constantly developing, in par-ticular with the integration of new technologies such as digital tools, the Internet, etc [1]. The French PERSE-VERONS1 project tries to answer the following question: What impact can numerical tools have on learning and in particular on the perseverance of students? Our team works on modeling perseverance, focusing on the interac-tion between the student and a digital learning tool. The main goal is to automatically adapt the curricula proposed by this tool taking into consideration the measure of per-severance of learners, in order to keep them engaged. By adapting we mean, choosing correctly the next pedagogical situation. From a Computer Science point of view, the addressed challenge is the modeling of perseverance, based on the use of mouse and keyboard.
The originality of our proposition is that it is based on a multidisciplinarity approach : educational theories (model of curricula), psychological theories (model of perseverance) and Model Driven Engineering concepts (automatic computation of models).
In the following, section II gives a short state of the art about school perseverance in both domains of Education Science/Psychology and Computer Science. Section III follows up with our approach in modeling school perse-verance as a Computer Science model, and how it can be used for example in a Technology Enhanced Learning System. Section IV concludes and gives some perspectives.
1This project was supported by French PIA2 E-FRAN program,
and granted by Caisse des D´epots et Consignation (CDC) and the Conseil D´epartemental des Landes.
II. Background and related Works
In this section, we first introduce some theories of Education Science and Psychology, related to perseverance and motivation. This part is essential, because we need to base our works on sound theoretical foundations. We take here the definition of perseverance like being motivated in time[2]. The second part of this section is dedicated to related works in Computer Science.
A. Education Science and Psychology
Several researches have been conducted in the literature to understand the learning process and how to motivate students and continue to attract their attention. We highlight here some of them.
1) The motivational dynamics: according to R. Viau [3], the student’s perception of a pedagogical activity is one of the most important keys of motivation. Indeed, the motivation and the cognitive engagement depend on the student’s perception of the pedagogical activity. Viau describes three kinds of perceptions: Value (what does this activity represent for the student?); Controllability (does the student have a choice whether he do the task or not?); Competence (does the student have the necessary competence to accomplish the activity?). While constructing its pedagogical sequence, the teacher needs to take these three perceptions into account. To do so, Viau [3] describes 10 pedagogical criteria to meet an assessment of these perceptions. It permits the teacher to construct an ’a priori’ motivating learning activity.
2) The Self Determination Theory (SDT): is based on the innate psychology needs of: autonomy (need of being actor of his/her own life, make his own choice according to his/her preference), competence (need of control and be competent in domain in which he/she was interested in) and relatedness (need of interact with other people). They can be easily linked to the three perceptions of Viau. SDT also integrates the work of Deci & Ryan [4] on the different kinds of motivation (external, internal etc). It is organized in three levels: global, contextual and situational. Each level describes a different time scale for the evolution of motivation. The global level addresses motivation that comes from the social environment, religion, etc (long time range). For example, if the student’s parents are teachers, then the student will have a good impression of school.
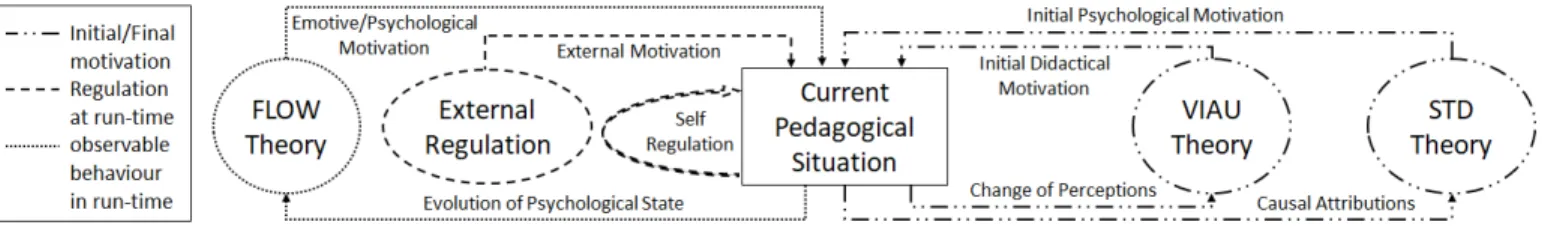
Fig. 1. Federative view centred on the pedagogical situation
The contextual level addresses motivation that comes from the context of the student’s environment (medium time range). For example, if the student has bad results at school, then he will not be motivated by the different topics taught. The situational level addresses motivation from the current situation in which the student is (short time range). If the student likes one sport in specific, even if he has, in general, bad school results, he will be motivated by course of this specific sport.
3) The Flow theory: Mih´aly Cs´ıkszentmih´alyi [5] de-scribes different psychological states people can be in during an activity (fear, boredom, etc). To summarize this theory, a good balance between the needed skills and the proposed challenges is necessary to keep people motivated during an activity. If challenges are too low, the student may get bored. If challenges are too high, then the student may apprehend and panic. The best state for learning is the FLOW state, in which students are completely involved and absorbed in the activity, with a maximum concentration level.
4) The causal attributions theory: [6] proposes to define an ’a posteriori’ assessment attribution for a success or a fail at the end of an activity. Indeed, for each real-life situation, we still need to understand why (Why is this happening to me? Why this result? etc.). To answer these questions, we attribute a cause to each event or result of an activity. To characterize this cause, we need to know : Origin: Is it internal or external? Is it our responsibility or not?; level of controllability: Is it controllable or not? Can I have control over it or not?; stability: Is the cause stable in time or not? In a school context, it is important to determine which assignments/attributions a student gives to the result of each learning activity (whether the result is a success or a failure). Bad causal attributions can affect the student’s perceptions of his/her skills/competences and impact his/her motivation in future similar activities. To summarize, in Fig 1 we proposed an integrated view of these previous motivation theories, centred on the pedagogical activity. When a pedagogical activity starts, the student has an initial level of motivation, coming from the structure of the pedagogical activity proposed (Viau theory, didactic, etc), from the context in which the activity is done (SDT theory) and depending on the current psychological state of the student (Flow theory). During the activity, this motivation can change depending
on the interactions with other students or the teacher (external regulation), and the strategy he/she applies to reach the activity goal (self-regulation [7]). It also depends on the difficulties encountered, and the obtained result (success/failures). All these parameters impact his/her psychological state (Flow theory). Finally, at the end of the activity, the student gives causal attributions to its success/failures, which will have an impact on the initial motivation of the next activity.
In the context of our work, we focus on the Flow theory, which addresses the state of mind and change of motivation of the student during an activity. Our purpose is to give us the capacity to detect those changes at ’run-time’, and if necessary get the student back into Flow state.
B. Related Works in Computer Science
In this section, we describe some works related to the evolution, of a student during a pedagogical activity in a Computer Science context, from a psychological point of view. More precisely, we focus on works which assess motivation/perseverance at run-time.
In [8], Sakdavong and al. design a real-time helper for an e-learning platform, to assist the learner at the right moment, by analyzing the interaction student-computer. This helper aims to give meta-cognitive guidance normally given by a teacher in a face to face educational situation. For that, they use an individual profile made of cognitive and meta-cognitive characteristics. This profile is assessed and updated throughout the activity. They focus, on the semantic of the actions taken by the student (select this menu, click on this or that button etc) to build their meta-cognitive guidance.
[9] try to measure the personality of people through mouse and keyboard metrics when using a computer. To do so they study some metrics of interest on a rating windows: mouse click, number of backspace and delete keys, number of other keys etc. They demonstrate that it might be possible to determine some personality traits (extroversion, anxiety, etc) from analyzing the mouse and keyboard interactions.
[10] study the variation of metrics (keystroke latency, mouse speeds, mouse inactivity occurrences, mouse in-activity duration, etc) with different stress levels during arithmetic exercises. This paper is very interesting for us, because it gives some results about characterization of
stress during a course through his/her interactions with a computer. They demonstrate that stressed people make more mistakes, take more time to answer, and observe an increase of the periods during which the mouse stays unused. On the other hand, mouse speed, click rate and keystroke speed decrease.
[11] uses mouse and keyboard interactions to classify people in three different categories of mood: relax (soft music, very comfortable chair, etc) , neutral (no sound, standard chair, etc) or stress (background noise, chair uncomfortable, etc). Their study confirms the result of [10]. They show that simple metrics belongings to the keyboards (average latency by key, average typing speed for every key, number of backspace, number of delete, etc) and mouse (average mouse speed, total time of inactivity, total time of stop using mouse, etc) permit to infer the characterization of user behavior with similar precision compare to other method (bio-metrics, questionnaire...), but with a more simple approach.
All these papers demonstrate that simple metrics from mouse and keyboard uses permit to characterize different psychological states. In our works, our goal is not to precisely characterize each psychological state, but to detect the change of mood at run-time, i.e when the student leaves the flow state. So we are interested in the evolution of mouse and keyboard metrics in run-time, especially when they converge to a characteristic invariant of transient states that announce boredom or stress. This is the originality of our approach compared to works detailed in this section.
III. Our Proposition A. Main principle based on the Flow theory
As said before, our goal is to take into account the perseverance and the motivation of a student during an activity using a dedicated software.
Our aim is to define a perseverance model, based on metrics arising from mouse and keyboard uses. Basing on the Flow theory, we argue that these metrics can help us detect changes of engagement and motivation of students at run-time.
Fig. 2 shows the evolution in time of the student’s motivation during a pedagogical activity according to the Flow theory. More precisely, it shows the different states the student can be in. The central state is the good one, in which the student is motivated and committed in time. States ”risk of drop out” are temporary and occur when the student considers that challenges are too ambitious for him/her, or when he thinks that his/her skills are too low to reach the goals. Finally, ”drop out” states are bad due to a difficult challenge and a lack of student skills (stress, fear ...), or on the other hand a lack of challenge while the student has many skills (boredom).
Fig. 2. Evolution of the student perseverance
By using run-time perseverance metrics, we want to detect when the student goes from the flow state into a ”risk of drop out” state (P1, P2 on Fig. 2). If detected, we must act to make her/him get back to the flow state by using one of the following strategies:
• S1: Increasing the number of skills implemented by the student with quite the same level of difficulty. For example, we can use a tutorial, a video clip etc. to bring these new skills to the student;
• S2: Decreasing the difficulty of the next activity;
• S3: Increasing the difficulty of the next activity
The choice of the strategy to apply in P1 does not only dependent on run-time perseverance, but also, for example, on the perseverance measured during a larger range of time (contextual level in SDT). So it is important to maintain a portfolio of student’s evolution in the curricula, to have future access to this information. B. Software Architecture
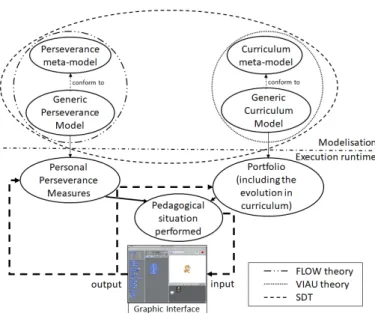
Fig. 3 shows the software architecture of our solution. The left side corresponds to the perseverance (psychol-ogy), the right side to the curricula (education science and didactic). This architecture is based on an MDE approach (Metamodel/Model) because we need to be able to compute these models automatically at run-time, and MDE is particularly well suited for that. Model of perseverance will define mouse and keyboards metrics used to assess the perseverance state of the student. It also defines the rules (correlation between metrics) that identify ”risk of drop out” states. Model of curricula (right side) is a classic tree of pedagogical activity and the pathways deal with prerequisite, difficulty, etc. The Portfolio contains history of past pedagogical situations (derived from the generic curricula model) and associates information to each pedagogical situation (like success, completion time, final motivation etc) and a sub-graph of the generic curricula.
Note that, we focus on educational software based on a blocky2 like programming (like scratch3, code.org4, etc). In this kind of interfaces, the keyboard is rarely used, that’s why, we will focus only on the mouse metrics in the next section.
C. Assessing Perseverance using mouse metrics
Intensity
Number of mouse pauses
Average mouse speed (pixel/millisecond) Number of click (Left/Right)
Distance covered by the mouse pointer (pixel)
Drag & Drop rate (per second) Mouse speed variation
Efficiency
Enforcement
Drag & Drop duration (millisecond) Pause duration (millisecond) Inactivity / activity ratio Sinuosity of movement (distance covered by pointer / distance departure-arrival) Number of miss-click Empty/load movement ratio Semantic Total number of deleted blocks
Current Number of isolated blocks
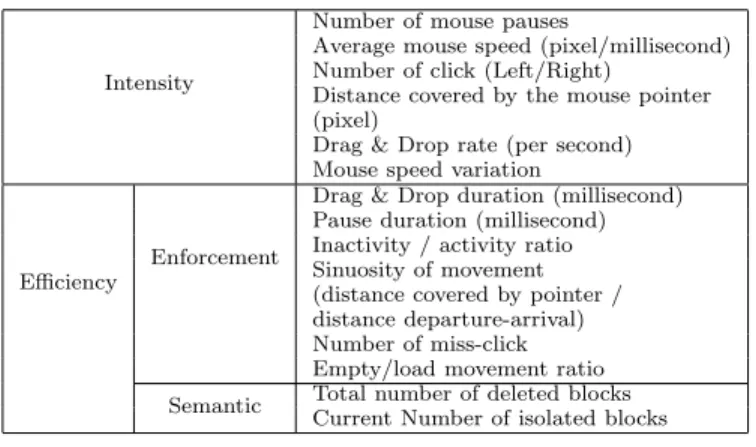
TABLE I
Categorization of mouse metrics
When assessing mouse and keyboard metrics, we are not observing motivation, but a manifestation of moti-vation: the behaviour/action. In a more general context, Fenouillet[7] decomposes the behaviour into intensity and persistance. In a Computer Science context, based on Fenouillet works, we propose to decompose the learner behaviour, i.e. the use of mouse and keyboard, into inten-sity and efficiency: Inteninten-sity is a quantification of student actions and efficiency measures the enforcement, and the semantic of these actions. Semantic metrics address the
2https://developers.google.com/blockly/ 3https://scratch.mit.edu/
4https://code.org/
meaning of the action. Enforcement metrics address the manner the action is realized.
In the Intensity group of metrics, we will find quite similar metrics than those given in [10] and [11], like mouse speed, number of left clicks, number of mouse pauses, etc. In the Efficiency group, we find enforcement metrics like pause duration, sinuosity of movement, etc. In addition, we also find semantic metrics like the total number of deleted blocks and the current number of isolated blocks. A first experimentation was made in a class of pupils aged 10 to 11. These metrics was extracted from events found in the log file of the mouse activity on each computer. This file was recorded with a keylogger5. For
metrics using time (average mouse speed, mouse speed variation, etc), the time windows used for computation was chosen to remove the effects of fast variations of mind change. This permits to detect only the significant changes of the psychological state.
We are actually analyzing these metrics. First results are encouraging, and must be corroborated by more larger experimentation.
IV. Conclusion and perspectives
In this paper, we present an approach to assess per-severance from a Computer Science point of view. More precisely, we try to detect motivation changes by assessing mouse metrics. The first experimentation made allows us to define these metrics.
In a second experimentation, we will capture log files of mouse and keyboard activity, screen, web-cam of users, and bio-metrics from heart pulse. Bio-metric data will permit in a first step to detect mood changes [12], and to characterize points of interest where perseverance metrics evolve. The correlation of these metrics at these points of interest should lead to the definition of characteristic invariant of transients states. Both metrics and char-acteristic invariant form our perseverance model. The validation will be made in a second time on a larger pool of users, always comparing our results with bio-metrics detection.
At mid term, we also want to determine if the per-severance model is the same for different age of pupils, and see if the difference between student who often use a mouse, and student who are not used to using a mouse is significant.
References
[1] M. Malekzadeh, M. Mustafa, and A. Lahsasna, “A review of emotion regulation in intelligent tutoring systems,” Educational Technology & Society, vol. 18, pp. 435–445, 10 2015.
[2] C. Dussarps, “Dimension socio-affective et abandon en for-mation ouverte et `a distance,” Ph.D. dissertation, Universit´e Bordeaux 3, 2014, th`ese de doctorat dirig´ee par Didier Paquelin en Sciences de l’information et de la communication.
[3] R. Viau, La motivation en contexte scolaire. Edition du Renouveau P´edagogique, De boeck, 2009.
[4] E. Deci and R. M. Ryan, Intrinsic motivation and self-determination in human behavior. Springer Science & Business Media, 1985.
[5] T. P. Novak and D. L. Hoffman, “Measuring the flow experience among web users,” Interval Research Corporation, vol. 31, pp. 1–36, 1997.
[6] D. Barbeau, “Pour mieux comprendre la r´eussite et les ´echecs scolaires,” P´edagogie coll´egiale, vol. 5, no. 1, pp. 17–22, 1991. [7] P. Carre and F. Fenouillet, Trait´e de psychologie de la
motiva-tion. DUNOD, 2008.
[8] J.-C. Sakdavong, F. Adreit, and N. Huet, “Help design for the metacognitive guidance of the learner - a proposition of computer-based system,” in Proceedings of the First Interna-tional Conference on Computer Supported Education - Volume 1: CSEDU,, INSTICC. SciTePress, 2009, pp. 209–215. [9] I. A. Khan, W.-P. Brinkman, N. Fine, and R. M. Hierons,
“Measuring personality from keyboard and mouse use,” in Proceedings of the 15th European Conference on Cognitive Ergonomics: The Ergonomics of Cool Interaction, ser. ECCE ’08. New York, NY, USA: ACM, 2008, pp. 38:1–38:8. [Online]. Available: http://doi.acm.org/10.1145/1473018.1473066 [10] Y. M. Lim, A. Ayesh, and M. Stacey, “Detecting cognitive stress
from keyboard and mouse dynamics during mental arithmetic,” in 2014 Science and Information Conference, Aug 2014, pp. 146– 152.
[11] D. E. V. Ligarreto and D. L. D. Luise, “Metrics design for keyboard and mouse: Assessing learning levels,” in 2017 IEEE URUCON, Oct 2017, pp. 1–4.
[12] B. Hong, C.H.; Jiang, “Multi-scale entropy approach to physi-ological fatigue during long-term web browsing,” Hum. Factor Ergon. Manuf. Serv. Ind., vol. 19, pp. 478–493, 2009.