American Food Industry, A Case Study
J.M. AguileraA1, A. CiprianoA1, M. Era˜naA2, I. LilloA1, D. MeryA1, andA. SotoA1
e-mail:[jmaguile,aciprian,dmery,asoto,]@ing.puc.cl
A1Pontificia Universidad Cat´olica de Chile A2VisionQ Ltda.
Abstract. Today quality and safety are major drivers for the food in-dustry. In this context, computer vision technologies might prove highly relevant, providing objective measurements of relevant visual attributes related to food quality and safety, such as, the shape or color of a given good. As a major producer of food products, this type of technologies are highly relevant for Latin America. In this paper we analyze and share our experience developing computer vision technologies for the food in-dustry in a Latin American country. In particular, as a case study, we describe VisionQ-Lab, an application of computer vision technologies to classify seeds, beans, and grains. To demonstrate the capabilities of VisionQ-Lab, we present the results of testing its operation using real data corresponding to different types of rice grains and lentils provided by a food company. The results of our test indicate an average accuracy in the classification close to 95%.
Keywords:Computer vision in food industry, food image analysis, computer vision in Latin America, rice classifier.
1
Introduction
The food industry is one of the most relevant economic sectors for Latin Amer-ica. Most of the Latin American countries have food products as part of their main exports. Coffee, beef, salmon, among many others, appear as some of the food products where Latin American countries lead the world production. To foster the food industry in Latin America and, particularly, to increase their competitiveness, technology appears as one of the key asset.
Today, the increasing technological development and sophistication of mod-ern societies impose new quality and safety standards to the food producers. Consumers demand more and more information about the products they buy, demonstrating clear preferences for well-informed high-quality products. In par-ticular, in the case of exports, the food agencies in the receiving countries apply rigorous test to guarantee the quality and safety of the products. In effect, today quality and safety are major drivers of the modern food chains.
To assurance the quality and safety of food products, computer vision tech-niques can play a key role. In fact, in terms of quality, often the first quality sensation a consumer receives from a food product is its visual appearance. Here, computer vision technologies might provide objective measures of relevant visual attributes related to food quality, such as, the shape or color of a given good.
In terms of non-visible imagery, non-invasive image acquisition techniques, such as magnetic resonance imaging, ultrasound tomography, or x-rays, open new opportunities to apply computer vision technologies in the food industry. These types of sensors are able to provide internal images of food products that can be analyzed by computer vision techniques to access relevant internal parameters related to the quality and safety of the goods.
Microscopy provides another source of relevant application of computer vision technologies to the food industry. High resolution images captured under the lens of new powerful microscopes provide new types of visual information that can be used to study the distribution of chemical elements and macromolecules within the structure of food products.
As suggested by the broad spectrum of applications, it is not surprising that the food industry ranks among the top ten industries using computer vision techniques [7]. The main challenge to build an application is to be able to derive from the images meaningful and usable numerical data that can be used in tasks, such as, engineering analysis, product development, quality control, or as a permanent record for traceability.
In this paper, we share our experience developing computer vision appli-cations for the quality control of food products in Chile. Here, we focus in applications in the visible part of the electromagnetic spectrum, using regular monochrome and color images. In particular, we describe our experience devel-oping a lab equipment that uses computer vision techniques to classify seeds, beans, and grains according to commercial quality standards.
The rest of the paper is organized as follows: Chapter 2 reviews relevant pre-vious work on applications of computer vision technology in the food industry. Chapter 3 discusses the main details of our application. Chapter 4 shows the re-sults of testing our application under real conditions. Finally, chapter 5 presents the main conclusions of this work.
2
Computer Vision Research in Food Industry
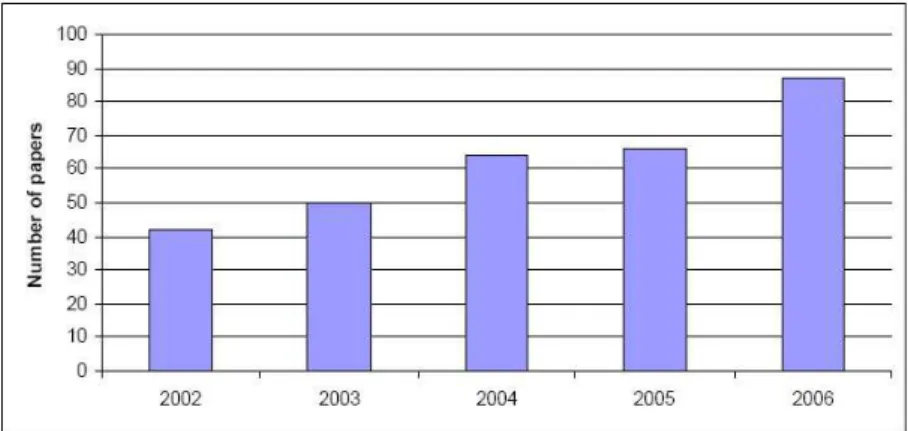
Applications of computer vision technologies in the food industry have grown steadily in the last few years. Figure 1 shows the result of searching in the Web of Science database, the total number of papers published between the years 2002 and 2006 that include topics related to food and computer vision. The Figure shows a clear trend that reflects an increasing interest in the field.
Figure 2 shows the countries where the papers in Figure 1 were produced. This information provides some lights about the research activity in Latin Amer-ica in applAmer-ications of computer vision to the food industry. In the Figure, we
observe that among the top 15 countries, in 9th place, Chile is the only country from Latin America, and actually, it is the only one from a developing region. Not shown in the Figure, Brasil is the other Latin American country that appears in the list, in the position 20th of the rank. This rank suggests that, leaving aside Chile and Brasil, research in computer vision applications for the food industry seems to be not a priority for Latin America.
Fig. 1.Number of papers registered in the Web of Science related to computer vision in food (source:Web of Science).
Fig. 2.Rank of countries with more papers registered in the Web of Science related to computer vision in food (source:Web of Science).
World wide there is an extensive list of publications related to applications of computer vision technologies to the food industry. A special issue of the Journal of Food Engineering (vol. 61, No.1, 2004) includes several articles on specific applications of computer vision to foods and food processing. Du and Sun [2] published an excellent review of applications of image processing techniques for food quality evaluation. An extensive list of relevant applications of computer vision technology to diverse areas of the food industry can be found in [1].
3
Our Application for Quality Control of Food Products
Food product quality can be defined as those quantifiable characteristics that give added value to products [5]. There are many factors contributing to food quality, such as, appearance, taste, nutrition, texture, and even human psycho-logical issues. In terms of visual appearance, it is possible to group the ap-pearance attributes into two major categories: geometrical and chromatic [1]. Geometrical attributes include the size and shape of the product, its surface roughness, and the presence of cracks, among others. Chromatic attributes in-clude the color or color pattern of the product, its gloss, and the presence of blemishes, among others. In general, the visual appearance of a food product is the result of a complex interaction of the light incident on the object, the optical characteristics of the product, and how the observer captures and interprets the information.In the rest of this section we first describe the main elements of a computer vision system for applications in the food industry. Then, as a case study, we describe our application to classify rice grains and lentils. We believe that this system is a good example of the typical applications where computer vision technologies can play a relevant role for the food industry.
3.1 A computer vision system for the food industry
Figure 3 shows a diagram of the main steps of a computer vision system for the food industry. This system consists of four basic components: the illumina-tion source, an image acquisiillumina-tion device, the processing hardware, and suitable software modules.
In terms of the software modules, the image processing algorithms generally consist of the following five steps: i) Image acquisition (or image formation) to produce digital images of the food products; ii) Pre-processing to enhance, clean, and improve key parts of the input images; iii) Segmentation to identify relevant parts of a food product, as disjoint and non-overlapping regions separated from the background ; iv) Object recognition and measurement to quantify key fea-tures of the selected objects; and finally, v) Interpretation, where the feafea-tures extracted from the products are interpreted using application domain knowledge. Figure 4 shows 2 illustrative cases where food products are analyzed with the image processing methodology described above. Starting from the segmented images or the relevant features detected by the computer vision system, it is
Fig. 3.Components of a computer vision system to analyze food products. The image analysis includes five main steps: image acquisition, pre-processing, image segmenta-tion, object measurement, and interpretation.
possible to assess several quality parameters related to the external appearance of the food products. As a case study, the following section analyzes in detail a computer vision system designed to classify rice grains and lentils.
Fig. 4.Examples of food products analyzed by a computer vision system. Left: Original input image. Center: Interest regions identified. Right: Specific features are detected.
3.2 VisionQ-Lab: A lab system to assess the quality of food Samples
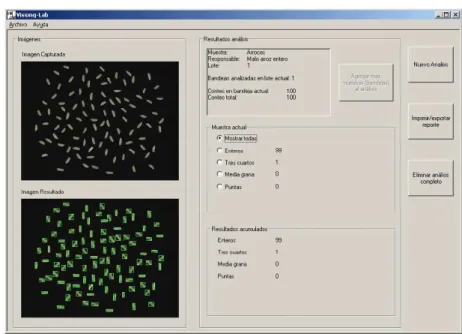
Today, in the production of diverse food products, it is highly common to perform lab testing of random samples of the production to certify its quality. VisionQ-Lab is intended to help in this task by providing objective measures of visual features associated with the quality of the food samples. The system consists of a highly general hardware setting, able to support different applications, and a highly modular software, easily adapted to the measurement needs of diverse food products. In this paper we will focus in the application of VisionQ-Lab to classify rice grains and lentils. In Section 4 we will discuss the main results of this application.
Figure 5 shows an external and interior view of VisionQ-Lab. For the op-eration of the system, the equipment is provided with a set of trays where the user can insert the food samples. As shown in the Figure, the system is supplied with trays of different colors which are selected by the user depending on the colors of the food samples. The idea is to select the tray that differs the most from the colors of the food samples. This feature simplifies the complexity of the image processing algorithms by enhancing the contrast between background and foreground pixels.
Fig. 5.External and interior view of VisionQ-Lab.
VisionQ-Lab contains a set of basic computer vision routines to estimate chromatic and geometrical features of the food samples. In the case of color, the analysis is mainly performed using the L*, a*, and b* (CIELAB) color space defined by the Commission International de l’Eclairage (www.cie.co.at/cie). This color space is widely used in research and quality control of foods. Mathematical formulas are available to transform from the RGB to the CIELAB color space [4]. Generally, L*, a*, and b* values obtained with commercial colorimeters are not exactly the same as those measured for the same spot by image analysis, however,
when standard color tiles are used for calibration the correlation between the two methods is usually very high [3].
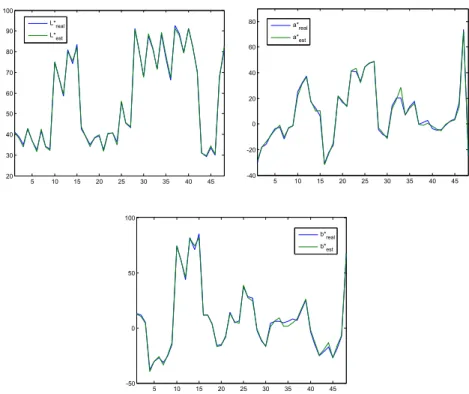
In particular, for CIELAB calibration of VisionQ-Lab, we used a set of 200 different uniform color tiles as training data, and an independent set of 48 dif-ferent uniform color tiles for testing the computed RGB to CIELAB conversion, assuming a cubic model of RGB components. The CIELAB colors of the tiles in the training set were measured by a commercial colorimeter (Miniscan XE Plus from HunterLab). Figure 6 shows the measures provided by the comercial colorimeter (real) and VisionQ-Lab (est) for the 48 tiles in the test set. As can be seen in the Figure, the performance of both instruments is highly similar, in average the difference in performance was 0.8% for L*, 1.58% for a* and 1.53% for b*, assuming L* between 0 and 100, and a* between -120 and 120, the same as b*. 5 10 15 20 25 30 35 40 45 20 30 40 50 60 70 80 90 100 L* real L* est 5 10 15 20 25 30 35 40 45 -40 -20 0 20 40 60 80 a* real a* est 5 10 15 20 25 30 35 40 45 -50 0 50 100 b* real b* est
Fig. 6.Performance of CIELAB color estimation from RGB space for 48 testing color tiles.
We believe that the use of instruments based on machine vision has numer-ous advantages over commercial colorimeters. In particular, the large spatial resolution of current image acquisition devices eliminates subjective selection of sampling areas within an object by the operator, as well as, problems related to
averaging the colors only over a small spot of the food product. Furthermore, for samples that present non-uniform color distributions (e.g., a biscuit or a salmon fillet) relevant areas can be segmented and analyzed independently at a pixel level.
Besides color, VisionQ-Lab is able to measure geometrical features of the food samples, such as, area, perimeter, shape, and length. To achieve these measure-ments, we first apply to the input image a figure ground segmentation algorithm specifically designed to segment color food images. This algorithm is based on contrast enhancement of the object with respect to the background and it was presented before in [6] for one of the authors of this paper. The algorithm in-cludes three main steps. First, a grayscale image is obtained from the input using an optimal linear combination of the RGB components found in the pixels around a specific image location. This location corresponds to any image area identified as belonging to the tray used to positioning the food samples. Then, a global threshold to separate foreground from background pixels is estimated using a statistical approach. Afterwards, a morphological operation is used to fill possible holes that may appear in the final segmented area. In cases that there are several objects in the image that are touching each other, it is also necessary to separate them. To achieve this, we use a Watershed technique [4]. Finally, we apply specific filters that provide objective measurements related to the shape of the food products.
In terms of hardware, VisionQ-Lab consists of 3 main components: the im-age capturing device, the illumination system, and the supporting enclosure. The image capturing device consists of a digital video camera with an IEEE 1394a (FireWire) interface. The camera provides capabilities to set different rel-evant parameters for the image processing steps, such as, the white balance and shutting speed. The resolution of the camera depends on the application. In the case of the classification of rice grains, we use images captured at a resolution of 640x480 pixels. To obtain high quality images, for each analysis we average the pixel values of 10 frames to reduce noise. This is possible in our application given the high frame rate and the time requirements of a lab instrument.
The illumination system is a very relevant part of the equipment, mainly, for applications that require calibrated color analysis. We use 4 special fluores-cent lamps F08T5 with near flat emission in the color spectrum, with 6500K of color temperature to emulate a white light source, and equipped with 25kHz electronic ballast which provides uniform lighting, specially designed to reduce the flickering of the fluorescent lamp. We also use an acrylic light diffuser to obtain an homogeneous illumination over the tray where the food samples are positioned. This diffuser also helps to avoid specular reflections. It is important to note that this illumination system was used to obtain the calibration results shown in Figure 6. Finally, the supporting enclosure holds the system and the electronics. All the software runs in an external desktop or laptop computer that is connected to the supporting enclosure by an IEEE 1394a interface.
4
Results: VisionQ-Lab at Work
To demonstrate the capabilities of VisionQ-Lab, we present the results of testing its operation using real data from a chilean grain producer. Although, VisionQ-Lab is able to classify diverse types of food products, mainly a variety of seeds and grains, here we focus on describing its performance when classifying rice grains and lentils.
In the case of rice grains, according to the standards use by the company that provides the samples, there are 4 main classes of grains. Here, we refer to these classes as Type 1 to Type 4. These classes are related to the degree of fragmentation of each grain. For example, a rice grain corresponds to Type 1 if is not fragmented at all. At the other end, a rice grain corresponds to Type 4 if is a fragment of less than half the size of a complete grain. In the case of lentils, the company classifies them in 7 main classes. These classes are characterized by different visual features of the lentils, such as size, shape, color, and/or the presence of blemishes.
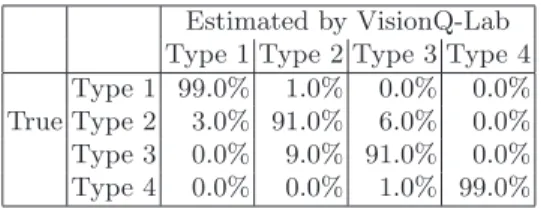
Figure 7 shows the performance of VisionQ-Lab when detecting samples of rice grains. As shown in the figure, most of the grains are accurately detected. To validate the measurements, an expert manually selects a set of 100 rice grains from each class. Then, we let VisionQ-Lab to classify the selected grains. We repeat the experiments 3 times modifying the distributions of the grains in the tray. To maximize the contrast between the grains and the tray, we select for this experiment the black tray. The time of exhibition of each sample is around 1 second. Table 1 shows a confusion matrix with the results of the experiment.
Estimated by VisionQ-Lab Type 1 Type 2 Type 3 Type 4 Type 1 99.0% 1.0% 0.0% 0.0% True Type 2 3.0% 91.0% 6.0% 0.0% Type 3 0.0% 9.0% 91.0% 0.0% Type 4 0.0% 0.0% 1.0% 99.0%
Table 1.Confusion matrix showing the performance of VisionQ-Lab to classify rice grains.
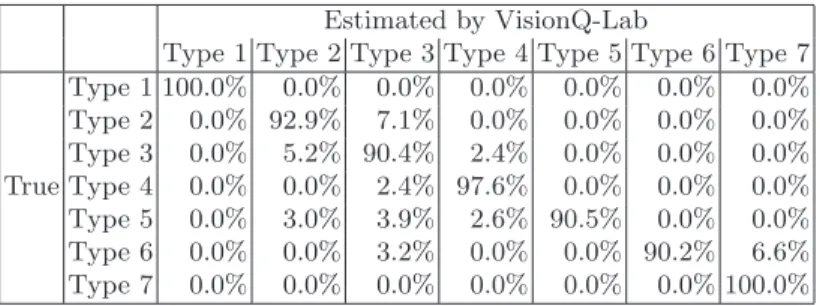
A similar validation scheme is applied to the case of the lentils, but in this case we manually select samples from 7 classes. Table 1 shows the resulting confusion matrix for this experiment.
As it can be seen from Tables 1 and 2, in both cases VisionQ-Lab was able to achieve high classification rates. This illustrates the relevance of using computer vision technologies for this type of applications.
Fig. 7.Results of VisionQ-Lab when detecting samples of rice grains.
5
Conclusions
In this paper, we focus in analyzing the relevance of computer vision techniques for the food industry, mainly in Latin America. We describe how the use of these techniques in the food industry eliminates the subjectivity of human vi-sual inspection, adding accuracy and consistency. They also can provide fast identification and measurement of selected objects, classification into categories, and color analysis of food surfaces with high flexibility. In addition, since they are non-contact, non-destructive technologies, temporal changes in properties such as color and image texture can also be monitored and quantified.
In the case of Latin America the food industry is a main economical sector, however, the research activity in the application of computer vision to food products is limited. For example, the amount of publications in the region in this area that appears in ISI-indexed journals is just modest. Only Chile and Brasil appear among the top 20 countries with more research activity in the area.
As a case study, the results of developing a computer vision system to classify samples of rice grains and lentils show the great relevance of the technology for the food industry. In both cases, we obtain average accuracy levels close to 95%, which are suitable for practical applications of the technology.
Finally, as we describe and illustrate by the case study, computer vision sys-tems can be designed for specific applications using common hardware (cameras, scanners, PCs), and commercial, free, or custom software. Whether computer
Estimated by VisionQ-Lab
Type 1 Type 2 Type 3 Type 4 Type 5 Type 6 Type 7 Type 1 100.0% 0.0% 0.0% 0.0% 0.0% 0.0% 0.0% Type 2 0.0% 92.9% 7.1% 0.0% 0.0% 0.0% 0.0% Type 3 0.0% 5.2% 90.4% 2.4% 0.0% 0.0% 0.0% True Type 4 0.0% 0.0% 2.4% 97.6% 0.0% 0.0% 0.0% Type 5 0.0% 3.0% 3.9% 2.6% 90.5% 0.0% 0.0% Type 6 0.0% 0.0% 3.2% 0.0% 0.0% 90.2% 6.6% Type 7 0.0% 0.0% 0.0% 0.0% 0.0% 0.0% 100.0%
Table 2.Confusion matrix showing the performance of VisionQ-Lab to classify lentils.
vision technologies are used for engineering research, quality control, quality as-sessment or in marketing, we believe that every food company in Latin America should at least consider the incorporation of these techniques into their opera-tions.
Acknowledgments
We would like to thank Fondecyt and Nestle Research Centre (Lausanne) for the important support to this initiative.
References
1. J. M. Aguilera and V. Briones. Computer vision and food quality. Food Australia,
57(3):79–87, 2005.
2. C. Du and D. Sun. Recent developments in the applications of image processing
techniques for food quality evaluation. Trends in Food Science and Technology,
15:230–249, 2004.
3. J. Giese. Color measurement in foods. Food Technology, 57(12).
4. R.C. Gonzalez and R.E. Woods. Digital Image Processing. Addison-Wesley
Long-man Publishing Co., 1992.
5. W. M. Jongen. Food supply chains: From productivity toward quality. In R. L.
Shewfelt and B. Bruckner, editors,Fruit and Vegetable Quality: An Integrated View,
pages 3–20. Technomic Publ. Co. Inc., 2000.
6. D. Mery and F. Pedreschi. Segmentation of colour food images using a robust
algorithm. Journal of Food engineering, 66:353–360, 2004.
7. A. J. Timmermans. Computer vision system for on-line sorting of pot plants based