University of Massachusetts Amherst
ScholarWorks@UMass Amherst
Open Access Dissertations
9-2012
Towards Large-Scale Validation of Protein
Flexibility Using Rigidity Analysis
Filip Jagodzinski
University of Massachusetts Amherst, [email protected]
Follow this and additional works at:https://scholarworks.umass.edu/open_access_dissertations Part of theComputer Sciences Commons
This Open Access Dissertation is brought to you for free and open access by ScholarWorks@UMass Amherst. It has been accepted for inclusion in Open Access Dissertations by an authorized administrator of ScholarWorks@UMass Amherst. For more information, please contact
Recommended Citation
Jagodzinski, Filip, "Towards Large-Scale Validation of Protein Flexibility Using Rigidity Analysis" (2012).Open Access Dissertations.
646.
TOWARDS LARGE-SCALE VALIDATION OF PROTEIN
FLEXIBILITY USING RIGIDITY ANALYSIS
A Dissertation Presented by
FILIP JAGODZINSKI
Submitted to the Graduate School of the
University of Massachusetts Amherst in partial fulfillment of the requirements for the degree of
DOCTOR OF PHILOSOPHY September 2012
© Copyright by Filip Jagodzinski 2012 All Rights Reserved
TOWARDS LARGE-SCALE VALIDATION OF PROTEIN
FLEXIBILITY USING RIGIDITY ANALYSIS
A Dissertation Presented by
FILIP JAGODZINSKI
Approved as to style and content by:
Ileana Streinu, Chair
Jeanne Hardy, Member
David Jensen, Member
David Kulp, Member
Jack Wileden, Member
Lori A. Clarke, Department Chair Department of Computer Science
ACKNOWLEDGMENTS
I would like to thank my committee, for providing the guidance that made all of this work feasible. Ileana, especially, for allowing me to make – and learn – from my mistakes. I hope that I can demonstrate as much patience, and instill as much of a sense of dedication in my future students, as Ileana has in me. In addition, the work presented here is interdisciplinary at the intersection of biology, chemistry, and com-puter science. As such Jeanne’s insights along with her insisting that the dissertation be as well developed and rounded in terms of chemistry as it is in computer science, are much appreciated. Many thanks are also due for David Jensen, David Kulp, and Jack. Their guidance in how to assess and measure the quality of my computational experiments, their insisting that I address the question of, “what is the overarching science that you are doing?,” and their “where is the data to support this?” questions, are all much appreciated.
And then there are those people, whom I mention by first name, who did not directly influenced my work. Nonetheless they were there when I was formulating the core of my values, and they helped me to become the person who I am today. To them, thank you. They are Tyler, Benjy, and Chad.
And to those people who I met while in Amherst. TJ, Megan Olsen and Tim Wood, Dubi and his family. Hossein Baghdadi. Pete. Leeanne for being the fantastic Grad Program manager that she is. Audrey for her hard, honest guidance on teaching style and methodology. I’ve learned much from all of them, and my life has been enriched as a result. Also, thank you, Brenda, for the music. The piano. It is a part of me now. There’s no going back.
Several of my former professors were instrumental in my decision to pursue a graduate degree. I hope they continue to inspire others as they have inspired me. Jacqueline van Gorkom is a fantastic professor of astronomy; Eric Gotthelf afforded me my first opportunity in conducting research. I have also fond memories in working with Frank Klassner and Boots Cassel. Thank you all.
And did I mention that I like to eat? And to spend time with my family in Connecticut? Over the entirety of my tenure at UMass, Ava, Julian, and Patrica unconditionally welcomed me into their home. Thank you for giving me a place to put my feet up when things in Massachusetts got especially crazy. Dziękuję bardzo.
I want to also thank my mom. Without her, none of this would be possible. And my grandmother Krystyna. She once told me (in Polish), “Do something that will help others.” That commonly-referred-to-as-a cliché statement takes on a level of credence and assumes wisdom stature when cited by her, who is now 93 years old.
And to my current lab cohabitants, John and Ashraf. Naomi, also, whom I have worked with, complained with, laughed with, cursed at many things with, etc. She is a fantastic partner-in-crime.
And a special thanks goes out to Mícheál Mc
¯¯Donald. He said, “Don’t worry so
much about pleasing each [dissertation] committee member. Just do good science. Then they’ll have to say yes.” Bold. And, moving forward, he said, “The day that you stop being a student, is the day that you start being a bad teacher.” How true. Words to live by.
ABSTRACT
TOWARDS LARGE-SCALE VALIDATION OF PROTEIN
FLEXIBILITY USING RIGIDITY ANALYSIS
SEPTEMBER 2012 FILIP JAGODZINSKI B.Sc., COLUMBIA UNIVERSITY M.Sc., VILLANOVA UNIVERSITY
Ph.D., UNIVERSITY OF MASSACHUSETTS AMHERST Directed by: Professor Ileana Streinu
Proteins are dynamic molecules involved in virtually every chemical process in our bodies. Understanding how they flex and bend provides fundamental insights to their functions. At the atomic level, protein motion cannot be observed using existing experimental methods. To gain insights into these motions, simulation methods are used. However such simulations are computationally expensive.
Rigidity analysis is a fast, alternative graph-based method to molecular simula-tions, that gives information about the flexibility properties of molecules modeled as mechanical structures. Due to the lack of convenient tools for curating protein data, the usefulness of rigidity analysis has been demonstrated on only a handful of pro-teins to infer several of their biophysical properties. Previous studies also relied on heuristics to determine which choice of modeling options of important stabilizing in-teractions allowed for extracting relevant biological observations from rigidity analysis
results. Thus there is no agreed-upon choice of modeling of stabilizing interactions that is validated with experimental data.
In this thesis we make progress towards large-scale validation of protein flexibility using rigidity analysis. We have developed the KINARI software to test the predictive power of using rigidity analysis to infer biophysical properties of proteins. We develop new tools for curating protein data files and for generating biological functional forms and crystal lattices of molecules. We show that rigidity analysis of these biological assemblies provides structural and functional information that would be missed if only the unprocessed data of protein structures were analyzed. To provide a
proof-of-concept that rigidity analysis can be used to perform fast evaluation of in silico
mutations that may not be easy to perform in vitro, we have developed
KINARI-Mutagen. Finally, we perform a systematic study in which we vary how hydrogen bonds and hydrophobic interactions are modeled when constructing a mechanical framework of a protein. We propose a general method to evaluate how varying the modeling of these important inter-atomic interactions affects the degree to which rigidity parameters correlate with experimental stability data.
TABLE OF CONTENTS
Page
ACKNOWLEDGMENTS . . . v
ABSTRACT. . . vii
LIST OF TABLES. . . .xiii
LIST OF FIGURES. . . .xiv
CHAPTER 1. INTRODUCTION . . . 1
1.1 Background and Motivation . . . 1
1.2 Thesis Contributions . . . 5
1.2.1 KINARI: An Infrastructure for Rigidity Analysis of Proteins . . . 6
1.2.2 Rigidity Analysis of Protein Biological Assemblies . . . 7
1.2.3 KINARI-Mutagen: Identifying Critical Residues . . . 8
1.2.4 Correlating Rigidity Parameters with Experimental Data . . . 8
1.3 Thesis Outline . . . 9
2. BACKGROUND AND RELATED WORK. . . 11
2.1 Biology and Chemistry Primer . . . 11
2.1.1 Proteins: Polypeptide Chains of Amino Acids . . . 12
2.1.2 Determining Protein Structures . . . 15
2.1.3 Experimental Methods for Measuring Protein Stability . . . 16
2.1.4 The Protein Data Bank and the ProTherm Database . . . 19
2.1.5 Lysozyme from Bacteriophage T4 . . . 19
2.2 Methods for Studying Protein Motions . . . 20
2.2.2 Simulating Protein Motions: Molecular Dynamics . . . 21
2.2.3 Minimalist Models for Simulating Protein Motions . . . 22
2.2.4 Inferring Protein Conformations from Structure Data . . . 22
2.3 Rigidity Based Protein Flexibility . . . 23
2.3.1 Rigidity of Bar-and-Joint Frameworks . . . 23
2.3.2 Mechanical Modeling of Proteins . . . 23
2.3.3 Pebble Game Rigidity Analysis. . . 24
2.4 Rigidity Based Protein Flexibility: Related Work . . . 25
3. KINARI: AN INFRASTRUCTURE FOR LARGE-SCALE RIGIDITY STUDIES OF PROTEINS . . . 28
3.1 Introduction and Background . . . 28
3.2 System Description . . . 29
3.3 Software Profiling and Testing . . . 31
3.3.1 Generating Biological Assemblies . . . 33
3.3.2 Building Crystal Lattices . . . 35
3.3.3 Generating in silico Mutant Protein Structures . . . 37
4. ANALYZING PROTEIN BIOLOGICAL ASSEMBLIES AND CRYSTALS. . . 41
4.1 Introduction and Motivation . . . 41
4.2 Summary of Methods . . . 42
4.3 Results . . . 43
4.3.1 Merging of Rigid Clusters in a Biological Assembly . . . 43
4.3.2 The Biological Assembly Of A Nucleoprotein . . . 45
4.3.3 Analyzing How Subunits of a Protein Affect Its Rigidity . . . 46
4.3.4 Crystal Lattice Dominant Cluster Aggregation . . . 49
4.3.5 A Significant Increase of Rigid Clusters in a Crystal Lattice . . . 51
4.3.6 Rigidity Analysis Of Several Forms of Ribonuclease A . . . 52
4.3.7 Survey of 982 Crystal Structures . . . 53
4.4 Conclusions . . . 55
5. PREDICTING THE EFFECT OF MUTATIONS ON PROTEIN STABILITY . . . 57
5.1 Motivation and Introduction . . . 57
5.2.1 Mutations Affect Protein Structure and Function . . . 58
5.2.2 Related Work . . . 59
5.3 Methods and Results . . . 62
5.3.1 Case Study - Crambin . . . 63
5.3.2 Case Study - Lysozyme from Bacteriophage T4 . . . 65
5.3.3 Validation - 48 Mutants . . . 69
5.4 Conclusions . . . 71
6. TOWARDS VALIDATION OF MOLECULAR MODELING FOR RIGIDITY ANALYSIS. . . 73
6.1 Motivation and Introduction . . . 73
6.2 Constructing a Dataset of Protein Data Files and Systematically Varying Modeling of Stabilizing Interactions . . . 75
6.3 Correlating Rigidity Parameters to Experimental Data . . . 76
6.3.1 Scatter Plots of Rigidity Measurements and Experimental Data . . . 77
6.3.2 Calculating Correlation Using Spearman’s Rank Coefficient Testing . . . 77
6.3.3 A General Method for Correlating∆∆G With Rigidity Metrics, Assuming a Linear Relationship . . . 79
6.3.3.1 Evaluation of the Dominant Rigid Cluster Metric . . . 82
6.3.3.2 Evaluation of the Cluster Configuration Entropy Metric . . . 82
6.3.3.3 Evaluation of the Average Cluster Size Metric . . . 82
6.4 Conclusions . . . 83
7. CONCLUSIONS. . . 90
7.1 Summary of Contributions . . . 90
7.1.1 KINARI: Infrastructure for Rigidity Analysis of Proteins . . . 91
7.1.2 Inferring Structural and Functional Information of Protein Biological Assemblies and Crystals. . . 92
7.1.3 KINARI-Mutagen: Inferring Critical Residues . . . 93
7.1.4 Correlating Rigidity Parameters to Experimental Data . . . 93
APPENDICES
A. RIGIDITY RESULTS OF PROTEIN BIOLOGICAL
ASSEMBLIES AND CRYSTAL LATTICES. . . 96
B. EXPERIMENTAL AND RIGIDITY DATA FOR 48 MUTANT
PROTEINS ANALYZED BY KINARI-MUTAGEN. . . 100
LIST OF TABLES
Table Page
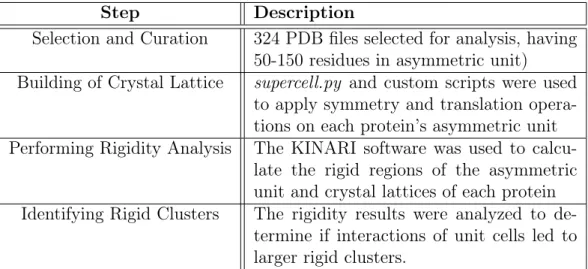
4.1 Experimental setup for generating crystal lattices . . . 42
4.2 Summary of dataset for survey of crystal structures . . . 54
4.3 Classification of protein crystals according to their rigidity . . . 56
5.1 Rigidity analysis results of 8 lysozyme mutants . . . 67
5.2 Rigidity results of 48 mutants analyzed by KINARI-Mutagen . . . 70
6.1 Modeling of hydrogen bonds according to their energies . . . 76
6.2 Non-Parametric Spearman’s Correlation Testing; Lowest p-values . . . 79
6.3 Sample dataset for correlating experimental with rigidity data . . . 81
A.1 Rigidity results for putative protein from the gram-negative bacterium Thermus thermophilus . . . 96
A.2 Rigidity results of the scaffolding protein of Vaccinia Virus . . . 97
A.3 Rigidity results for Nucleoprotein from Rift Valley Fever Virus . . . 98
A.4 Rigidity results for Type III Antifreeze Protein RD1 . . . 99
A.5 Rigidity results of Ribonuclease A . . . 99
B.1 Protein structures with no stabilizing interactions at substitution . . . 100
B.2 Protein structures with too few stabilizing interactions at substitution . . . 101
B.3 Protein structures with sufficient stabilizing interactions at substitution . . . 102
LIST OF FIGURES
Figure Page
2.1 Structure of proteins . . . 13
2.2 Conformations of HIV-1 Protease . . . 15
2.3 Modeling proteins as body-bar-hinge frameworks . . . 24
2.4 Abstract mechanical framework of a protein’s structure . . . 25
3.1 Curation, modeling, and rigidity analysis in KINARI . . . 30
3.2 Visualizing rigid cluster of HIV-1 Protease . . . 31
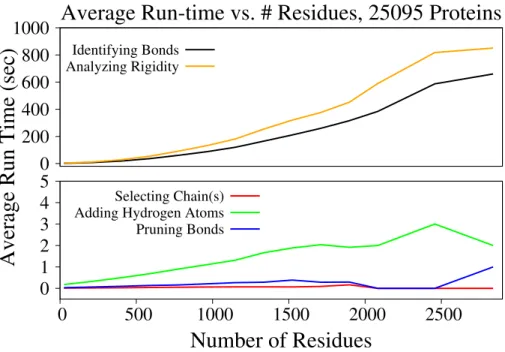
3.3 Profiling results for 25,000 proteins . . . 32
3.4 Symmetry operations in proteins . . . 35
3.5 Matrices for generating crystal structures from an asymmetric unit . . . 36
3.6 Rigidity analysis of a crystal lattice of the B domain of the streptococcal protein G . . . 37
3.7 Generating crystal lattices from asymmetric units . . . 38
3.8 Simulating mutations to glycine in KINARI-Mutagen . . . 39
3.9 System description of KINARI-Mutagen . . . 40
4.1 Schematic and rigidity results of HIV-1 Protease . . . 44
4.2 Rigidity Results of Rift Valley Virus . . . 46
4.3 Rigidity analysis of Vaccinia Virus D13 . . . 47
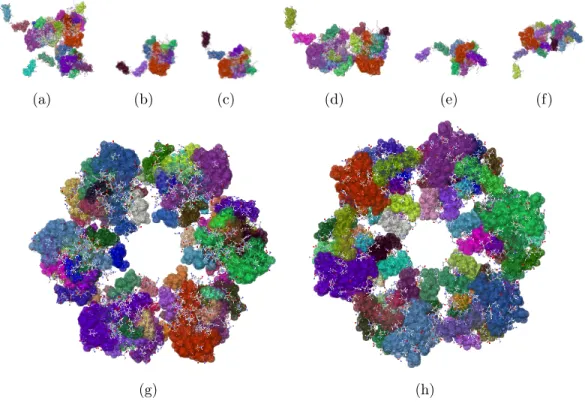
4.5 Rigid clusters of unit cells of Type III Antifreeze Protein . . . 51
4.6 Comparing rigidity of two crystal forms of Ribonuclease A . . . 53
5.1 Rigidity results of two in silico mutants of Crambin . . . 63
5.2 SASA and Size of Dominant Rigid Cluster plot for Crambin . . . 64
5.3 Rigidity results of wild-type Lysozyme from bacteriophage T4 . . . 66
5.4 Distribution of Rigid Bodies, By Residue, Plot for Lysozyme . . . 68
5.5 Solvent exposed amino acids not identified as critical . . . 71
6.1 Choice of modeling affects rigidity results . . . 74
6.2 Scatter plots for Change of the Dominant Rigid Cluster versus ∆∆G . . . 85
6.3 Scatter plots for Change in Cluster Configuration Entropy versus ∆∆G . . . 86
6.4 Scatter plots for Change of the Average Cluster Sizer versus ∆∆G . . . 87
6.5 Correlating rigidity metrics with experimental data . . . 88
6.6 Quantitative correlations for Dominant Rigid Cluster and ∆∆G . . . 88
6.7 Quantitative correlations for Cluster Configuration Entropy and ∆∆G . . . 89
CHAPTER 1
INTRODUCTION
Proteins are dynamic biological molecules that bend and flex, and interact with other molecules, in order to perform their functions. We want to understand these mo-tions, so that we can design medicines to therapeutically regulate these biomolecules. Unfortunately, there are no existing experimental methods that allow us to observe how proteins bend and flex on the atomic level. To gain insight into these motions, researchers use computationally intensive methods that rely on numerical techniques to simulate molecular motion. Pebble game-based rigidity analysis is an alternative, computationally efficient graph-based technique that determines the rigid components of a protein. Its usefulness in inferring structural and biophysical properties has been demonstrated on several molecules, but a large-scale study correlating protein rigidity parameters against experimental data has not been performed.
The goal of this thesis is to make progress towards a large-scale validation of protein flexibility using rigidity analysis. We develop new tools for curating protein structure data, we demonstrate KINARI-Mutagen for inferring which residues of a protein are critical, and we propose a general method for correlating rigidity
param-eters to experimental data in the form of∆∆G measurements.
1.1
Background and Motivation
Proteins are long chains of amino acids that fold into complex three dimensional shapes. They perform a myriad of functions in our bodies. Some have mechanical structural roles, others are involved in the immune response, while still others help
to translate and transcribe the genetic information in our chromosomes so that new molecules can be synthesized. Proteins perform their functions by flexing, bending, and interacting with other molecules. HIV-1 Protease, for example, plays an inte-gral role in the maturation process of HIV. The protease undergoes a conformational change that is necessary for it to perform its function. So that medicines can be designed to regulate such proteins, we need an atomic-level understanding of where proteins flex, bend, and permit motion. Unfortunately, there are no existing experi-mental methods that allow us to observe atomic motion.
To gain insight into the motions of proteins on an atomic level, researchers rely on computational simulation methods. One such method is Molecular Dynamics (MD), in which the trajectories of a protein’s atoms are calculated using numerical methods utilizing Newton’s equations of motion. MD methods unfortunately have a very serious drawback: they are computationally intensive, and require hundreds, and up to tens of thousands, of computer processors [64].
Rigidity analysis of proteins is complementary to simulation methods such as MD. Its goal is not to simulate or predict a protein’s motion, but to identify a molecule’s flexible and rigid clusters of atoms. The input to rigidity analysis is a protein struc-ture file. The Protein Data Bank (PDB), is a freely-accessible repository of protein structure data, whose entries of protein structures were solved using experimental methods such as X-ray crystallography. In preparation for rigidity analysis, impor-tant stabilizing chemical interactions among the atoms in the protein are identified. Atoms and their chemical interactions are used to construct a mechanical model of the molecule. Covalent bonds between atoms in the protein are represented as hinges in the mechanical model, and other stabilizing interactions such as hydrogen bonds and hydrophobic interactions are represented as hinges or as rigid bars. A graph is constructed from the mechanical model, in which each body in the mechanical struc-ture is associated to a node, hinges between two bodies are associated to five edges
between two nodes, and bars are associated to edges. Depending on the type and strength of the chemical interactions that exists between atoms, a single or multiple edges – up to 6 – are placed between the two nodes in the graph representing the chemical constraints in the mechanical model. Efficient algorithms based on the peb-ble game paradigm [32, 46](explained in Section 2.3.3) are used to analyze the rigidity of the graph. The rigidity results permit inferring the rigid and flexible regions of the mechanical model, and hence the protein.
Rigidity analysis of proteins was first implemented in MSU-First [34, 33] and
the first online tool was FlexWeb [79]. Since the late 1990s, the usefulness of
rigid-ity analysis was demonstrated in inferring various structural and functional proper-ties of proteins. Among these, rigidity analysis was used to identify the stability core of Rhodopsin [69], it was used to investigate the stability differences between temperature-sensitive proteins called thermophiles [25], and locations of rigid clusters of atoms have been correlated with the dynamics of well-studied proteins such as HIV-1 Protease [79].
Although tools such asMSU-First and FlexWeb were successful in demonstrating
the usefulness of rigidity analysis in inferring structural and biological properties of a handful of proteins, the method has not been validated on a large dataset of proteins. There are several reasons why this is so.
Firstly, experimental methods such as X-ray crystallography produce the
asym-metric unit, which is the smallest portion of a crystallized protein on which symmetry operations can be applied to reproduce the crystal form of the molecule. The asym-metric unit most often does not represent the biological functional form of a protein. To generate the biological assembly of a molecule, symmetry, rotation, and transla-tion operatransla-tions are applied on the atomic coordinates of the atoms in the asymmetric unit. If done by hand, generating the biological assembly of a molecule is a tedious process. And, automated tools for generating the biological form of a protein are
dif-ficult to design. This is because proteins exhibit a wide range of structural features, so the process is difficult to automate. Some biological forms of proteins are made up of a single chain of amino acids, while others are made up of multiple copies of the asymmetric unit. Others still are composed of multiple copies of different amino acid chains. And, the data files of protein structures solved using experimental methods are often incomplete, and may include water molecules along with non-standard amino acids or ligands. All of these are reasons why a high-throughput rigidity analysis of large datasets of proteins has not been performed.
Secondly, in the cases where rigidity analysis was used to infer biophysical
prop-erties of proteins, the interpretation of the rigidity results relied on biological insights of the studied molecules. Requiring in-depth knowledge of each protein that is studied makes rigidity analysis of large datasets of proteins impractical. Thus, a large-scale study to correlate rigidity properties of proteins with experimental data has not been conducted.
Finally,MSU-First andFlexWeb do not provide the user easily accessible options
to designate how important stabilizing interactions should be modeled in the mechan-ical representation of a protein. Thus these tools cannot be used to easily perform large-scale studies to infer how changing the modeling of these interactions affects the rigidity results. Also, related to this is that there is often very sparse structural experimental data about any one protein. This is because experiments performed on a physical protein are generally expensive and time-intensive. A consequence of this is that there is no agreed-upon choice of how chemical interactions should be modeled in the mechanical framework of a protein.
The central theme of this thesis is to make progress towards a large scale valida-tion study of rigidity analysis of proteins. As such, we have developed the KINARI software, which has allowed us to address each of the three shortcomings mentioned above. Namely, we have:
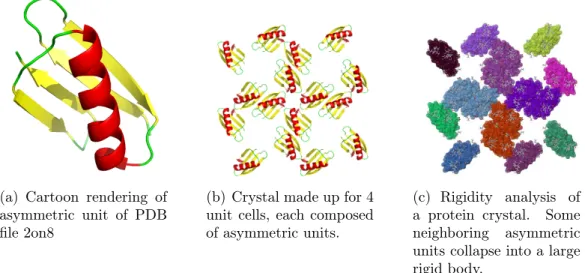
1. Developed curation tools, that permit the generating of biological forms of pro-teins from their asymmetric units. As a result, it is now possible to perform automated rigidity experiments on large datasets of biological structures. In Chapter 4, we demonstrate these new curation tools. Moreover, we show in several case studies that rigidity analysis of protein biological assemblies and of crystal lattices provides information about the biological form of a protein, that would not have been attained if only the asymmetric unit from a protein structure file were analyzed.
2. Developed KINARI-Mutagen, to help infer the locations of critical regions of a protein, that help to maintain its stability. This tool is a new application of rigidity analysis, whose predictive power does not rely on any biological insight of the protein that is being studied.
3. Investigated possible correlations between various rigidity parameters and ex-perimental stability measurements of a dataset of 158 proteins. We have sys-tematically varied how important stabilizing interactions were modeled in the mechanical representations of these biomolecules. We propose and demonstrate a general method to rank the choices of modeling of stabilizing interactions, based on how the rigidity results correlate to experimental data. Such a large-scale correlation study has not been done before.
1.2
Thesis Contributions
The contributions in this thesis build upon research results of Streinu and her col-laborators. Also, the problems that we are trying to address – how should constraints be modeled, can critical residues be identified, and what is the rigidity of protein bio-logical assemblies and crystals? – are not new problems. The contributions, however, are in the form of new approaches to these problems, and in the design of tools that
enable us to make progress towards a large-scale validation of rigidity analysis of proteins.
1.2.1 KINARI: An Infrastructure for Rigidity Analysis of Proteins
The first tools that implemented rigidity analysis of biomolecules [34, 33, 79] of-fered few options for curating protein structure data files. Thus large-scale studies of rigidity analysis of protein biological forms could not be performed, because the structure files had to be cleaned and curated by hand. Also, the choices of model-ing of important stabilizmodel-ing interactions were fixed. To provide an infrastructure to easily test if and how rigidity analysis can function as a predictive tool for inferring biophysical properties of proteins, we have developed KINARI-Web. It is a general, well-tested, versatile web server for rigidity analysis of molecular structures. It pro-vides options for streamlining the curation of input protein data and for building protein biological assemblies and crystals. It relies on a mechanical model of a pro-tein that is customizable by the user, it performs rigidity analysis of the mechanical framework, and it includes an interactive visualizer for exploring the rigidity results. KINARI is an on-going, collaborative project in Ileana Streinu’s Linkage Labo-ratory. Several people have contributed over the years. Professor Streinu supervises the entire project. Naomi Fox wrote the C++ code for the pebble game algorithms. Her dissertation work focuses on improving accuracy in the representation of proteins as mechanical frameworks. Yang Li, a former undergraduate honors thesis student at Smith College, integrated into KINARI the visualizer tools, which are based on Jmol, an open-source Java 3D viewer for chemical structures. In my work I focused on developing the curation tools, which permit a user to designate which portions of a protein structure file should be retained. Along with Naomi Fox, I developed the infrastructure for calculating rigidity metrics for proteins that are analyzed by the pebble game algorithm. All of the work leading up to and including the release of
the KINARI-Web server was published in 2011 [20]. The first public release of the underlying software library [21], which implements the pebble game algorithm and provides support for several mechanical models, was made available in 2012.
1.2.2 Rigidity Analysis of Protein Biological Assemblies
The structure data in a PDB file does not always represent the biological functional form of a protein. And, a PDB file contains only the asymmetric unit of a crystal, which is the smallest repeating unit, from which the structure of the crystal can be inferred using symmetry, rotation, and transformation matrices. Because early tools for performing rigidity analysis of proteins did not provide automated tools for generating a protein biological assembly from experimental structure data, a large-scale, high throughput, study of the rigidity properties of proteins has not been performed. In collaboration with Tiffany Liu and other undergraduate students, I have developed the tools for generating biological assemblies of proteins and crystal forms of a protein from its asymmetric unit. I have also performed benchmarking testing on over 25,000 protein structures, that relied on streamlining the automated curation tools that I developed with the rigidity analysis algorithms developed in the Linkage Laboratory.
To determine if new insights into protein flexibility can be obtained by perform-ing rigidity analysis on biological assemblies and protein crystal structures, we have generated over 900 crystal lattices of various sizes for more than 300 proteins. Ini-tial results indicate that analyzing protein biological assemblies and crystals provides structural and functional information that would be missed if only the asymmetric unit of a protein were analyzed. The initial results were presented in 2012 at the ICCABS conference [13], and a subsequent, extended version of the study has been submitted to an invited issue of BMC Bioinformatics [35].
1.2.3 KINARI-Mutagen: Identifying Critical Residues
Predicting the effect of a single amino acid substitution on the stability of a protein structure is a fundamental task in macromolecular modeling. Not only did we want to make progress towards a tool that permits fast evaluation of the effects of
mutations that may not be easy to perform in vitro, but we also wanted to develop a
new application of rigidity analysis that was not dependent on in-depth knowledge of any one protein to help infer from the rigidity results important structural features of the biomolecule.
Towards this goal, we have developed KINARI-Mutagen, that identifies critical
residues based on the degree to which an in silico mutation to glycine affects the
pro-tein’s rigidity. We show that the residues we identify as critical in the protein Cram-bin correlate with residue that are conserved for several homologues of the molecule, and that they would not have been identified by other methods. We also generate 48 mutants for 14 proteins, and compare our rigidity-based results with experimen-tal stability measurements performed on the physical mutant proteins. Our rigid-ity analysis graph-theoretic approach at inferring the role of residues in stabilizing a protein’s structure was presented at the Computational Structural Bioinformat-ics Workshop [36], and subsequently published in the Journal of BioinformatBioinformat-ics and Computational Biology [37].
1.2.4 Correlating Rigidity Parameters with Experimental Data
In preparation for performing rigidity analysis, a mechanical framework of a molecule is constructed, in which various stabilizing interactions among atoms are modeled according to their strength. No systematic study has been conducted as to what is the most plausible, chemically validated modeling scheme. This is in part because initial tools for performing rigidity analysis of proteins did not provide op-tions for changing how important stabilizing interacop-tions should be modeled. All
previous implementations relied on heuristics, which allowed for extracting relevant biophysical observations, but only for a limited set of proteins. As such, there is no agreed-upon choice of modeling of important stabilizing interactions so that rigidity parameters correlate with experimental data.
We seek a possible correlation between rigidity parameters and this experimen-tal data. Towards this goal, we have used the KINARI software to systematically vary how stabilizing interactions are modeled. We propose a method to measure
how rigidity metrics correlate with experimental stability data in the form of ∆∆G
measurements. Our general method is not dependent on a case-by-case analysis of the proteins that are being studied, but instead requires only experimental data, and rigidity results, for a dataset of molecules. This work has been accepted for presen-tation at ACM-BCB 2012, the ACM Conference on Bioinformatics, Compupresen-tational Biology and Biomedicine [38].
1.3
Thesis Outline
This thesis is structured as follows. In Chapter 2, Background and Related Work, we provide a short review of relevant biology and chemistry principles, which are needed for explaining KINARI-Mutagen, and discussing biological results presented in subsequent chapters. Throughout this dissertation, rigidity results are compared and correlated with experimental data. The source of that experimental data is discussed in Section 2.1.4. In Section 2.2 we overview an experimental method and several simulation techniques for studying protein motions; we discuss the advantages and limitations of each. We then motivate the use of rigidity-based protein flexibility in Section 2.3. In Section 2.4 we present related work that relies on rigidity analysis to infer biophysical properties of proteins. Chapter 3 is a description of KINARI, the first contribution of this thesis; it is a collaborative project involving several people. There, we present our methodology of generating files of protein biological assemblies
and crystal structures, and give a system description of KINARI-Mutagen, developed to analyze mutant protein structures. In Chapter 4 we provide results of our studies in which we generated and analyzed over 900 crystal lattices of more than 300 protein structures. In Chapter 5 we discuss our results of using KINARI-Mutagen to identify critical residues that contribute to a protein’s stability. In Chapter 6, we present our general method for correlating rigidity metrics with experimental data, and discuss results of systematically varying how hydrogen bonds and hydrophobic interactions are modeled in biomolecules. In Chapter 7, we conclude with a summary, and briefly discuss future work.
CHAPTER 2
BACKGROUND AND RELATED WORK
Proteins are dynamic molecules composed of amino acids. In order to understand how a protein functions, we need to know how it moves and interacts with other molecules. We cannot observe directly protein motion on an atomic level. However, we rely on experimental methods to resolve the structure of proteins, to identify the identities and locations of their atoms. Computational methods are used to simulate atomic motion.
In this chapter we review key biology and chemistry concepts relevant to this thesis. This includes a short review of protein structures, and a high-level introduc-tion to experimental methods used to calculate a protein’s stability. We discuss an experimental method, as well as several computational ones, for studying protein dy-namics; we point out the strengths and limitations of each of them. We then review rigidity analysis, and motivate its use in studying proteins. We finish this chapter by highlighting a few of the research studies that have relied on rigidity analysis to infer biophysical properties of molecules.
2.1
Biology and Chemistry Primer
In order to understand a protein’s function, we need to know how it interacts with other molecules, how it bends, and how it flexes. We cannot observe directly pro-tein motion on an atomic level, so instead we rely on information from experimental methods to infer a protein’s stability and possible motions. The information from measuring the thermodynamic properties of proteins is used to infer protein stability.
We present here a short review of protein structures and a discussion of protein
sta-bility. We review∆∆G, an experimentally derived stability measurement of proteins,
which we rely on throughout this thesis.
2.1.1 Proteins: Polypeptide Chains of Amino Acids
Proteins are composed of amino acids joined end-to-end to form a chain. Amino acids are molecules containing an amine group, a carboxylic acid group, and a side chain that varies between the 20 different amino acids that occur in nature. Each of the 20 amino acids can be referred to by either its name, a three letter abbreviation, or a one letter abbreviation. For example, Alanine is referred to by its three letter
abbreviation, Ala, or its single letter designation, A.
The chain of amino acids, which is called a polypeptide chain, folds into a three dimensional shape, the protein’s tertiary structure. A single amino acid unit within a polypeptide chain is called a residue. Polypeptide chains vary in length, from as short as a few tens of residues, to as long as tens of thousands of residues. A segment
of a polypeptide chain is designated by a sequence of letters, such as AAVP, which
denotes a sequence of Alanine, Alanine, Valine, and Proline. The amino acids are
held in place in a defined spatial arrangement by chemical bonds between atoms that are close in 3-dimensional space. Arrangements of segments of a polypeptide chain,
or motifs, that occur frequently in nature are called secondary structures. α-helices
and β-sheets are two such secondary structures. Regions of the protein that form
compact, three-dimensional structures that often act independently of other regions of a protein are called domains. A protein may contain multiple domains.
Figure 2.1 shows a schematic representation of the amino acid proline, an atom
model of proline, a polypeptide chain of three amino acids, and an α-helix. A
schematic representation denotes the connectivity between atoms, but it does not describe the relative position of those atoms in three-dimensional space. A
bar-and-(a) (b) (c) (d)
Figure 2.1. Structure of proteins. Proline (schematic diagram shown in (a),
bar-and-stick model shown in (b)). Proteins are molecules made up of amino acids that are joined end-to-end to form a polypeptide chain (c), which is the protein’s primary sequence. Due to chemical interactions among the atoms, there is rotation allowed around some bonds, but not around others. Regular arrangements, or motifs, of parts
of the peptide chain are called secondary structures. A cartoon drawing of anα-helix,
an often-occurring secondary structure in proteins, is shown in (d).
joint model denotes the connections between atoms and their relative positions. The schematic representation of the polypeptide chain in Figure 2.1 denotes the protein’s
backbone, which is composed of alternating dark gray and blue atoms, designating
the carbon and nitrogen atoms, that lie along the green bonds. An oxygen atom, red, is attached to one of the carbons, while the side-chain, of which there are 20 kinds occurring in nature, is designated by the orange hexagon. Hydrogen atoms are the small gray atoms attached to the carbons or the nitrogens. The specific orientation of atoms and their physical interactions allows for rotation along some of the bonds, but not all. It is this rotation around some bonds that allows a protein to flex, bend, and interact with other molecules.
A protein’s tertiary structure is stabilized by chemical interactions that exist be-tween atoms that are close in proximity. A chemical bond is the attraction caused by the electromagnetic force between opposing charges, either between electrons and nuclei of individual atoms, or as the result of a dipole attraction. Dipole attractions are caused by non-uniform distributions of positive and negative charges on various atoms. Examples of bonds include covalent bonds, hydrogen bonds, and disulfide
bonds. Hydrophobic interactions are another form of interaction that help to stabi-lize a protein’s structure. The hydrophobics effect is the tendency of water molecules to exclude non-polar molecules, which leads to segregation of water and non-polar substances. Some of the bonds and interactions are strong, and are not easily broken, while others are relatively weak, and are known to continually break and re-form as the protein moves, flexes, and bends to perform its biological function. The amount of energy that it takes to break a bond is called the bond strength. Biologists measure bond strength in units of heat, measured in units of kilo-calorie (kcal). The strength of a bond or interaction is based on many factors, including the actual atoms that are involved. Sample bond strengths include 83-85 kcal/mol for a Carbon-Carbon single covalent bond, and 5-6 kcal/mol for a hydrogen bond [57] (where the involved bonding atoms are a hydrogen atom that is attached to a nitrogen, called the donor, and an oxygen, which is called the acceptor). The mole (mol) is a unit of measure-ment for the amount of substance or chemical amount. These two bond strengths are approximate; there is an observed range of bond strengths for a type of bond. Nonetheless there is a clear dichotomy between the strengths of different bonds.
Nearby water molecules, ions, as well as other, small compounds called ligands, interact with and affect the stability of a protein. These interactions all determine whether, and how, a protein bends, flexes, and interacts with other molecules. Fig-ure 2.2 shows the representations of two conformations of HIV-1 Protease; the protein transitions from one conformation to another. It plays a crucial role in the maturation process of the Human Immunodeficiency Virus, HIV. The protease has two flap-like regions that close in on the interior of the protein, where a catalytic reaction occurs. It is because of this motion that the protease performs its function.
Figure 2.2. Conformations of HIV-1 Protease. Proteins flex and bend in order to
perform their functions. HIV-1 Protease, which plays a crucial role in the maturation process of the virus that causes AIDS, transitions between several conformations. Movement of two flap regions renders the protein open (PDB file 1hhp, left) or closed (PDB file 1hvr, right). Images were generated by PyMol.
2.1.2 Determining Protein Structures
X-ray crystallography and protein Nuclear Magnetic Resonance (NMR) spec-troscopy are two experimental methods used to resolve the structure of proteins.
In preparation for X-ray crystallography, a protein is purified and crystallized. Then, X-rays are passed through the crystal, which causes the beam to spread into many directions due to its interacting with the electrons in the atoms of the proteins in the crystal lattice. The angles and intensities of the spread-out beam generate a detectable diffraction pattern, which is used to recreate a three-dimensional model of the density of electrons in the crystal. From this electron density map, the mean positions of the atoms in the crystal are determined. 1958 was when Kendrew [39],
et al. were the first to use X-ray crystallography to resolve the structure of a protein,
sperm whale myoglobin. For that work, Perutz and Kendrew were awarded the Nobel Prize in Chemistry in 1962. Since that time, more than 72,000 structures have been resolved using X-ray crystallography.
However, X-ray crystallography does not give information about the dynamics of a protein, for one key reason: it is an averaging of the atom positions in all of the individual proteins crystallized in the crystal lattice. Proteins perform their functions
by transitioning from one conformation to another via a transition pathway that most often involves the protein assuming a high-energy, or highly unfavorable, conforma-tion. High-energy conformers have short lifetimes, and proteins spend the majority of their times in energetically stable, or low-energy, conformations. Thus, the low prob-ability of a protein assuming the high energy conformation among all of the proteins that are crystallized in the crystal lattice means that X-ray crystallography produces a “snapshot” structure that is the average orientation from among the ensemble of conformations of the proteins in the crystal lattice. The critical conformations, during which large dynamic motions occur that are crucial to the function of a protein, are thus “invisible” to X-ray crystallography.
In protein NMR experiments, an aqueous sample of a purified protein is placed in a magnetic field. Distinct atomic nuclei absorb electromagnetic radiation and resonate at different frequencies. The NMR resonance data is analyzed to afford information about the structure and dynamics of the molecule. One drawback of NMR is that it usually is limited to the study of small molecules, but recent advances [63] have allowed it to be used on proteins in sizes upwards of 82 kilo Daltons (kDa); the dalton is a molecular mass unit. With these advances, the dynamics of proteins such as human INPP5E (PDB file 2xsw, 357 residues) and heat shock cognate protein ATP hydrolytic activity (PDB file 1ngb, 386 residues) might be studied using NMR, but analysis of proteins any larger than these is currently beyond the reach of this method.
2.1.3 Experimental Methods for Measuring Protein Stability
Although we cannot directly observe protein motion at the atomic level, we can calculate various properties of a molecule that allow us to reason about the protein’s stability and function. Thermodynamics is the study of energy conversion between heat and mechanical work. A protein performs work by virtue of its motion, and
indirectly we measure that motion by inspecting macroscopic variables such as tem-perature. Thermodynamic data, then, is indirect proof of the possible motions, and hence stability, of a protein.
The majority of small, single-stranded proteins exist predominantly in one of two
thermodynamic states, the folded, or Native (N), state, and the Unfolded (U) state.
These two states correspond to ensembles of molecular conformations. A protein may transition between the native and unfolded states according to a simple kinetic model:
U *) N (2.1)
where the rate from U to N is described by the rate constant kf, and the transition
from N to U is described by the rate constant ku. The dimensionless rate constant
for the equilibrium equation is given as follows:
Keq = ku kf = [U]eq [N]eq (2.2) where the square brackets designate the concentrations of the native and unfolded proteins at equilibrium. Concentration of a protein in different states is experimen-tally calculated in several ways. One such method is circular dichroism (CD) spec-troscopy [8], which measures the differences in absorption patterns of left and right-handed polarized light. The CD spectrum of a protein in the near ultraviolet spectral region is sensitive to certain aspects of tertiary and secondary structures. Thus, an analysis of the CD spectrum can be used to determine the presence of secondary
struc-tures. If a protein is known to have secondary structures such as α-helices, and if an
analysis of the CD spectrum reveals that there are no α-helices in the sample, then
the protein is assumed to be denatured, or unfolded. Using Equation 2.2, if a sample of proteins is calculated to contain a concentration of 80% folded proteins, then the
also referred to as the Gibbs free energy, the maximum amount of non-expansion work that can be extracted from a closed system, or the chemical potential that is minimized when a system reaches equilibrium at constant pressure and temperature.
The equilibrium constant is used to determine the conformational stability∆G of
a protein:
∆G=−RTlnKeq (2.3)
where R is the universal Gas constant, 8.314 K mol, andJ T is the absolute
temper-ature in Kelvin. In equation 2.3, ∆G is positive if the unfolded state is less stable
(disfavored) relative to the native state. Therefore, ∆G characterizes whether a
pro-tein tends to favor the folded, native state, or whether it tends to favor the unfolded state.
If∆G data is available for different conformations of the same protein, that
infor-mation can be used to infer the relative stability of the two protein structures. The
delta, or change, of the Gibbs free energy, ∆∆G, determines how a change in the
conformation or sequence of a protein affects the equilibrium constant of the protein species. For example, assume that you have two samples of the same protein, Sample 1 and Sample 2. The proteins in Sample 1 are known to perform their biological func-tion, while the structure of the proteins in Sample 2 have been experimentally
modi-fied. Also assume that the following∆G values have been calculated for both Sample
1 and Sample 2: ∆GSample 1 = 4.12kcal/mol and ∆GSample 2 = 3.27 kcal/mol.
The change of the Gibbs free energy, ∆∆G, between the two proteins is defined and
calculated as follows:
∆∆G= ∆GSample 1−∆GSample 2 = 0.85kcal/mol. (2.4)
Therefore, given two samples, Sample 1 and Sample 2, of a protein for which there is
the relative stability of the proteins in the two samples. Using Equation 2.4, if ∆∆G
is negative, then the proteins in Sample 1 are more stable than the proteins in Sample
2. In this example, because∆∆G is positive, the proteins in Sample 2 are more stable
than the proteins in Sample 1.
Throughout this thesis, the experimentally derived ∆∆G values for different
con-formations and/or mutated forms of a protein are taken as the “ground truth” values for the relative stability of two conformations of a protein, described in the next subsection.
2.1.4 The Protein Data Bank and the ProTherm Database
The Protein Data Bank [87] is a publicly accessible archive of experimentally de-termined structures of proteins, nucleic acids, and biomolecular complexes. More than 83,000 structures have been deposited into the PDB, of which approximately 72,000 were determined using X-ray crystallography. Proteins in the PDB are des-ignated by four letter and/or number codes, such as 1hhp and 1hvr. Each PDB file contains the experimentally resolve identities and relative coordinates of the atoms in the asymmetric unit of a molecule. Throughout this thesis, we rely on structures from the PDB to conduct many of our computational experiments.
The ProTherm database [42] is a collection of numerical data of thermodynamic
parameters, including∆∆G. Currently approximately 25,000 entries are in the database,
for 733 unique proteins. Throughout this thesis, observations that are drawn regard-ing the relative stability of two proteins usregard-ing rigidity metrics are correlated with
experimentally derived∆∆G values.
2.1.5 Lysozyme from Bacteriophage T4
The most-often referred to protein throughout this thesis is Lysozyme from bacte-riophage T4. Lysozymes are enzymes that damage bacterial cell walls by catalyzing hydrolysis of 1,4-beta-linkages between different residues. Lysozyme is a well
stud-ied protein, and thermodynamics data for the wild type and for many of its mutated forms is available in the literature and the ProTherm[42] database. We used lysozyme thermodynamics data to evaluate and determine if the rigidity analysis results corre-lated with the known, calcucorre-lated kinetic and stability properties of the protein. Of the more than 25,000 entries in the ProTherm database, 1,719 of them are for vari-ants of lysozyme from bacteriophage T4, more than any other protein. It is because of this that the protein was used throughout this thesis. The rich dataset of ther-modynamic properties of lysozyme from Bacteriophage T4 enables us to more easily perform correlation studies.
2.2
Methods for Studying Protein Motions
Proteins are dynamic structures. They fluctuate on the atomic level, and they transition between distinct states (Figure 2.2). We want to study their dynamics, so that we can understand how they function. Unfortunately, there are no existing experimental methods that allow us to watch, in real-time, the individual atoms mov-ing within a protein. In this section we briefly review an experimental method, and several computational methods, used to study protein motions. Computational meth-ods have the advantage over experimental methmeth-ods in that they can describe protein dynamics completely. However, a fully accurate computational method would require a perfect force field function describing the protein-solvent system and the potential energies of all of the involved atoms. Existing force fields are used in molecular dy-namics simulations. We describe molecular dydy-namics, the Go model, along with the
Morph Server from the Gerstein Lab. We list the limitations of each technique. The
short review of these methods is not meant to be comprehensive. Rather we review them here with the goal of placing rigidity analysis, described in Sections 2.3 and 2.4, within the context of other experimental and computational methods.
2.2.1 An Experimental Method for Visualizing Protein Motions
One recently developed exciting experimental method for studying protein dy-namics is Fluorescence Resonance Energy Transfer (FRET) [14, 58]. It relies on fluorophores, which are chemical compounds that absorb certain wavelengths of vis-ible light, and transmit or reflect others. When two fluorophores, one a donor in an electron excited state, and one an acceptor, are close in proximity, energy is trans-ferred between the two. The efficiency of this transfer is inversely proportional to the sixth power of the distance between the donor and acceptor [44]. Measuring the efficiency of the energy transfer permits determining the distance between the two
fluorophores. Diez, et al. [15] have used this technique to study F0F1-ATP synthase.
They bound an acceptor fluorophore to the protein’s b-subunit, and the donor to the
γ subunit, and measured their intensities and their intensity ratio, over hundreds of
milliseconds. This revealed three distinct states of the protein, and the donor-acceptor distances were used to identified the protein’s molecular mechanism. However, one of the current limitations of single-molecule FRET is that only the change of the distance between a single pair of fluorophores is able to be measured. Thus even for this experimental method viewing the movement of individual atoms is not possible.
2.2.2 Simulating Protein Motions: Molecular Dynamics
Molecular Dynamics relies on numerical methods using Newton’s equations of motion to calculate trajectories of a protein’s atoms. It requires an empirical po-tential energy function. Its theoretical foundations were developed in the 1950s [4]. The first demonstration of an MD simulation, in 1977, was that of a 3.2 picosecond simulation of bovine pancreatic trypsin inhibitor [55]. However, many large domain motions that are important to the functioning of a protein occur on the microsecond to millisecond time ranges[31]. Even with progress in developing force fields for use in MD, protein dynamics on these long timescales are still beyond the practical reach
of MD simulations. Part of this is due to the large computational resources that are required, even for small simulations. Some of these limitations can be overcome, but doing so requires thousands of processors [64] and specialized algorithms, and even then simulations may require weeks of computation time.
2.2.3 Minimalist Models for Simulating Protein Motions
To address some of these limitations of MD, several minimalist models have been
proposed. In the 1970s, Ueda et al. [84] and Taketomi et al. [75], modeled a protein
as a chain of one-bead amino acids, and utilized a simplified force field of attractive and repulsive non-bonded interactions among the beads, to simulate a protein’s mo-tions. Since then, one-bead minimalist models have been developed for protein folding computational experiments [9], which require only a starting sequence, and are not dependent on the tertiary contacts that exist in the native state of the biomolecule.
2.2.4 Inferring Protein Conformations from Structure Data
In still another approach, the Yale Morph Server [41] produces three-dimensional
animations of plausible domain motion pathways between two known conformations of a protein. Intermediate conformations are extrapolated from a trajectory between one conformation of a protein to another. Although this method is relatively quick, requiring usually no more than 30 minutes to generate a morph, there is no time-scale, kinetic, nor dynamic information that is used by the server. In recent extensions to
the originalMorph Server, energy minimization is used to calculate the intermediate
frames and conformations of a protein, which produces results that are usually much better than morphs made by simple linear interpolation [17]. Still, the real interme-diate conformations might be quite different from those that are hypothesized by this method, and the authors state that the morphs generate at worst a semi-plausible pathway between two submitted protein subunit conformations.
2.3
Rigidity Based Protein Flexibility
Rigidity analysis of proteins is an alternative to physics-based simulation methods, that instead analyzes a single static structure of a protein. Its goal is not to predict how a molecule bends and flexes, or to simulate a molecule’s motions, but instead identify which parts of it are rigid. In this section, we give a short historical review of rigidity analysis, we describe how proteins are modeled as mechanical frameworks, and we describe pebble game rigidity analysis of these mechanical structures. The mechanical framework that is presented in this section is just one of several that have been developed. A description of another mechanical framework is available [20].
2.3.1 Rigidity of Bar-and-Joint Frameworks
The study of rigidity and flexibility of bar-and-joint frameworks was developed by 19th century engineers attempting to analyze cross-bracing of steel structures. In 1864 James Clerk Maxwell [53] identified a simple counting rule to determine the rigidity of such structures. This counting rule was proven correct in 2 dimensions by Laman [45] in 1970, and subsequently was modified for the analysis of 3-dimensional structures, called body-bar-hinge framework [76]:
Theorem (Tay)LetGbe a graph withn vertices and medges. Gis the
graph of a generic minimally rigid body-bar-hinge framework if and only
if: any subset ofn’ vertices inG spans at most 6n’-6 edges; andm=6n-6.
2.3.2 Mechanical Modeling of Proteins
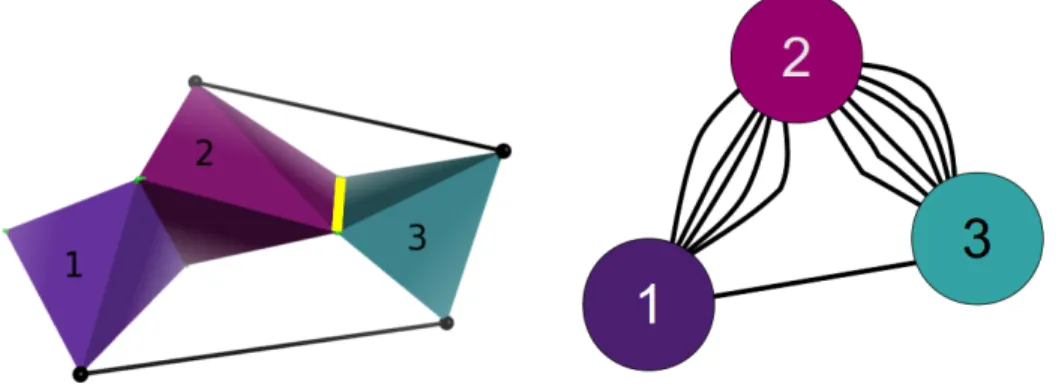
In the KINARI software, body-bar-hinge 3-dimensional structures are used to model the mechanics of proteins. Atoms along with their covalently bonded neigh-bors form bodies. Covalent bonds between bodies are modeled as hinges, and other stabilizing interactions such as hydrogen bonds and hydrophobics are modeled as hinges or bars. In Figure 2.3 we show a schematic of a protein, and how the mechan-ical model is constructed.
Figure 2.3. Modeling proteins as body-bar-hinge frameworks. Solid lines designate
covalent bonds, and dashed lines represent distance constraints that arise due to angle constraints imposed by bonds; covalently bonded atoms form bodies (for example the
purple region), shown on the left. R1 and R2 denote two residues. Thebody-bar-hinge
framework for the protein (left) is shown on the right, where body 2 is composed of
C1α, C, O, and N2, while body 3 is composed of C, N2, and C2α. A hinge between
two bodies allows for a one-degree-of-freedom rotation of one body about the other, along the hinge axis.
2.3.3 Pebble Game Rigidity Analysis
Because the pebble algorithm is run on a graph, the mechanical framework must be associated to a set of nodes and edges. From the body-bar-hinge framework, the graph is constructed in the following fashion: each body is associated to a distinct node, each bar in the mechanical framework is associated to an edge between two nodes, and hinges in the mechanical framework are associated to 5 bars between the two nodes that represent the rigid bodies (Figure 2.4). Because two bodies in three-dimensional space have six non-trivial degrees of freedom between them (three
translations along and three rotations around the x, y, and z axes), placing five
bars between two bodies is equivalent to retaining just one of those six degrees of freedom, which represents the mechanical behavior of a hinge. An efficient pebble game algorithm [34] decomposes this graph into clusters which correspond to rigid components in the framework.
The algorithm starts with 6 pebbles on each vertex of the associated graph, and reasons about the edges one at a time, and accepts or rejects them. To be accepted, an edge must have at least 7 pebbles distributed somehow on its two endpoints. If not
Figure 2.4. Abstract mechanical framework of a protein’s structure. An abstract
model illustrates how bars would be placed between bodies, if hydrogen bonds or other stabilizing interactions existed between them (left). The graph (right) is built by associating each rigid body to a node, and hinge to 5 bars, and a bar to each edge. Here bodies 2 and 3 on the left are represented as having 6 edges between the nodes in the graph that represent the two bodies, 5 edges for the hinge (depicted as yellow in (a)), and 1 for the bar.
enough pebbles are present, they are collected using a depth-first search approach. An accepted edge consumes one pebble. As more and more edges are accepted, they are combined into rigid components. The algorithm ends when all edges have been considered. A formal proof of correctness for this algorithm can be found in [46].
2.4
Rigidity Based Protein Flexibility: Related Work
Rigidity analysis of proteins has been demonstrated on a handful of proteins, and has been used to infer biophysical properties of several biomolecules. In this section we review a few of these published results.
Rigidity analysis of protein structures was first introduced in the work of Thorpe,
et al.[79]. They studied different states of HIV-1 protease and showed that the rigid
clusters in open and closed conformations of the protease are correlated with the known mechanical properties of the cantilever flaps of the molecule [80].
Raderet al.[69] simulated the thermal unfolding of Rhodopsin, a trans-membrane
this method, hydrogen bonds are removed from the molecular model one after another, from weakest to strongest, and rigidity analysis is performed on the model after each removal. A “folding core” is identified when there exists only one rigid cluster with at least three residues of two or more secondary structures. The computed core was correlated with experimental results, and confirmed via a visual inspection of the protein using insights of its physical properties.
In a comparative study of the rigidity analysis of 62 protein structures from six
different protein families, Wells et al.[86] demonstrated that the main-chain rigidity
of a protein is very sensitive to small structural variations. In that study, Wells concluded that the modeling of hydrogen bonds needs to be chosen carefully so that specific hypotheses about the rigidity of particular proteins can be formed.
Recently, Fox, et al. [22], used a benchmark dataset of 32 PDB structure files
to validate the modeling in KINARI against a dataset that was analyzed using the
Gerstein Lab’sRigidFinder algorithm [1]. Fox introduced a metric called the cluster
decomposition score to compare KINARI’s rigidity results against Gerstein’s struc-tural predictions. They found that the sensitivity of the cluster decomposition score is dependent on the choice of the hydrogen bond energy cutoff value, which designates a threshold at which these bonds are retained in the molecular model.
Ivet Bahar, et al. [68] have relied on elastic network as well as constraint
net-work models of freely rotating rods to predict protein folding nuclei. Both methods were verified against data that was attained from native state hydrogen-deuterium exchange experiments. Hydrogen-deuterium exchange gives information about the solvent accessibility of various parts of a molecule, and thus the tertiary structure of a protein. In these studies, the role of specific interactions in protein folding was also investigated.
Radestock et al.[25] used a dilution analysis to study the different states of
func-tions best in a moderate temperature environment, while a thermophile thrives best at relatively high temperatures. In that study, macroscopic properties of the pro-teins were correlated with rigid cluster sizes, using Cluster Configuration Entropy (CCE) [82]. CCE is a function of the probability that a vertex in the mechanical
model is part of a cluster of size s. To compute CCE, a normalized cluster number,
ns is defined as the number of clusters of sizesdivided by the total number of vertices
in the mechanical model. The probability that a vertex belongs to an s-cluster, ws,
and the CCE value of the entire mechanical model are given as the following:
ws = sns P ssns (2.5) CCE =−X s ws ln ws (2.6)
For two conformations of a protein, the one with the higher CCE value is more
disor-dered, and hence is more unstable. Radestocket al. used the CCE descriptor to show
that in approximately 70% of the proteins in their dataset, the thermophilic molecules transitioned from rigid to flexible at higher temperatures than the mesophilic homo-logues.
AJ Rader, et al. have used rigidity theory to relate the constraint network of
proteins to that network’s deformability [70]. A protein’s transition state can be determined from the inflection point in the change in the number of independent bond-rotational degrees of freedom (floppy modes) of the protein as its mean atomic coordination decreases. Rader was concerned with the calculation of a universal property of proteins that relied on a dilution analysis. Rader performed multiple rigidity analyses, as many as there were hydrogen bonds in the protein.
CHAPTER 3
KINARI: AN INFRASTRUCTURE FOR LARGE-SCALE
RIGIDITY STUDIES OF PROTEINS
Rigidity analysis of proteins was initially implemented in MSU-First [34, 33] and
the first online tool was FlexWeb [79]. Those applications had several limitations,
including a need to curate protein data by hand, and the choice of modeling of important stabilizing interactions was fixed. To address several of these limitations – and to provide an infrastructure for performing large-scale validation studies of rigidity analysis of molecules – we have developed KINARI-Web. It is a second generation free online server for protein rigidity analysis, that implements a variation of the pebble game algorithm that was developed by Jacobs and Hendrickson [32, 46].
KINARI-Web is available at http://kinari.cs.umass.edu.
3.1
Introduction and Background
Proteins interact with organelles, other proteins, ligands, and ions. Thus, per-forming rigidity analysis of proteins outside of the context of their neighbors might cause important structural or functional information to be missed.
The structural data that is deposited into the PDB is the asymmetric unit of a protein’s crystal, which may or may not be the same as the biological assembly (or functional form) of the protein. To help facilitate the rigidity analysis of biological assemblies of proteins, we have developed BioAssembly. It is a feature of the curation portion of the KINARI [20] software, that permits the building of biological assemblies or their sub-components, from the asymmetric unit in a PDB file. We have also
developed KINARICrystal, that allows a user to generate a structure file representing the crystal lattice of a protein, in which many instances of a molecule are nestled side-by-side, as they do in the crystal used for X-ray crystallography experiments. The KINARICrystal tool was developed in collaboration with post-baccalaureate students working with Ileana Streinu, while the BioAssembly tool was designed with the help of Tiffany Liu, an honor’s thesis student at Smith College, advised by Streinu.
In addition, KINARI-Lib V1.0 [21] has been released. It is a C++ library that implements the pebble game algorithm and provides support for body-bar-hinge and bar-joint mechanisms.
3.2
System Description
KINARI-Web is comprised of two phases: (1) data input and curation, and (2) rigidity analysis and visualization.
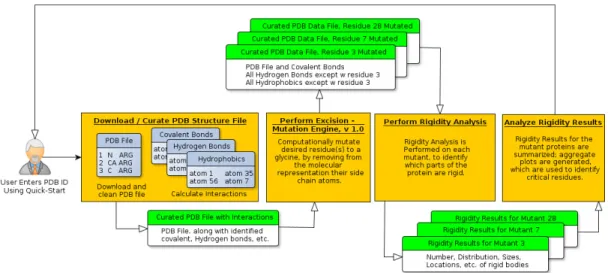
Curation is composed of four steps. In the first step, a protein structure file is either uploaded to the server, or the user designates a four-character protein code, and KINARI fetches that structure from the PDB. KINARI-Web lists the models, chains, ligands, water molecules, etc. that are included in the uploaded PDB file, and the user selects the ones to be retained. In the second step of curation, hydrogen atoms
are added using the Reduce software. In the third step, stabilizing interactions such
as single and double covalent bonds, resonance bonds in peptide units, and disulfide
bonds are calculated. Hydrogen bonds are determined using theHBPlussoftware, and
hydrophobic interactions are identified using the algorithm described in in the ASU-FIRST User Guide [11]. Each covalent, resonance and disulfide bond is assigned an energy, in kcal/mol, that is determined from a table of average energies for each bond type and pair of atoms that are involved in the interaction. The energy of a hydrogen bond is computed by the KINARI software using the Mayo energy function [54]. In the final curation step, the computed chemical interactions that exist between atoms
Figure 3.1. Curation, modeling, and rigidity analysis in KINARI. We model proline
as a mechanical structure, from which an internal multi-graph is built. A pebble game algorithm calculates rigid components in the multi-graph, from which the protein’s rigid clusters are inferred. Image adapted from [20].
in the PDB-formatted input file are presented to the user, who can designate which of them should be retained, and which should be removed. Chemical interactions not identified by KINARI are supplied as user-defined constraints.
In the second phase of KINARI-Web, a user designates how different chemical interactions should be modeled in the mechanical framework of the protein. This is
a novel feature of KINARI, not available in FlexWeb. KINARI-Web then generates
a mechanical model of the protein, and builds the associated graph, that is used as input to a pebble game algorithm. The output of the pebble game is then inter-preted in terms of clusters of atoms within the protein. The entire process of building the mechanical framework, generating the association graph, and inferring the rigid-ity results from the output of the pebble game algorithm are shown in Figure 3.2, reproduced from [20].
After rigidity analysis has been performed, the KINARI-Web visualizer is used to explore the rigidity properties of the protein. The input biomolecule is displayed along with its calculated rigid regions. In Figure 3.2, left, we show the rigidity results of HIV-1 Protease (PDB file 1hvr). KINARI-Web’s visualizer options enable a user to investigate the rigidity results. Among these options, a user can display certain clusters while hiding others, zoom in to investigate specific parts of the protein, or