Vol. 2 Issue 11, November – 2018, Pages: 1-9
Unmanned Ground Vehicle (UGV) Navigation System using
GPS
Budi Setiyono1 , Muarif Fandhi A2 ,Sumardi3 and Aris Triwiyatno4 Electrical Diponegoro Departement, Diponegoro University, Semarang, Indonesia 1
[email protected], 2 [email protected], 3 [email protected], 4 [email protected]
Abstract— Unmanned Ground Vehicle (UGV) is a mechanical device that moves on the sky and serves as a means of carrying, transporting something, or mapping the location and controlled remotely. UGV is widely used in a variety of terrain difficult to reach or dangerous for human safety, eg for the location of a natural disaster, radiation, or to defuse the bomb in the military. This research was designed and manufactured human machine interface for remote control system and displayed the UGV movement according to target poin that have been determined. UGV movement data obtained from GPS sensor and encoder. Received data would be showed on computer used visual studio. Measurement data was sent wirelessly from the microcontroller to the computer using the YS-1020UA module.
The results showed that the movement of UGV can be displayed on the interface on the laptop. Received Datawas displayed in the form of graphs and data in tables form. UGV can be remotely controlled to move from one target to another, moreover it can also be controlled manually or automatically which can be set throgh the interface.
Keywords: Human Machine Interface, UGV, GPS, YS-1020UA, Visual Studio
1.INTRODUCTION
In this globalization era, technological developments applying the sciences of electronics and control systems have been more numerous and popular.It can be seen by the many tools that apply a blend of science and control systems, one of them in particular robot navigation systems UGV operation. UGV is a mechanical device which is operated either manually or automatically on the surface of the ground to bring or transport something without any direct human contact.In some work related to the supervision and observation to areas inaccessible UGV system can help simplify because UGV can be controlled remotely.
The system can be used to overcome the difficulties in monitoring and observation work on UGV isautopilotcontrol system. Autopilotcontrol system has more capabilities in decision making and completion of the mission, the system is able to complete the task independently in a difficult environment. The sensors are typically used in the autopilot system include GPS, compass, encoder, magnetometers, cameras and so on. By using GPS, the position of the robot such as latitude and longitude can be determined. GPS sends data using serial communication interface.
Onautopilotsystemhuman machine interfaceis used as a control room.Human machine interface(HMI) is a system that connects between man and machine technology. HMI principle is often used in modern control systems because the operator can view or control the process at theplantdirectly from the remote. HMI display data on operator and providesinputandoutputcontrol for operators in various forms, including charts, tables,touch screen,and so forth. HMI on UGV autopilot system is used to visualize the data sent from the microcontroller as well as provide input to the microcontroller to run UGV autopilot heading to the point of predetermined targets.
2.METHODE 2.1 System Design
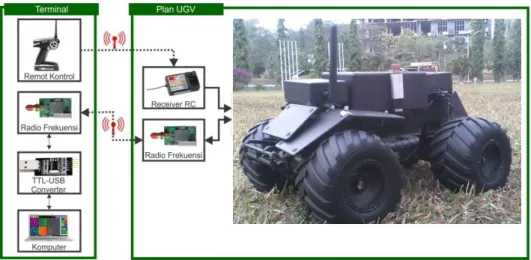
System autopilot mechanism in this UGV consists of various components include a GPS sensor, digital compass module, controller, UGV devices, and computers. The controller used to regulate the movement of this system is a microcontroller. Microcontroller tasked to retrieve data such as latitude, longitude, and orientation UGV of GPS and compass sensors as input data processing autopilot control algorithm in order to get a control signal which will be given in the form of a DC motor actuators and servo motors. Aside from being a controller, microcontroller also
duty to transmit the GPS data to a computer. Computers have a role in determining the position of the starting point UGV and provide the desired target point and then sent to a microcontroller via serial communication and monitoring GPS data, such as
Vol. 2 Issue 11, November – 2018, Pages: 1-9
latitude and longitude coordinates of the position, orientation, and velocity UGV. Computers can also receive input from a joystick to control UGV manually.
Fig 1. Block diagram of the control system autopilot on UGV
2.2 Wireless Modul Design
The process of sending data from UGV to computer or from computer to UGV require medium. Its medium used in this thesis is a module YS-1020UA. Module YS-1020UA an electronics module which generates radio waves with a frequency of about 433 MHz. YS-1020UA module associated with each device that is computer and microcontroller. In addition to designing the communication between the module YS-1020UA with microcontrollers, modules YS-1020UA also need to be connected to a computer. For a computer to be connected to the module YS-1020UA, we need a circuit module as a serial communication interface.
Fig 2. YS-1020UA pin modul configuration
Fig 3. USB to RS232 TTL PL2303HX converter configuration
2.3 Human Machine Interface Design
HMI is a software interface in the form of a Graphical User Interface (GUI) -based computer that became a liaison between the operator or machine controlled equipment as well as acting at the level of supervision. So in general HMI functions to enable operators to oversee the process and exercise control over theplant in the control process.
Vol. 2 Issue 11, November – 2018, Pages: 1-9
Visual Studio is a programming language created by Microsoft that can be used in the making of an application program.Visual studio had major components, namely :
a. Tittle Bar, shows the name of the project (application program that is being made)
b. Menu Bar, contains the menu - the main menu which is owned Visual Studio and on each - each menu are sub - sub menu more specific.
c. Form, places to design applications that we are creating..
d. Toolbox, consists of some object class (tools) that are used in making applications.
e. Project Explorer Windows, a window to showcase projects, forms, ataumodul-module visible in the creation of applications.
f. Properti Windows Window to display and change the properties-properties owned by an object. g. Code Windows, Windows that is used to display or coding.
h. Form Layout Windows, a window showing the relative position of the monitor screen form..
2.3.2 Software Design with Visual C# 2010
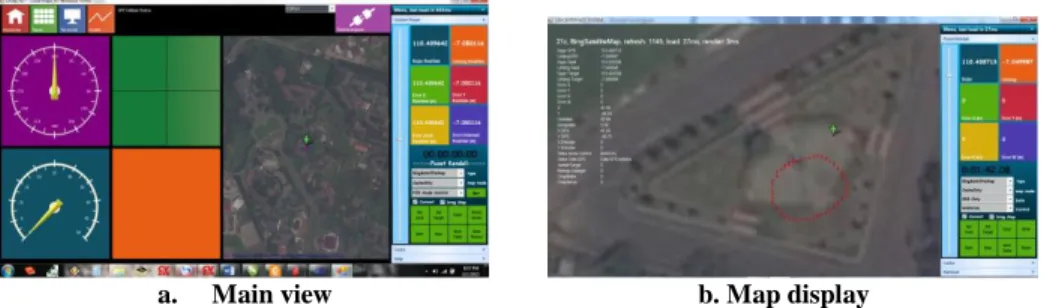
Software Visual C # 2010 provides some of the facilities that can be used for system design in this thesis, among others, the integration of GPS data with Google Map, serial communication between the microcontroller with a computer either in receiving data and send commands to and from the microcontroller, the determination of the starting point as well as the position of the target point UGV, visualization of data sent by the microcontroller in the form of graphs, and creating a table for the storage of such data on a temporary basis. In general, software design in Visual C # 2010 consists of:
A. Data conversion from GPS to Google Maps
Format GPS data sent by the microcontroller is already in dd.dddd format so that data can be directly integrated with the data format of latitude and longitude on Google Maps
.
a. Main view b. Map display
Fig 4. Home view of Visual C# 2010
Fig 5. Angle Orientation and speed display of UGV
B. Readings display orientation angle and speedUGVonInterface
User able to see the reading orientation and position of UGV. Fig 5 shows value orientation obtained from GPS through a reading of the microcontroller.
C. Communication between computer and microcontroler program
The contents of this program aims to address GPS data and digital compass which received the computer.In Visual C # 2010, serial communication component is provided.So that the computer can communicate with the microcontroller it is necessary to adjust the arrangements in advance with the properties of theserial port.
Vol. 2 Issue 11, November – 2018, Pages: 1-9
Data is used to store data sent from microcontroller such as longitude, latitude, longitude beginning, latitude early, longitude targets, latitude targets, error x, error y, error distance, error orientation, the data x, y data, orientation, crisp motors, crisp servo, GPS status and status control mode.
.
Fig 6. Serial port setting.
Data sent from microcontroller series, there are several real data was also obtained from the user interface or computer, but in this case accidentally sent to the user in order to ascertain whether the data has been sent from the computer actually been received by the microcontroller in full or not.
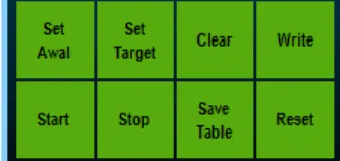
D. Starting and destination point selection of UGV
This program aims to define the starting point UGV position reference and target points that will be addressed by UGV. To determine the starting point needs to be made eventbuttonAwal_Click UGV on the button.The starting point in the form of latitude and longitude UGV be stored in a variable BujurZero and LintangZero which has a string data type.In order to form the starting point symbols appear on the map,a class named GMarkerGoogle and GMarkerRect need to be initialized to obtain the object m and mborders.
Fig 7. Starting and Target Button at Interrface
To specify the target point made eventbutton Target_Click on the button. Target point in the form of latitude and longitude that will be addressed is stored into the variable targetLintang and targetBujur with string data type. TargetLintang and targetBujur variable is the difference between longitude and latitude are specified via a map with a variable starting point has been given at the time of determining the starting point UGV.
E. Program to display charts and data tables
The program aims to display the data received by the computer can be displayed in tables and graphs. To be able to display data in graphs, variable on a graph that has been gained through serial communication needs to be converted in advance of string data types into a double.. This feature is showed in fig. 8.
Vol. 2 Issue 11, November – 2018, Pages: 1-9
3. RESULT AND ANALYSIS
Testing will be done on the study include testing the system in the form of testing to see the interface as well as how to operate UGV through theinterface.
3.1 Interface System Testing
The test system includes means mengoperasian UGV interface through the interface. Before operating UGV first run the program interface.
3.1.1 Display Home Interface
Fig 9. Display Home Interface
Device USB to RS232 TTL PL2303HX connected to the computer. Then the user selects the port that is used to look at the device manager found on the computer, and then choose the same port that is inside interface. Port that has been selected then the user presses a button to connect. This button is used to connect the module YS-1020UA connected to the computer with the YS-1020UA modules are connected microcontroller on UGV
Fig 10. Port selection at Interface and connect button
In Figure 11, it appears that after the start button is pressed, the map will instantly update a location corresponding to the input of GPS data that exist on UGV. GPS data on the interface is marked with a red dot. The image above shows the view UGV movement based on GPS data..
Fig 11. Display UGV movements with GPS data on the Interface
3.1.2 Interface Experiments on Autopilot UGV mode
Testing is done by determining the starting point and the target point UGV.The starting point UGV obtained from the GPS data to the interface where the GPS data is symbolized by a red dot.Target point is determined by the user with either a single
Vol. 2 Issue 11, November – 2018, Pages: 1-9
target or multiple targets.The starting point is indicated by the color green UGV R while the target point are shown in red.Once the target is determined then the next thing to do is select the mode fuzzy as a control to run UGV towards the specified target.
Fig 12. Starting poin and target View
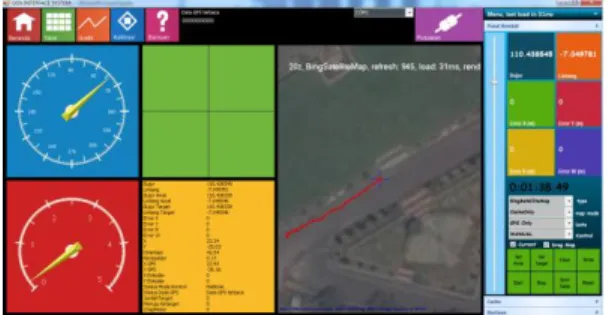
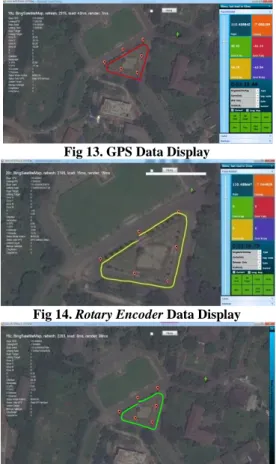
Figure 12 shows the movement UGV from the starting point indicated by the green toward the target point is shown in red. Users can select data tracking UGV want to display. There are 3 options first data GPS data, data from the second and third rotary encoder complementary filter the data. Display interface in Figure 13 shows that the data derived from the GPS found on UGV. Display interface in Figure 14 shows the movement of data obtained from rotary encoder UGV contained in UGV. While the display interface in Figure 15 shows the movement UGV obtained from the combined data encoder and GPS.
Fig 13. GPS Data Display
Fig 14. Rotary Encoder Data Display
Fig 15. Complementary FilterData Display
3.1.3 Transmission Testing
Testing is done by running UGV which has integrated therein radio frequency and transmit data in the form of a variable increment, then UGV run away from the terminal. On the other frequency radio terminal is read using a computer. Observation data is done until the start of data sent is lost or radio frequency does not receive data intact. From the tests conducted found safe distance which can be reached by radio frequency is used as far as 80 meters.
Vol. 2 Issue 11, November – 2018, Pages: 1-9 3.2 Testing on Multiple Target
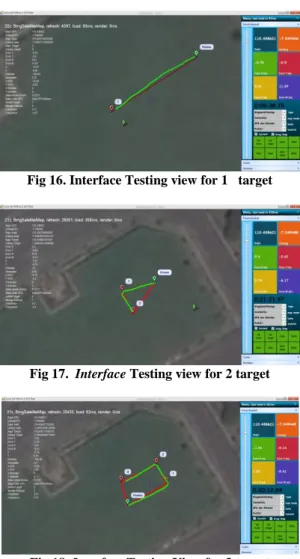
The testing process includes the display interface UGV in towards the target on autopilot. The way to determine the starting point and the target point on the interface. In these testing times determined UGV moving toward one target, two goals and three targets. It also displayed a graphic image of each test.
Fig 16. Interface Testing view for 1 target
Fig 17. Interface Testing view for 2 target
Fig 18. Interface Testing View for 3 target
Figure 16 shows the interface of the current move towards UGV 1 targets. Figure 17 shows the interface display when UGV move with two targets. Figure 18 shows the interface of the current 3 UGV moving toward the target. Data were obtained to determine the movement of UGV these figures using data from complementary filter.
Figure 19 displays a graph error distance, orientation and speed error UGV with 1 targets.
Fig 19. Graphical Display of distence error , orientation error andvelocity of UGV
E rr or J ar ak E rr or Or ie n tas i K ec epa ta n Waktu
Vol. 2 Issue 11, November – 2018, Pages: 1-9 4. CONCLUSION
From the testing that was done was concluded that the interface is capable of displaying UGV movement towards various targets. This can be seen in the figure that UGV able to follow targets that have been given either. The maximum distance interface capable of receiving data from UGV as far as 80 meters. Besides interface capable of displaying graphics UGV current movement towards this target.
5.
ACKNOWLEDGMENT
The authors would like to express their sincere gratitude to the Directorate General of Higher Education (DRPM DIKTI) and Diponegoro University (UNDIP) for the financial support received under the project of “Hibah Bersaing” Research Grant Year 2016 by BOPTN UNDIP (contract no. DIPA: 022/SP2H/LT/DRPM/II/2016 , Pebrury 17th 2016)
REFERENCES
[1] Pradiptya, Iswan, Rancang Bangun Wahana Terbang Tanpa Awak UGV Dengan Sistem Kendali Kestabilan Orientasi Roll Dan Pitch, Tugas Akhir Universitas Diponegoro, Semarang, 2011.
[2] Erginer, Bora danErdinçAltuğ, Modeling and PD Control of a UGV VTOL Vehicle, Proceedings of the 2007 IEEE Intelligent Vehicles Symposium Istanbul, Turkey, 2007.
[3] Bouabdallah, Samir dan Roland Siegwart, Backstepping and Sliding-mode Techniques Applied to an Indoor Micro UGV, Proceedings of the 2005 IEEE International Conference on Robotics and Automation Barcelona, Spain, 2005.
[4] Li, Jun dan Li, Yuntang, Dynamic Analysis and PID Control for a UGV, Proceedings of the 2011 IEEE International Conference on Mechatronics and Automation Beijing, China, Agustus 2011
[5]
Martinic,Gary, The proliferation, diversity and utility ofground-based robotic technologies , Canadian Military Journal, Vol. 14, No. 4, Kanada 2014[6]
Miaolei Zhou dan Shanbo He, Research of Autonomous Navigation Strategy for an Outdoor Mobile Robot, College of Communication Engineering, Jilin University, Changchun, 2014[7]
Nurpulaela, Lela, Perancangan Human Machine Interface Dengan VB6.0 Untuk Visualisasi dan Monitoring Kecepatan Motor AC 3Phase pada PLC OMRON CJ1M, Teknik Elektro, STT Bina Tunggal, Bekasi, 2012[8]
Laksono, Teguh Pudar Mei, Sistem Scada Water Level Control Menggunakan Software Wonderware Intouch, Teknik Elektro, Universitas Negeri Semarang, Semarang, 2013[9]
Wahyu, Fahmi, Desain Kontrol Autopilot menggunakan GPS pada Kapal, Jurusan Teknik Elektronika, PENS-ITS, Surabaya, 2011.[10]
Putra, Agfianto Eko, Belajar Mikrokontroler Teori & Aplikasi, Gava Media Yogyakarta, 2006.Authors
Budi Setiyono, born in Purbalingga on May 21, 1970, completing his undergraduate and master's degrees in the Electrical Engineering Department of Gadjah Mada University in the field of Electronic Signal Processing. Become a lecturer in Electrical Engineering Department Diponegoro University since 2000. The field of science is a technique of automatic control with specialization in modeling and intelligent Control
Muarif Fandhi A, born on August 2th 1968 in Semarang, Central Java. Graduated in from Elementary School Pedurungan Tengah, SMP 9 Junior High School , SMA 2 and bachelor in Diponegoro University, Semarang, majoring in Electrical Engineering, Faculty of Engineering, majoring Instrumentation and Control Engineering in 2016.
Vol. 2 Issue 11, November – 2018, Pages: 1-9
Sumardi, born on November 11th 1968 in Sukoharjo, Central Java. Graduated as a bachelor in Diponegoro University, Semarang, majoring in Electrical Engineering, Faculty of Engineering, in 1994. Got a master degree in 1998, majoring Instrumentation and Control Engineering Physics Program, Institute of Bandung Technology. Has followed some trainings including PLC training organized by OMRON as PLC producers and digital signal processing training organized by Institute of Bandung Technology. Has done some researches such as "Perancangan Sistem Kontrol Suspensi semi-aktif menggunakan Fuzzy Logik Control pada Model Kendaraan Seperempat", "Pengembangan Sistem Peringatan Dini Banjir berbasis SMS dan Web Studi Kasus Sungai Garang Semarang", and also has cooperated in the installation of flood early warning instrument with PT Jasa Tirta, BBWS Southeast Sulawesi, etc. Current busyness is as a lecturer and researcher at Electrical Engineering Department, Faculty of Engineering, Diponegoro University, Semarang, Indonesia
Aris Triwiyatno, recieved the B.S. degree in Electrical Engineering from Sepuluh Nopember Institute of Technology, Surabaya, Indonesia, in 1998, and the M.T. and doctoral degrees in the same college in 2005 and 2011. He has been a lecturer at the Department of Electrical Engineering, Diponegoro University, Semarang, Indonesia since 2000. His research interests are on the fuzzy systems including fuzzy control systems and fuzzy neural image processing, and robotics.